

Abstract
This article reviews the new physics and new applications of secondary ion mass spectrometry using cluster ion probes. These probes, particularly C60, exhibit enhanced molecular desorption with improved sensitivity owing to the unique nature of the energy-deposition process. In addition, these projectiles are capable of eroding molecular solids while retaining the molecular specificity of mass spectrometry. When the beams are microfocused to a spot on the sample, bioimaging experiments in two and three dimensions are feasible. We describe emerging theoretical models that allow the energy-deposition process to be understood on an atomic and molecular basis. Moreover, experiments on model systems are described that allow protocols for imaging on biological materials to be implemented. Finally, we present recent applications of imaging to biological tissue and single cells to illustrate the future directions of this methodology.
Keywords: secondary ion mass spectrometry, bioimaging, molecular depth profiling, three-dimensional molecular imaging, C60, molecular dynamics
1. INTRODUCTION
Mass spectrometry–based methods are widely used to characterize complex molecular solids. The idea is to stimulate the desorption of material using some type of energetic input, such as an intense laser pulse, strong electric field, or energetic particle beam. Measurement of the mass of the desorbed elemental or molecular species can provide a selective and sensitive measure of the composition, with applications ranging from nanotechnology to biology. In this review, we focus on the utilization of cluster ion beams to initiate the desorption. These beams possess special qualities that allow new types of experiments in surface analysis, imaging, and molecular depth profiling. The energy-transfer processes that occur during cluster/solid interactions make this approach especially interesting for the study of biological tissue and single cells.
Ion-beam techniques are associated with secondary ion mass spectrometry (SIMS) and have been in widespread use for over 40 years (1). As the name implies, a primary ion beam of several thousand electron volts is directed at the target, initiating a cascade of moving particles, causing the desorption of secondary molecular ions. The two important features of this experimental arrangement are that molecular ions are desorbed from the top few nanometers of the sample, making it useful for surface analysis, and that the primary beam can be focused to a submicrometer probe size, allowing high–spatial resolution molecule-specific imaging (2). The imaging is performed by scanning this beam over an area and acquiring position-sensitive mass spectra on the fly. Fast acquisition is possible using pulsed ion beams followed by time-of-flight (TOF) mass analysis. Unfortunately, because the kinetic energy of the incident ion is many times greater than typical chemical bonds, complicated mass spectra consisting of many atomic and molecular fragment ions are observed. With molecular surfaces, the rapid accumulation of chemical damage changes the composition of surface layers. To preserve as much of the surface chemistry as possible, one must keep the fluence of primary ions low, greatly reducing sensitivity.
Another approach uses a tightly focused Cs+ ion beam at high fluence as the imaging probe, followed by a high-transmission magnetic sector analyzer. Although this probe causes a lot of chemical damage to the target, the Cs+ ions enhance the yield of negative ion fragments by orders of magnitude. This configuration, referred to as nanoSIMS, has revealed molecular information recently using stable isotope labeling to target specific molecules. Some of the highest-resolution images yet achieved have been reported with this device (3).
As it turns out, the biological community employs laser desorption methods, particularly matrix-assisted laser desorption ionization (MALDI), much more widely than TOF-SIMS. With MALDI, not only do the spectra consist primarily of molecular ions without fragments, but it is feasible to detect ions with a mass range extending to millions of daltons, opening the assay to peptides, proteins, and DNA (4). Imaging with MALDI is also an emerging field of research, particularly for mapping protein distributions in tissue sections in search of disease biomarkers (5). The lateral resolution of MALDI imaging, however, is typically restricted to ~100 μm, primarily because of sensitivity limitations (6).
Differences in the quality of MALDI and SIMS mass spectra are changing with the introduction of primary ion beam sources comprising molecular clusters rather than single atomic particles (7). These sources yield simplified SIMS spectra and exhibit an extended mass range for desorbed molecules. Appelhans & Delmore (8) first demonstrated the concept 20 years ago using SF6− as the projectile. They reasoned that the kinetic energy is distributed among seven atoms and that the larger geometrical size of this molecule compared with an atom would lead to more efficient energy deposition near the surface and would hence lead to more efficient sputtering. Since that time, a number of groups have reported improved SIMS results using Au3 (9, 10) and Bi3 clusters (11), glycerol clusters (12), C60+ (13), more massive Arx+ clusters with x > 500 (14), and even more massive H2O/methanol droplet clusters that can be utilized under atmospheric-pressure conditions (15). Although the advantages of these sources were generally appreciated, there was not much activity in developing applications, perhaps because of the lack of reliable instrumentation. This situation has changed within the past decade with the commercial introduction of Au and Bi liquid-metal ion sources and a C60+ source based upon electron-impact ionization technology that can be operated over long periods of time. The liquid-metal sources are interesting because the beams are produced with the highest current density and can be focused to a probe size as small as 50 nm, defining the lateral resolution limits. The C60+ source is interesting as it yields a larger cluster than the metal ion sources. The probe size is so far limited to ~300 nm, but the cluster/solid interaction yields remarkable energy-deposition mechanisms (16).
In this review, we delineate the unique properties of cluster SIMS that promise to expand its applications, particularly in the biological arena. The discussion begins with a description of theoretical models of the cluster impact event, concentrating specifically on the factors that produce higher molecular ion yields. We then discuss the implications of the observation that cluster bombardment leaves the surface relatively undamaged both topologically and chemically as compared to atomic bombardment. This property leads to an experimental modality termed molecular depth profiling, whereby the chemical composition of a multicomponent material may be characterized to a depth of several micrometers at a resolution of just a few nanometers. Recent applications of cluster SIMS to the imaging of lipids in tissue and single cells are provided to illustrate how these developments can lead to acquiring novel imaging information from biomaterials. Although there are many possible strategies for implementing cluster SIMS experiments, the focus of this review is on exploiting the special properties of the C60+ projectile.
2. SIMULATIONS AND MODELS
2.1. Molecular Dynamics
There are various approaches to elucidating the interaction of energetic particles with surfaces on the atomic level. Molecular dynamics (MD) computer simulations provide perhaps the most rigorous representation of the energy-transfer processes that occur subsequent to impact (17, 18). This type of calculation shows that cluster projectiles initiate a motion in the solid that is physically akin to a meteor hitting a surface (19). In contrast, atomic projectiles act more like a cue ball initiating a game of billiards, creating a collision-induced cascade of moving atoms. Figure 1 shows a snapshot of the final crater as determined by MD simulation for Au4 bombardment of Au (20). There is a characteristic crater with an associated rim above the surface. Moreover, the damage and/or mixing is limited to the hemispherical edge of the crater (21). Simulations have been performed for a variety of projectiles bombarding a variety of substrates, and there are differences in the motion depending on the specific combination of projectile and target. The vision picture of Figure 1, however, is the appropriate one for C60 bombardment of organic and biological targets, the main focus of this review.
Figure 1.
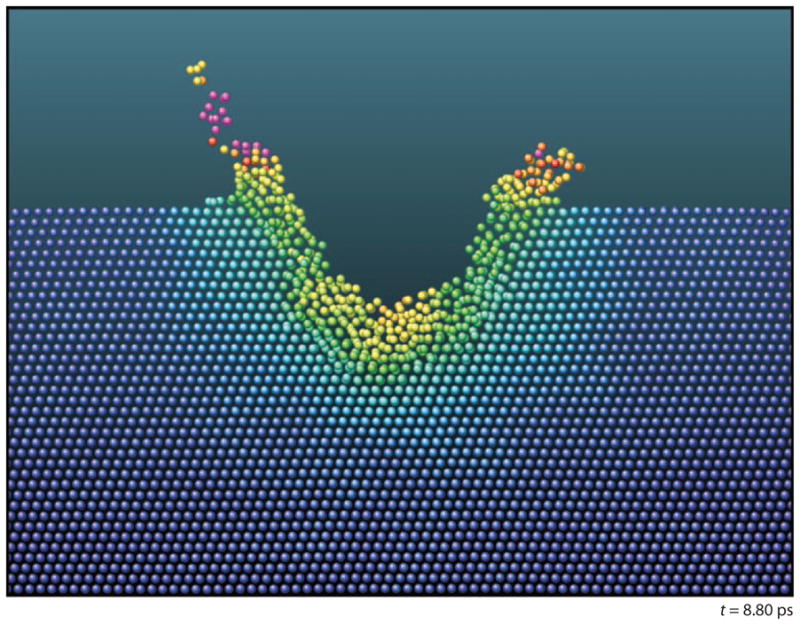
Cross section of an Au target 8.8 ps after Au4 bombardment at 16 keV. The color code represents temperature relative to the melting temperature of Au. Green is the melting temperature, and red is twice the melting temperature. Figure taken from Reference 20, used by permission from the American Physical Society.
The MD simulations involving atomic substrates such as metals are quite tractable because each impact requires tens of hours of computation using a typical laboratory computer. When modeling organic solids, however, the simulation quickly becomes intractable because there are more particles per unit volume, and the potentials required to model reactive chemistry are complex. In addition, the fast timescale of H-atom vibrations demands the use of a smaller time step than that for atomic solids. The time for one simulation becomes on the order of months rather than days. Consequently, simplifications in the simulations have been sought that eliminate time-consuming elements without sacrificing too much insight. Moreover, analytic models have been developed to aid in our understanding. The models, in fact, have contributed significantly to the basic understanding of the cluster-bombardment process and the contributions of various factors to the yield and depth profiles.
2.2. Coarse Graining
To achieve meaningful MD simulations from the cluster bombardment of molecular solids, it is essential to choose processes that most critically influence the overall dynamics, and processes that may be safely ignored. For a molecule such as benzene, the presence of the H atom is particularly problematic because its low mass requires most of the attention from the integration routines. To maintain the molecular structure and include bond fragmentation, yet omit the costly H-atom motion, the C-H group is considered as a single particle. With this representation, there can be CH-CH bond cleavage so we can obtain some level of understanding about how much fragmentation will occur. The coarse-graining (CG) method has been employed successfully in a number of situations where the molecular complexity demands this type of approximation (22, 23). To prove the efficacy of utilizing CG in this environment, researchers demonstrated that the trajectory of molecular solid benzene containing only (CH)6 and bombarded by 500-eV C60 projectiles does not change significantly when compared to full atomistic calculations. In addition, the calculations could be performed nearly 50 times faster (24). These CG potentials have also been successfully implemented in the simulation of C60 bombarded Langmuir-Blodgett overlayers on a metallic substrate (25). In this case, the dynamics of the C60+ bombardment are distinct from the vision picture shown in Figure 1.
2.3. Analytic Models
Even with the simplification of a CG solid, computer time is often impractically long, particularly given the increasing complexity of the samples that are amenable for study using cluster beams. To accommodate the need to understand how the energy deposition affects the ejection yield, investigators utilized concepts from fluid dynamics (26) to develop a mesoscale energy-deposition footprint model (27, 28). This model utilizes short time MD trajectory data to provide information about yields and sample damage that normally would require much longer timescales and much larger systems. The key quantities are the radius of the cylinder Rcyl where the energy is deposited and the amount of energy relative to the binding energy deposited in this cylinder down to a depth of Rcyl. This model has been calibrated by comparing it to full MD simulations and to experimental data and has been used extensively to gain a better understanding of the effects of incident kinetic energy and the angle of incidence. The emergence of this type of formalism now allows yields to be estimated for systems that would not be feasible for MD simulations alone.
The erosion of molecular solids by cluster ion beams leads to molecular depth profiling and three-dimensional (3D) imaging experiments. This type of study is extraordinarily difficult to model by MD simulations because the erosion is a consequence of multiple impacts at the same spot on the surface. Although it is feasible to examine the influence of a surface crater on the behavior of a second impact near that crater, erosion-type calculations are clearly computationally challenging. There is a simple analytic model, however, that can help to parameterize the important properties of a depth profile such as erosion rate, depth resolution, and chemical damage buildup rate (29, 30). Briefly, the important numbers are the total yield Ytot and the damage volume ndσD, where n is the molecular density, d is an altered layer thickness, and σD is the damage cross section. These quantities are extracted from experimental depth profiles using a procedure described in the next section. The best depth profiles are achieved when Ytot ≫ ndσD; that is, when the removal rate exceeds the damaged volume. Implementation of this model has become an integral part of the depth-profiling experiments, as discussed below.
2.4. Projectile Kinetic Energy and Angle of Incidence
The first trend of relevance is how the yield of ejected material depends on the incident energy, projectile size, and mass of individual atoms in the projectile versus the mass of individual atoms in the substrate. Urbassek and colleagues (31, 32) have performed a thorough investigation with MD simulations for Ar clusters bombarding an Ar solid. They found that sputtering yield per particle in the projectile versus the kinetic energy per particle (i.e., velocity) is linear above a threshold velocity. The largest yield occurs when the mass of the projectile atoms is equal to the mass of the substrate atoms. Similar trends have been found by Ryan & Garrison (33) for combined MD simulations at low energies and mesoscale energy-deposition footprint calculations at higher incident energies for carbon clusters bombarding a CG benzene substrate. Their calculations clearly show that the experimentally easiest way to increase the yield is to increase the incident energy rather than the cluster size. Moreover, the C atoms in C60 are a perfect mass match for organic and biological systems (34).
To investigate the effects of the angle of incidence on the quality of the yield and the quality of the depth profile, researchers studied the 40-keV C60+ bombardment of an ~300-nm cholesterol thin film (35). They varied the incident angle of the projectile from near normal (5°) to glancing (73°). The total sputtering yield, Ytot, is shown in Figure 2a. As described by the accompanying simulations, the yield increases as the incident angle increases from near normal until approximately 45° because the incident energy is more effectively deposited in the region of the surface giving rise to ejection (36). As the incident angle becomes glancing, however, some of the incident energy is reflected and the yield decreases. The experimental data were used to extract the values of σd and d for the erosion model, as shown in Figure 2b,c. The damaged cross section tracks the yield, but the damaged depth decreases as the incident angle becomes more grazing. A so-called clean-up efficiency,
Figure 2.

Summary of the erosion model parameters (a) Ytot, (b) σD, (c) d, and (d) ε as a function of 40-keV C60+ incident angle. Figure adapted from Reference 35, used by permission from the American Chemical Society.
was introduced as the efficiency for cleaning up the chemical damage produced in an impact event due to the removal of the debris in the course of the same event. The resulting clean-up efficiency calculated for each incident angle is shown in Figure 2d. The values indicate that the sputter yield relative to the number of damaged molecules per impact is at least under 40° incidence and that this efficiency increases slightly toward normal incidence and substantially toward glancing incidence. Most importantly, the data clearly indicate that glancing incident geometries are most effective for maintaining chemical information during molecular depth profiling using 40-keV C60+. Moreover, the values indicate that the success of the experiment is not necessarily improved by a larger sputter yield or smaller damaged cross section but that it critically depends on the interplay between these quantities and the altered layer thickness. As for a general trend, high-quality molecular depth profiling seems to track with a smaller altered layer thickness.
2.5. Surface Sensitivity
An important parameter is the relative surface sensitivity of various projectiles, including Au+, Au2+, Au3+, and C60+. To examine this issue, investigators deposited a series of thin films of water-ice onto an Ag substrate held at cryogenic temperatures (37). The thickness of the films was determined by quartz crystal microbalance. The resulting mass spectra of these samples allowed the determination of the probability that Ag ions will desorb through the overlayer. This system is amenable to MD simulations, and it is a nice example of how experiment and theory can be highly complementary. Figure 3 shows the results of the MD simulations of a 2.5-nm film of ice on Ag bombarded by two different projectiles. A crater forms in both cases, and the water yields are of the same magnitude. The Au3 projectile, however, creates many subsurface atomic displacements. These displacements are the source of the residual chemical damage in a molecular solid. The C60 bombardment, however, produces almost no subsurface damage, leaving the underlying chemistry intact. Additional quartz-crystal-microbalance measurements, made to determine the number of water molecules removed per incident particle, support the conclusions of the computer simulations. The experimental results show that the effective depth of origin of Ag atoms through the water film is 2.4, 2.0, 1.8, and 0.74 nm for Au+, Au2+, Au3+, and C60+ bombardment, respectively. The data suggest that the surface sensitivity resulting from C60 bombardment is the highest of the tested group. The simulations clearly show that no ejected Ag particles are ejecting through the water film. Rather, the film is swept away so that Ag particles can eject through the newly created space.
Figure 3.

Snapshots of the atom positions for Au3 and C60 bombardment of a 2.5-nm film of ice (red) on Ag (blue). The incident particle impinges from the left with 15 keV at an angle of 40° with respect to the surface normal. The time snapshots are at 1, 3, and 5 ps for the frames from top to bottom, respectively. Figure adapted from Reference 37, used by permission from the American Physical Society.
3. DEPTH PROFILING AND IMAGING IN MODEL SYSTEMS
Aside from the generally improved nature of the mass spectra resulting from cluster bombardment, the most intriguing manifestation of the cluster/solid interaction is that the amount of residual chemical damage remaining after an impact event is significantly lower than that found for atomic bombardment. Gillen and colleagues (38, 39) first observed this effect by generating a series of carbon-cluster negative-ion beams consisting of 2 to 10 carbon atoms to interrogate a thin film of glutamate vapor deposited onto an Si substrate. The results of their experiment are shown in Figure 4, where the intensity of the [M-H]− molecular secondary ion signal is plotted as a function of the incident ion beam fluence, or erosion time. The C2− projectile exhibits a simple exponential decay of the molecule-specific signal to essentially zero. In contrast, the same ion signal recorded under C6− and C8− irradiation exhibits a small drop in signal near zero time, but rapidly reaches a steady-state value until the film is completely removed. Moreover, the drop in signal is smaller for C8− than for C6−, and the film is removed at a faster rate as it is observed to be removed sooner. The carbon-cluster/glutamate system is one of the first examples of a molecular depth profile. It also serves to show that bigger carbon clusters are more effective than smaller ones, although the effect reaches a point of saturation at approximately 20 carbon atoms.
Figure 4.

Molecular ion signal (M-H)− at m/z 146 representing a glutamate film on Si as a function of sputtering time using 3-keV Cn− projectile ions. Figure adapted from Reference 38, used by permission from the American Vacuum Society.
The development of a fullerene ion source by Vickerman and coworkers (40) allowed Gillen’s initial observations to be exploited in much greater detail because the C60+ beam is quite stable, has a 500-h lifetime before cleaning is required, and is bright enough to be focused to a submicrometer spot for imaging purposes. This group studied a range of biomolecules, polymers, and organic thin films and reported that σd was extraordinarily low. Other examples on more complex film constructs have been reported more recently, and four examples are shown in Figure 5. The first example is a spin cast amorphous 300-nm film of a sugar, trehalose, doped with a 1% concentration of a small tetrapeptide, GGYR (41). Both the sugar and the peptide exhibit the classic molecular depth-profiling behavior—an initial exponential decrease into a well-developed steady state, followed by a relatively sharp decay as the film-substrate interface is reached. The next example shows a thermally evaporated 300-nm film of cholesterol on Si (35), and the third case shows a multilayer stack of alternating 50-nm lipid films prepared by the Langmuir-Blodgett technique (42, 43). This last case is interesting because the abrupt interface between the organic layers provides a convenient standard by which to determine the depth resolution of these types of experiments, a parameter we discuss in more detail shortly. The last example is a sequence of Irganox 3114 monolayers embedded into an Irganox 1010 matrix, illustrating the possibility of detecting a single buried molecular layer (44, 45).
Figure 5.

Molecular depth profile of (a) a 300-nm trehalose film doped with GGYR peptide, (b) a 300-nm cholesterol film, (c) a multilayer stack of alternating Langmuir-Blodgett films of approximately 50-nm width, and (d) a sequence of Irganox 3114 delta layers embedded into an Irganox 1010 matrix on Si measured using C60+ projectile ions for sputter erosion and data acquisition.
3.1. Erosion Dynamics and Important Parameters
Full exploitation of the information inherent in these molecular depth profiles requires a number of specific experimental protocols to be followed rather rigorously. The first one involves determination of the depth scale of the measurement. How do we convert the known incident ion fluence, the total number of incident fullerene molecules per unit area, into a known amount of removed material? In general, the measurements are performed by erosion of material over an area of ~100 μm2 using a continuous incident ion beam to create a square, flat-bottomed crater. Analysis is achieved with a pulsed beam for TOF detection using only the center of the crater bottom to avoid crater edge effects. Conversion of the applied projectile ion fluence into eroded depth is usually accomplished by inspection of the eroded crater using a stylus profilometer, an atomic force microscope (AFM), or an optical interferometer before and after completion of the depth-profile analysis (46). Depending on the nature of the sample, the resulting depth-scale calibration may be nonlinear because different layers of the sample may exhibit different erosion rates (47). This effect is particularly important for the study of hybrid materials such as organic films formed on inorganic substrates like Si or Ag because the erosion rate may change by more than an order of magnitude upon transition through the interface. The value of Ytot is generally determined by measuring the volume of the crater produced during the erosion, and converting this volume into the number of molecule equivalents removed per incident projectile. And finally, the values of σd and d are determined from the exponential decay of the molecular ion signal during the initial phases of the depth profile (29). The depth resolution is typically determined from the broadening observed at abrupt interfaces, and is usually limited by the appearance of topography and interlayer mixing induced by the ion beam itself. Hence, the erosion dynamics model discussed above provides a powerful framework for acquiring quantitative information about the quality of the depth profile through the resulting Ytot, σd, and d parameters.
3.2. Three-Dimensional Imaging
The combination of molecular depth profiling and molecule-specific imaging opens some interesting possibilities. To acquire an image by SIMS, as hinted at earlier, one records an entire mass spectrum at a known x,y coordinate. With the use of TOF detection, the ion beam is typically pulsed with a repetition rate of up to 10 kHz. For an image containing 256 × 256 pixels, there are 65,536 individual mass spectra requiring a data-acquisition time of at least 6.5 s. Now let us consider a scenario in which the surface is eroded by a continuous C60+ ion beam to remove several nanometers of material. The image can be recorded again, although this time, the information will be representative of what the material looked like 10 nm below the original surface. This procedure can be repeated hundreds of times to create hundreds of images representing different depths. The depth resolution, as estimated from the erosion dynamics model and shown in Figure 2, is typically in the range of 10–20 nm. To create a 3D rendering of an object, one can stack these images on top of each other using color to identify characteristic masses in the SIMS spectra. As there could easily be more than 107 individual spectra in this data cube, hot current research topics include data storage, compression, and visualization (48, 49).
Image stacking only works when the depth scale is the same for each pixel in a given plane. If there is a differential erosion rate due to heterogeneity in the material, the depth scale associated with each pixel will eventually deviate from the expected value, and the stacked images will not provide an accurate 3D representation (50). In effect, a fully characterized depth profile is needed for each pixel in the image. Ideally, it would be useful to have some sort of independent optical measurement of the shape of the bottom of the crater during depth profiling. Until this type of measurement is possible, AFM has provided a stop-gap approach to correcting these types of effects. Using the sugar/protein film discussed above, researchers wrote an arbitrary pattern into the film using a Ga+ ion beam. The deposition of Ga generates significant heterogeneity, but the different erosion rates could be spotted by AFM and then corrected (50). Figure 6 shows an example of how this correction affects the appearance of a 3D image.
Figure 6.

3D depth profiling of a peptide-doped 300-nm thin film of trehalose on Si, patterned using a Ga+ ion probe. (Left panel) Atomic force microscopy (AFM) picture of the patterned letters whose troughs are 9.6 μm in width and 220 nm in depth. (Middle panel) A 3D secondary ion mass spectrometry (SIMS) image acquired by directly stacking 100 2D images acquired during erosion with C60. The Ga signal at m/z 69 is red, the peptide signal at m/z 452 is blue, and the Si signal at m/z is green. The information becomes intertwined as the film is removed. (Right panel) The same data with the depth scale corrected using information obtained largely from the AFM measurements. The depth resolution in this case approaches 3 nm. Figure taken from Reference 50, used by permission from the American Chemical Society.
4. DEPTH PROFILING AND IMAGING IN BIOLOGICAL SYSTEMS
4.1. Extending the Mass Range
The dynamics of cluster/solid interactions suggest a number of different modalities for imaging of biological cells and tissue using microfocused cluster probes, and a number of groups are beginning to scope out the applications. Before the advent of cluster sources, mass-spectrometry imaging experiments mainly involved monitoring elemental species such as Na, K, Ca, and O or fragments of a selected set of biomolecules that exhibit a particularly strong ionization probability, such as CN− at m/z 28 (51) and the phosphatidyl head group at m/z 184 (52) derived from the important membrane lipid phosphatidylcholine (PC). The sensitivity to most target molecules is simply too low to acquire a signal from a pixel of less than 1 μm2. In addition, there is a great deal of excitement about the prospects for molecular depth profiling and 3D imaging.
An important expansion of the types of molecules amenable for study has recently been reported using the Bi3+ projectile for imaging (53, 54). The goal of the study was to elucidate the lipid distribution in human liver tissue associated with nonalcoholic fatty liver disease. The experiments involved preparing a 10-μm tissue slice from human liver using a cryostat for sectioning. The slices were placed on an Si wafer and dried under a modest 1-mbar vacuum for 30 min. No dyes, matrices, or other tags are required for the sample preparation. The mass spectrometry of the tissue showed a rich diversity of chemistry between m/z 300 and m/z 1200 with mono- and di-acylglycerols, cholesterol, vitamin E, PCs, and other fatty acids all observed with adequate intensity for imaging. Several representative images are shown in Figure 7 that reveal steatotic vesicles, the regions of diseased livers that exhibit abnormal cellular lipid retention. Although the clinical significance associated with these images is not known, variations in lipid distributions could be observed in different domains of the tissue and between healthy and diseased specimens. The high spatial resolution of 1–2 μm is essential to resolve individual vesicles, and would be impossible using atomic ion beams or imaging MALDI.
Figure 7.
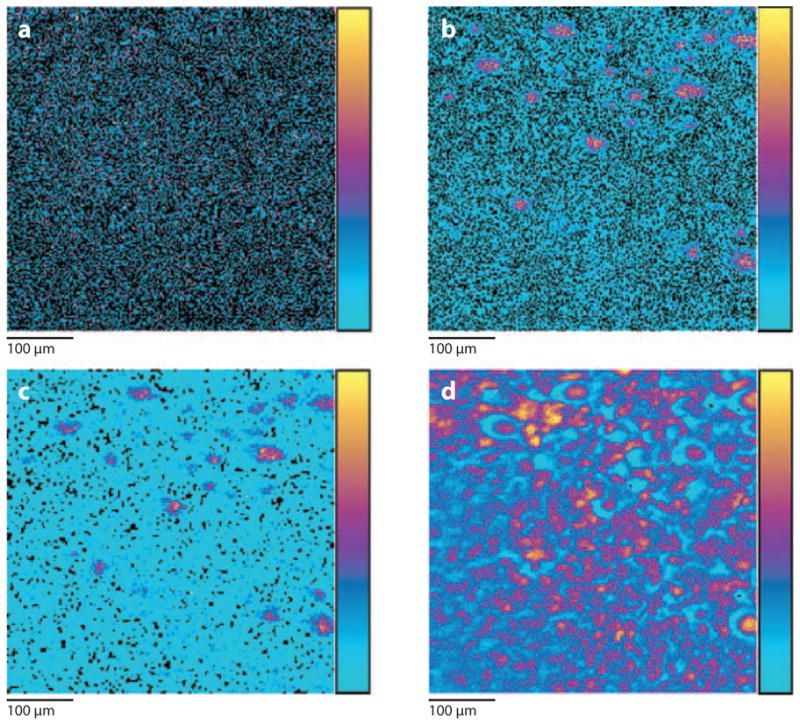
Secondary ion mass spectrometry (SIMS) images of steatotic vesicles within a liver tissue slice. (a) Vitamin E signal at m/z 429. (b) The cholesterol signal at m/z 369. (c) The sum of all the triacylglycerides near m/z 862. (d) The sum of C16 fatty acid carboxylate ions. The relative signal intensity is represented by the color bar to the right of the images, with yellow representing the most intense and cyan blue representing the least intense. Figure adapted from Reference 53, used by permission from the American Chemical Society.
4.2. Depth Profiling
A second class of imaging experiments utilizes the cluster source to obtain molecular information not only about the surface of the sample but also from the subsurface region. Can we begin to apply the principles of molecular depth profiling discussed above to the characterization of much more complex materials? A simple example is associated with sample preparation protocols for single-cell studies. To retain cellular structure and chemistry at submicrometer levels, rapid freezing of the living cells in a fully hydrated state, followed by freeze-fracture to expose the cells, is generally believed to provide the highest level of preservation, consistent with the vacuum environment of the mass spectrometer. A problem with this strategy has been the condensation of water-ice back onto the cell surface after the fracture, but prior to the imaging. Now, however, it is feasible to remove this layer of adventitious water using the C60+ probe to reveal the underlying chemistry (55). An example of this strategy, referred to as a nanotome procedure, is illustrated in Figure 8. A patterned thin film of cholesterol was synthesized by vapor deposition onto Si masked with a grid. After the grid is removed, the sample is frozen in the laboratory and introduced into the vacuum of the SIMS instrument. Initially, only water is observed on the sample, but after a small amount of C60+ erosion, the original chemistry is restored. These workers utilized this approach to monitor the lipid distribution in the membrane of mating cell pairs. A related set of experiments investigated the distribution of two antibiotics (m/z 483 and m/z 392) in a mycelial bacterium. Both antibiotics were observed to be present on the cell surface, but after erosion with C60+, only one of the antibiotics could be observed below the membrane surface.
Figure 8.

Secondary ion mass spectrometry (SIMS) images of (a) a patterned cholesterol film on Si created using physical vapor deposition, (b) film cooled in vacuum (−196°C) with H2O redeposition, and (c) after etching with a dose of 1013 C60+ ions cm−2. The m/z 369 signal is shown in green (cholesterol), the m/z 18 signal in blue (H2O), and the m/z 28 signal in red (Si). (d) Line scans across the film features reveal that the distribution of cholesterol on the surface is maintained when C60+ is used to remove the water overlayer versus when the surface is not cleaned with the C60+ nanotome. Figure adapted from Reference 55, used by permission from the American Society of Mass Spectrometry.
4.3. Three-Dimensional Imaging
There have been a few initial attempts at 3D imaging, even though there is not a good way of providing an accurate depth scale for heterogeneous materials like single biological cells. Two different strategies have been reported. In the first instance, a carcinoma cell was prepared by freeze-fracture/freeze-drying (56). The integrity of the cell was verified using confocal fluorescent microscopy, which showed a nucleus of 15–18 μm and a total cell diameter of 55–65 μm. To acquire mass spectral images, investigators etched the sample with a C60+ probe with enough fluence to remove ~10 nm of material. The resulting surface was then imaged using a pulsed Bi3+ probe for spectral acquisition. The Bi cluster was employed because higher lateral resolution could be obtained with this source than with the C60+ source. This cycle was repeated 138 times, creating 138 images that could be stacked for 3D visualization. The result is shown in Figure 9, using an isosurface rendering. With the Bi3+ probe, only lower mass ions of Na, K, and two different PC head-group fragments could be monitored. Compartmentalization of K+ is seen as expected, although the different localization of the different PC fragments is somewhat of a mystery. The authors speculate that different cellular environments may induce different fragmentation pathways for the same parent molecule. In any case, the experimental result clearly shows that 3D imaging is feasible, although we are still not certain that stacking the image preserves the relative lateral information in any given image plane.
Figure 9.
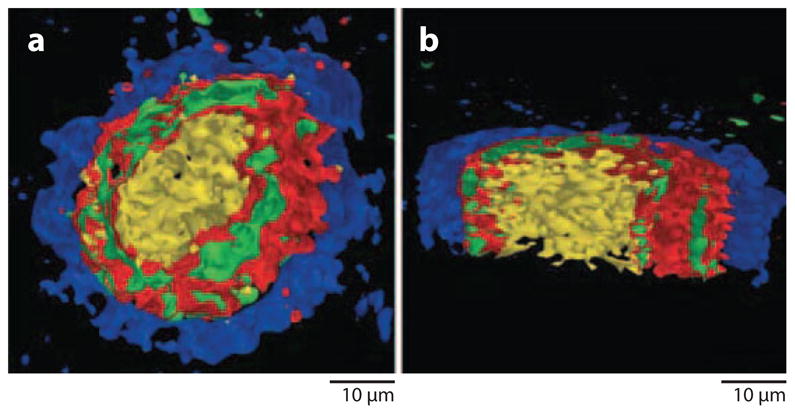
Isosurface rendering of thyroid tumor cells acquired using a Bi3+ source for spectral acquisition and a C60+ source for erosion. The m/z 23 signal is shown in blue (Na), the m/z 39 signal in green (K), the m/z 184 signal in red (phosphocholine head group), and the m/z 86 signal in yellow (phosphocholine head-group fragment). (a) A single cell with a forward image tilt of 45°. (b) A cell cross section with a forward image tilt of 15°. Figure taken from Reference 56, used by permission from Wiley Interscience.
Finally, the Vickerman group (57) has been the first to report a 3D image of a single cell acquired entirely using a C60+ probe. They used a freeze-dried oocyte as their model cell and were able to detect mass spectral signals up to m/z 960. The images were stacked and displayed with a center region removed to visualize the inside of the cell. The image resolution was approximately 5 μm for these experiments. An example of the cholesterol distribution (m/z 369) is shown in Figure 10. The depth scale is estimated by optically observing the size of the crater created during the experiment. The bottom of the crater appeared to be relatively flat, so differential erosion rates were determined not to be creating artifacts in the image stack.
Figure 10.

3D images of freeze-dried oocyte, showing changes in (a) signal summed over the m/z range 815–960, representing mainly membrane lipid distributions, and (b) the cholesterol peak at m/z 369. Color scale is normalized for total counts per pixel for each variable (m/z range). The imaged species are localized differently, not only along the lateral dimensions, but also along the depth. Figure adapted from Reference 57, used by permission from the American Chemical Society.
5. FUTURE OUTLOOK
The emergence of cluster ion beams has allowed mass spectrometry to be utilized for high-resolution molecule-specific imaging experiments in both two and three dimensions. More specifically, the energy-deposition properties of the cluster ion sources, particularly C60+, are shown to yield greatly improved mass spectra when compared to atomic projectiles. These characteristics open the possibility of acquiring molecular information directly from biological tissue and cells.
Much of the research to date has been involved either with model systems, to determine the best conditions for imaging, or with the direct imaging of tissue and cells. There is still a significant need for sensitivity at high lateral resolution because there are simply a limited number of molecules in each pixel available for analysis. New methods of improving ionization and hence detection efficiency are constantly under development by the community and will be needed to further advance the technique. Theoretical approaches to better understand molecular depth profiling are in the works (58). New experimental approaches to determine the depth scale for 3D imaging will clearly be required in the future. In general, the experiments to date point to a method with unique characteristics, but one that will require still more refinements before it can be accepted by the broader biological community.
SUMMARY POINTS
There is new physics associated with cluster SIMS that is leading to new applications in bioimaging.
The details of the energy-deposition process can be visualized at an atomic and molecular level using MD computer simulations.
Analytical models are emerging that describe mesoscale phenomena such as molecular depth profiling.
Cluster ion beams, especially C60+, can erode molecular films with a few-nanometers depth resolution while maintaining molecular specificity.
3D imaging is possible by stacking 2D images acquired during depth profiling.
Refined 3D images on model systems require an independent means of obtaining the depth scale.
Applications are emerging that demonstrate the 3D imaging of biological cells.
Acknowledgments
This work was supported by the National Science Foundation under grant nos. CHE-0908226 and CHE-0910564, the National Institutes of Health under grant no. EB-002016–16, and the Department of Energy under grant no. DE-FG02–06ER15803. The authors also are grateful to the many collaborators and students who have been part of the development of the concepts presented here.
- Intense laser pulse
matrix-assisted laser desorption ionization (MALDI) uses an intense laser pulse to ablate intact biomolecules from a solid substrate
- Strong electric field
electrospray mass spectrometry utilizes a strong electric field to vaporize charged droplets for mass analysis
- SIMS
secondary ion mass spectrometry
- Time of flight (TOF)
measuring the flight time of a charged particle of known speed for a fixed distance to determine the mass
- MALDI
matrix-assisted laser desorption ionization
- Liquid-metal ion sources
a field emitter tip of atomic dimensions that allows emission of metal ions in a focused beam
- Molecular dynamics (MD)
treating each atom as a classical particle and integrating Newton’s equations of motion to determine the trajectory
- CG
coarse graining
- Quartz crystal microbalance
a mass-measuring device that is sensitive to nanograms of material
- Langmuir-Blodgett technique
method to construct ordered stacked monolayers of known dimensions of amphiphillic molecules
- Individual spectra
each spectrum could contain 106 bytes of information leading to 1013 bytes overall
- PC
phosphatidylcholine
- Oocyte
an unusually large egg cell, well suited for SIMS imaging
Footnotes
DISCLOSURE STATEMENT
The authors are not aware of any affiliations, memberships, funding, or financial holdings that might be perceived as affecting the objectivity of this review.
Contributor Information
Nicholas Winograd, Email: nxw@psu.edu.
Barbara J. Garrison, Email: bjg@psu.edu.
LITERATURE CITED
- 1.Benninghoven A. Surface investigation of solids by statical method of secondary ion mass spectroscopy (SIMS) Surf Sci. 1973;35:427–57. [Google Scholar]
- 2.Benninghoven A. Surface analysis by secondary-ion mass spectrometry (SIMS) Surf Sci. 1994;299:246–60. [Google Scholar]
- 3.Lechene CP, Luyhen Y, McMahon G, Distel DL. Quantitative imaging of nitrogen fixation by individual bacteria within animal cells. Science. 2007;317:1563–66. doi: 10.1126/science.1145557. [DOI] [PubMed] [Google Scholar]
- 4.Karas M, Hillenkamp F. Laser desorption ionization of proteins with molecular masses exceeding 10000 daltons. Anal Chem. 1988;60:2299–301. doi: 10.1021/ac00171a028. [DOI] [PubMed] [Google Scholar]
- 5.Stoeckli M, Chaurand P, Hallahan DE, Caprioli RM. Imaging mass spectrometry: a new technology for the analysis of protein expression in mammalian tissues. Nat Med. 2001;7:493–96. doi: 10.1038/86573. [DOI] [PubMed] [Google Scholar]
- 6.McDonnell LA, Heeren RMA. Imaging mass spectrometry. Mass Spectrom Rev. 2007;26:606–43. doi: 10.1002/mas.20124. Surveys imaging mass spectrometry and compares the various modalities. [DOI] [PubMed] [Google Scholar]
- 7.Winograd N. The magic of cluster SIMS. Anal Chem. 2005;77:A142–49. Presents an overview of the new physics associated with cluster SIMS. [Google Scholar]
- 8.Appelhans AD, Delmore JE. Comparison of polyatomic and atomic primary beams for secondary ion mass spectrometry of organics. Anal Chem. 1989;61:1087–93. [Google Scholar]
- 9.Walker AV, Winograd N. Prospects for imaging with TOF-SIMS using gold liquid metal ion sources. Appl Surf Sci. 2003;203:198–200. [Google Scholar]
- 10.Davies N, Weibel DE, Blenkinsopp P, Lockyer N, Hill R, Vickerman JC. Development and experimental application of a gold liquid metal ion source. Appl Surf Sci. 2003;203:223–27. [Google Scholar]
- 11.Touboul D, Kollmer F, Niehuis E, Brunelle A, Laprevote O. Improvement of biological time-of-flight secondary ion mass spectrometry imaging with a bismuth cluster ion source. J Am Soc Mass Spectrom. 2005;16:1608–18. doi: 10.1016/j.jasms.2005.06.005. [DOI] [PubMed] [Google Scholar]
- 12.McMahon JM, Dookeran NN, Todd PJ. Organic ion imaging beyond the limit of static secondary ion mass spectrometry. J Am Soc Mass Spectrom. 1995;6:1047–58. doi: 10.1016/1044-0305(95)00526-9. [DOI] [PubMed] [Google Scholar]
- 13.Weibel D, Wong S, Lockyer N, Blenkinsopp P, Hill R, Vickerman JC. A C60 primary ion beam system for time of flight secondary ion mass spectrometry: its development and secondary ion yield characteristics. Anal Chem. 2003;75:1754–64. doi: 10.1021/ac026338o. First paper to show first practical use of the C60 source. [DOI] [PubMed] [Google Scholar]
- 14.Ninomiya S, Ichiki K, Yamada H, Nakata Y, Seki T, et al. Precise and fast secondary ion mass spectrometry depth profiling of polymer materials with large Ar cluster ion beams. Rapid Commun Mass Spectrom. 2009;23:1601–6. doi: 10.1002/rcm.4046. [DOI] [PubMed] [Google Scholar]
- 15.Takats Z, Wiseman JM, Gologan B, Cooks RG. Mass spectrometry sampling under ambient conditions with desorption electrospray ionization. Science. 2004;306:471–73. doi: 10.1126/science.1104404. First use of large droplets for under atmospheric conditions. [DOI] [PubMed] [Google Scholar]
- 16.Fletcher JS, Conlan XA, Jones EA, Biddulph G, Lockyer NP, Vickerman JC. TOF-SIMS analysis using C60 effect of impact energy on yield and damage. Anal Chem. 2006;78:1827–31. doi: 10.1021/ac051624w. [DOI] [PubMed] [Google Scholar]
- 17.Garrison BJ, Winograd N, Harrison DE. Atomic and molecular ejection from ion-bombarded reacted single-crystal surfaces: oxygen on copper-(100) Phys Rev B. 1978;18:6000–10. [Google Scholar]
- 18.Garrison BJ, Postawa Z. Computational view of surface based organic mass spectrometry. Mass Spectrom Rev. 2008;27:289–315. doi: 10.1002/mas.20165. From a MD point of view, compares cluster SIMS, atomic SIMS, and MALDI, with eight animations included. [DOI] [PubMed] [Google Scholar]
- 19.Postawa Z, Czerwinski B, Szewczyk M, Smiley EJ, Winograd N, Garrison BJ. Enhancement of sputtering yields due to C60 versus Ga bombardment of Ag{111} as explored by molecular dynamics simulations. Anal Chem. 2003;75:4402–7. doi: 10.1021/ac034387a. [DOI] [PubMed] [Google Scholar]
- 20.Colla TJ, Aderjan R, Kissel R, Urbassek HM. Sputtering of Au (111) induced by 16-keV Au cluster bombardment: spikes, craters, late emission and fluctuations. Phys Rev B. 2000;62:8487–93. [Google Scholar]
- 21.Postawa Z, Czerwinski B, Szewczyk M, Smiley EJ, Winograd N, Garrison BJ. Microscopic insights into the sputtering of Ag{111} induced by C60 and Ga bombardment. J Phys Chem B. 2004;108:7831–38. doi: 10.1021/jp050821w. [DOI] [PubMed] [Google Scholar]
- 22.Hautman J, Klein ML. Simulation of a monolayer of alkyl thiol chains. J Chem Phys. 1989;91:4994–5001. [Google Scholar]
- 23.Marrink SJ, Mark AE. Coarse grained simulation of phase transitions of lipid membranes. Biophys J. 2005;88:384A. [Google Scholar]
- 24.Smiley EJ, Postawa Z, Wojciechowski IA, Winograd N, Garrison BJ. Coarse-grained molecular dynamics studies of cluster-bombarded benzene crystals. Appl Surf Sci. 2006;252:6436–39. [Google Scholar]
- 25.Paruch R, Rzeznik L, Czerwinski B, Garrison BJ, Winograd N, Postawa Z. Molecular dynamics simulations of sputtering of Langmuir-Blodgett multilayers by kiloelectronvolt C-60 projectiles. J Phys Chem C. 2009;113:5641–48. doi: 10.1021/jp809769q. [DOI] [PMC free article] [PubMed] [Google Scholar]
- 26.Jakas MM, Bringa EM, Johnson RE. Fluid dynamics calculation of sputtering from a cylindrical thermal spike. Phys Rev B. 2002;65:165425. [Google Scholar]
- 27.Russo MF, Garrison BJ. Mesoscale energy deposition footprint model for kiloelectronvolt cluster bombardment of solids. Anal Chem. 2006;78:7206–10. doi: 10.1021/ac061180j. [DOI] [PubMed] [Google Scholar]
- 28.Russo MF, Szakal C, Kozole J, Winograd N, Garrison BJ. Sputtering yields for C60 and Au3 bombardment of water ice as a function of incident kinetic energy. Anal Chem. 2007;79:4493–98. doi: 10.1021/ac070105l. [DOI] [PMC free article] [PubMed] [Google Scholar]
- 29.Cheng J, Wucher A, Winograd N. Molecular depth profiling with cluster ion beams. J Phys Chem B. 2006;110:8329–36. doi: 10.1021/jp0573341. [DOI] [PubMed] [Google Scholar]
- 30.Wucher A. A simple erosion dynamics model of molecular sputter depth profiling. Surf Interface Anal. 2008;40:1545–51. [Google Scholar]
- 31.Anders C, Urbassek HM. Effect of binding energy and mass in cluster-induced sputtering of van-der-Waals bonded systems. Nucl Instrum Methods Phys Res B. 2005;228:84–91. [Google Scholar]
- 32.Anders C, Urbassek HM, Johnson RE. Linearity and additivity in cluster-induced sputtering: a molecular-dynamics study of van der Waals bonded systems. Phys Rev B. 2004;70:155404. [Google Scholar]
- 33.Ryan KE, Garrison BJ. Cluster size dependence and yield linearity in cluster bombardment simulations of benzene. Anal Chem. 2008;80:6666–70. doi: 10.1021/ac800995w. [DOI] [PubMed] [Google Scholar]
- 34.Smiley EJ, Winograd N, Garrison BJ. Effect of cluster size in kiloelectronvolt cluster bombardment of solid benzene. Anal Chem. 2007;79:494. doi: 10.1021/ac061531u. [DOI] [PubMed] [Google Scholar]
- 35.Kozole J, Wucher A, Winograd N. Energy deposition during molecular depth profiling experiments with cluster ion beams. Anal Chem. 2008;80:5293–301. doi: 10.1021/ac8002962. [DOI] [PMC free article] [PubMed] [Google Scholar]
- 36.Ryan KE, Garrison BJ. Energy deposition control during cluster bombardment: a molecular dynamics view. Anal Chem. 2008;80:5302–6. doi: 10.1021/ac800287k. [DOI] [PubMed] [Google Scholar]
- 37.Szakal C, Kozole J, Russo MF, Garrison BJ, Winograd N. Surface sensitivity in cluster-ion-induced sputtering. Phys Rev Lett. 2006;96:216104. doi: 10.1103/PhysRevLett.96.216104. [DOI] [PubMed] [Google Scholar]
- 38.Gillen G, King L, Freibaum B, Lareau R, Bennett J, Chmara F. Negative cesium sputter ion source for generating cluster primary ion beams for secondary ion mass spectrometry analysis. J Vac Sci Technol A. 2001;19:568–75. Presents first example of a depth profile of a molecular thin film. [Google Scholar]
- 39.Gillen G. Private communication. 2009.
- 40.Weibel DE, Lockyer N, Vickerman JC. C60 cluster ion bombardment of organic surfaces. Appl Surf Sci. 2004;231–32:146–52. [Google Scholar]
- 41.Cheng J, Winograd N. Depth profiling of peptide films with TOF-SIMS and a C60 probe. Anal Chem. 2005;77:3651–59. doi: 10.1021/ac048131w. [DOI] [PubMed] [Google Scholar]
- 42.Zheng LL, Wucher A, Winograd N. Chemically alternating Langmuir-Blodgett thin films as a model for molecular depth profiling by mass spectrometry. J Am Soc Mass Spectrom. 2008;19:96–102. doi: 10.1016/j.jasms.2007.10.020. [DOI] [PMC free article] [PubMed] [Google Scholar]
- 43.Zheng LL, Wucher A, Winograd N. Depth resolution during C60+ profiling of multilayer molecular films. Anal Chem. 2008;80:7363–71. doi: 10.1021/ac801056f. [DOI] [PMC free article] [PubMed] [Google Scholar]
- 44.Shard AG, Brewer PJ, Green FM, Gilmore IS. Measurement of sputtering yields and damage in C60-SIMS depth profiling of model organic materials. Surf Interface Anal. 2007;39:294–98. [Google Scholar]
- 45.Shard AG, Green FM, Brewer PJ, Seah MP, Gilmore IS. Quantitative molecular depth profiling of organic delta-layers by C60 ion sputtering and SIMS. J Phys Chem B. 2008;112:2596–605. doi: 10.1021/jp077325n. [DOI] [PubMed] [Google Scholar]
- 46.Wucher A, Cheng J, Zheng LL, Willingham D, Winograd N. Three-dimensional molecular imaging using mass spectrometry and atomic force microscopy. Appl Surf Sci. 2008;255:984–86. [Google Scholar]
- 47.Wagner MS, Lenghaus K, Gillen G, Tarlov MJ. Characterization and ion-induced degradation of cross-linked poly(methyl methacrylate) studied using time of flight secondary ion mass spectrometry. Appl Surf Sci. 2006;253:2603–10. [Google Scholar]
- 48.Vaidyanathan S, Fletcher JS, Henderson A, Lockyer NP, Vickerman JC. Exploratory analysis of TOF-SIMS data from biological surfaces. Appl Surf Sci. 2008;255:1599–602. [Google Scholar]
- 49.Lee JLS, Tyler BJ, Wagner MS, Gilmore IS, Seah MP. The development of standards and guides for multivariate analysis in surface chemical analysis. Surf Interface Anal. 2009;41:76–78. [Google Scholar]
- 50.Wucher A, Cheng J, Winograd N. Protocols for three-dimensional molecular imaging using mass spectrometry. Anal Chem. 2007;79:5529–39. doi: 10.1021/ac070692a. [DOI] [PubMed] [Google Scholar]
- 51.Lechene CP, Luyten Y, McMahon G, Distel DL. Quantitative imaging of nitrogen fixation by individual bacteria within animal cells. Science. 2007;317:1563–66. doi: 10.1126/science.1145557. [DOI] [PubMed] [Google Scholar]
- 52.Ostrowski SG, Van Bell CT, Winograd N, Ewing AG. Mass spectrometric imaging of highly curved membranes during Tetrahymena mating. Science. 2004;305:71–73. doi: 10.1126/science.1099791. [DOI] [PMC free article] [PubMed] [Google Scholar]
- 53.Debois D, Bralet MP, Le Naour F, Brunelle A, Laprevote O. In situ lipidomic analysis of nonalcoholic fatty liver by cluster TOF-SIMS imaging. Anal Chem. 2009;81:2823–31. doi: 10.1021/ac900045m. [DOI] [PubMed] [Google Scholar]
- 54.Brunelle A, Laprevote O. Lipid imaging with cluster time-of-flight secondary ion mass spectrometry. Anal Bioanal Chem. 2009;393:31–35. doi: 10.1007/s00216-008-2367-3. [DOI] [PubMed] [Google Scholar]
- 55.Kurczy ME, Piehowski PD, Willingham D, Ding J, Molyneaux KA, et al. Nanotome cluster bombardment to recover spatial chemistry after preparation of biological samples for SIMS imaging. J Am Soc Mass Spectrom. 2009 doi: 10.1016/j.jasms.2010.01.014. Manuscript submitted. [DOI] [PMC free article] [PubMed] [Google Scholar]
- 56.Nygren H, Hagenhoff B, Malmberg P, Nilsson M, Richter K. Bioimaging TOF-SIMS: high resolution 3D imaging of single cells. Microsc Res Tech. 2007;70:969–74. doi: 10.1002/jemt.20502. [DOI] [PubMed] [Google Scholar]
- 57.Fletcher JS, Lockyer NP, Vaidyanathan S, Vickerman JC. TOF-SIMS 3D biomolecular imaging of Xenopus laevis oocytes using buckminsterfullerene (C60) primary ions. Anal Chem. 2007;79:2199–206. doi: 10.1021/ac061370u. Presents the first 3D image of a single biological cell. [DOI] [PubMed] [Google Scholar]
- 58.Russo MF, Postawa Z, Garrison BJ. A computational investigation of C60 depth profiling of Ag: molecular dynamics of multiple impact events. J Phys Chem C. 2009;113:3270–76. [Google Scholar]