

Abstract
The 40-residue peptide isoform β-Amyloid (Aβ1–40) is associated with Alzheimer's disease. Although found in the tangles and fibrous mats that characterize the brain in advanced stages of the disease, the toxic form of Aβ is believed to be oligomers or “protofibrils”. Characterization of these fairly small structures in solution, especially in the presence of the much larger assemblies they also form, is a daunting task. Additionally, little is known about the rate of Aβ assembly or whether it can be triggered easily. Perhaps most importantly, the conditions for reversing assembly are not fully understood. Fluorescence photobleaching with modulation detection of the recovery profile is a sensitive and materials-efficient way to measure diffusers over a wide range of hydrodynamic size. The method does require attachment of a fluorescent label. Experiments to validate the use of 5-carboxyfluorescein-labeled Aβ(1–40) as a representative of the unlabeled, naturally occurring material included variation of photobleaching time and mixture of labeled and unlabeled materials. A dialysis cell facilitated rapid in situ changes in pH and salt conditions. Multiple steps and complex protocols can be explored with relative ease. Oligomeric aggregates were found by fluorescence photobleaching recovery to respond readily to pH and salt conditions. Changing these external cues leads to formation or disassembly of aggregates smaller than 100 nm within minutes.
Introduction
The β-amyloid (Aβ) peptide is believed to play a causative role in the pathogenesis of Alzheimer's disease.1–4 The exact mechanism of toxicity is unclear, but conformational change from a soluble random coil or α-helix to a β-sheet fibrillar intermediate may be a crucial link in the pathogenic cascade.5;6 Small aggregates7 (oligomers, protofibrils) were reported to be more neurotoxic than larger ones8 (fibrils). Several approaches to reduce in vivo levels of Aβ and its associated aggregates are being developed,9 but little is known about whether and under what conditions aggregation can be reversed, once started. For amyloid on substrates, these questions can be probed by surface plasma resonance and/or atomic force microscopy.10–12
From the standpoint of macromolecular characterization in free solution, Aβ poses a difficult challenge because low-M (~4000 Da) monomers may coexist with macroscopically large fibrils. This complicates measurements by light scattering, which preferentially detects large entities. Under ordinary conditions, diffusion-ordered NMR spectroscopy (DOSY) is not well suited to the measurement of very large, slow diffusers, and these may sediment too quickly in analytical ultracentrifugation measurements. The need to sample many diffusers complicates the application of fluorescence correlation spectroscopy (FCS), which is a near-single-molecule method.
Fluorescence photobleaching recovery (FPR) with modulation detection is a powerful method to characterize polydisperse distributions over a very wide range of sizes.13–15 Recently, a dialysis cell was reported for use with FPR.16 This simple development affords a very powerful tool for rapid and efficient change of sample conditions and is especially useful for precious samples, as only a few microliters of solution are required. The high specificity of the FPR method (only fluorescently tagged diffusers are detected) proves useful in multicomponent systems.
In the present work, these FPR attributes are applied to the study of the stability and reversibility of Aβ aggregates with respect to pH and simple salts. The use of a dialysis cell permits multi-step salt and pH progressions to be investigated. These main topics are prefaced by the requisite consideration of the principle deficiencies of FPR, which are the need to label the samples with a photobleachable dye and the possibility that photobleaching causes artifacts.
Materials and Methods
Safety
During preparation of Aβ solutions, a face shield and gloves were worn, and care was taken not to leave any of the powdered protein on the benchtop, balance, or other equipment.
Reagents and Chemicals
Three synthetic peptide samples were purchased from Anaspec, Inc. (San Jose, CA); they were β-amyloid(1–40)•HCl, β-amyloid(1–40), and fluorescently labeled β-amyloid(1–40) (catalog #'s 20698, 24236 and 23513, respectively). No distinction is drawn between the two forms of β-amyloid, with or without HCl, as appropriate for dilute solutions in buffer. H3PO4 (99.999%, Catalog # 34,524–5) and semiconductor-grade KOH (99.99%, Catalog No. 30,656–8) were obtained from Aldrich. NaCl (99.999%, Catalog No. 10862) and CaCl2 (99.99%, Catalog No. 44280) were obtained from Alfa Aesar. The filters used were from Whatman, 0.02 μm (Anotop 10, Catalog No. 6809-1102).
Sample Preparation
A challenge in preparing β-amyloid samples is controlling the initial, unaggregated state of the peptide. This is particularly important in the present study, due to the emphasis on the initial phase of amyloid aggregate formation. The presence of small aggregates, or `seeds', was reported to greatly accelerate the aggregation of Aβ.17 To circumvent this problem, stock solutions were prepared by dissolving the Aβ peptide in 10 mM aqueous potassium hydroxide because a high-pH environment is one of several strategies18–21 to produce `stable' solutions of amyloidogenic proteins—i.e., ones that do not immediately form protofibrils when changed to physiologically similar phosphate buffer conditions.
Stock solutions (500 μM) were prepared by dissolving the peptide in 10 mM potassium hydroxide and vortexing until completely dissolved. Alternatively, preparations were sonicated in a Branson Model No. 2510 bath sonicator to achieve complete dissolution. The sonication was done in five-second cycles to prevent heat from affecting the sample, with a wait of 10–20 s between cycles. An aliquot (20 μL) was removed for amino acid analysis (AAA) and the remaining solution was filtered through a 0.02-μm Whatman Anotop filter. Following filtration, an aliquot was removed for AAA to ensure that the concentration was not altered. A 10× phosphate-buffered saline (PBS) buffer, pH 7.4 (0.5 M phosphoric acid, 1.5 M sodium chloride, 115 mM potassium hydroxide) was filtered through a 0.2-μm Whatman Anotop filter, after which it was mixed with the desired volume of Aβ(1–40) stock to make final solutions of desired peptide concentration in PBS, pH 7.4. Water was first added to the peptide filtrate prior to adding the desired amount of PBS needed for 50 mM, in order to prevent rapid aggregation from disrupting the sample at such high ionic strength. Dilute solutions were made by adding buffer to the stock solution. The samples were loaded in 0.2-mm-path-length rectangular microslides (VitroCom) by capillarity, and the microslides were flame-sealed. Measurements commenced quickly after loading.
Fluorescence Photobleaching Recovery
The fluorescence photobleaching recovery apparatus has been described previously22 and is similar in principle to the one developed by Lanni and Ware.23 Briefly, the image of a Ronchi ruling (a striped piece of glass) is projected with demagnification into a sample containing a few microliters of a solution of fluorescently dyed macromolecules. During an intense laser pulse, typically 5% – 10% of the dyes are photobleached but only in the brightly illuminated regions of the sample corresponding to the clear zones of the striped pattern. This results in a weakly contrasting optical profile. The fading of that profile due to diffusion is followed by illuminating the sample with a much weaker beam (~2000× less intense) and measuring the modulated fluorescence signal created as the Ronchi ruling (and the pattern it casts) is translated back and forth in a direction perpendicular to the stripes. In the instrument's current incarnation, the translation is accomplished by wiggling the Ronchi ruling using an electromechanical transducer. A peak voltage detection circuit produces a voltage proportional to the optical contrast. For a single diffuser with diffusion coefficient D, the signal is a single exponential decay with decay rate Γ = K2D, where K = 2π/L and L is the spatial period of the striped pattern measured in the sample. In the present experiments, low-magnification objectives are used to cast the striped pattern into the sample; this results in fairly long photobleaches and low K values (usually 253 cm−1 or 405.3 cm−1). Multiple species are present during amyloid assembly.11;20;24 but the signals in FPR are easily understood by imagining a bimodal distribution (which almost characterizes many of our results). If the population of diffusers is characterized by two species not in dynamic exchange over the period of the measurements (typically a few minutes) the contrast signal will contain two exponential terms:
| (1) |
where t is the elapsed time since the photobleaching pulse and amplitudes A1 and A2 are, to first approximation, proportional to the concentration of the two species (this assumes equal levels of dye attachment, equal ability to be photobleached, and equal fluorescence per dye group—all reasonable assumptions in the present experiments). Improvements to the analysis software permit the instrument to handle multiple-exponential decay profiles, using the standard CONTIN25;26 inverse Laplace transform algorithm. FPR has substantial advantages over dynamic light scattering when it comes to measurement of polydisperse systems.13;15
In some experiments, particularly those designed to follow changes in Aβ(1–40) diffusion through a series of salt and/or pH conditions, an in situ FPR dialysis cell was used. In this cell, about 250 μL of sample was sandwiched between a clear glass viewing port and a dialysis membrane (2000 Da MWCO membrane, Spectrum Laboratories Inc. Spectra/Por #7). This regenerated cellulose material is supplied with 0.1% NaN3 and pretreated to eliminate heavy metals and sulfides. The mass cut-off of 2000 Da is expressed for globular proteins; assuming a spherical shape and density of ~1.3 g/mL, it is easy to show that the membrane will retain molecules whose radius exceeds about 0.85 nm. Prior to use, the membrane was extensively rinsed with filtered water to remove the sodium azide and then placed in a beaker with 1 L of water and stirred using a magnetic stir bar for 2 hours with two changes of water after 30 minutes and an hour. Otherwise, the sample only contacted the PTFE housing. A mini peristaltic pump (Crouzet, France) was used to circulate the exchange fluid through the 15-mL subchamber from a 250 mL flask at the rate of 20 mL/min. The large dialysis area (~4.2 cm2), together with the thinness of the sample, facilitates rapid dialysis.
Results and Discussion
Effect of Photobleaching Time/Photobleaching Depth
A sequence of experiments was designed to assess the effect of photobleaching time and the associated bleach depth on measured diffusion values in solutions composed of 100% 5-carboxyfluorescein-labeled Aβ(1–40) and in solutions containing a 25% / 75% mixture of 5-carboxyfluorescein labeled Aβ(1–40) plus unlabeled Aβ(1–40), each dissolved at a concentration of 50 μM in 50 mM PBS, 150 mM NaCl, pH 7.4. (The desirability of mixing labeled and unlabeled material is discussed later.) Figure 1 shows the diffusion coefficient as a function of increasing bleach time; laser intensity was held constant at 0.5 W. There is scarcely any difference in the diffusion coefficients obtained for the two samples; in both cases, the apparent rate of diffusion decreases with increasing bleach time. This suggests possible light-driven associations or photopolymerization. If cleavage of the fluorophore had occurred, then faster diffusion values representative of free dye would have been expected. Scission of the peptide into labeled and unlabeled fragments would also result in artificially elevated diffusion coefficents. At the highest bleach time of 3 s, the bleach depth (percentage of dyes bleached) reached 50% and resulted in contrast signals too large to be digitized in the first part of the recovery. Such signal clipping focuses the analysis on the data at longer recovery times, and this may account for some of the apparent loss of diffusivity at bleach times of 3 s. Most experiments were conducted at bleach times of 0.5 – 0.8 s, much shorter than the characteristic recovery times. These bleaches resulted in less than 10% of dyes being destroyed, far less than the deep (often exceeding 50%) photobleaches often used in the original and still most commonly practiced form of FPR, in which a circular or Gaussian spot is illuminated. The periodic boundary condition imposed by the striped pattern in our system also simplifies the analysis of polydisperse systems because each diffuser is assigned a single exponential decay term.23;27
Figure 1.
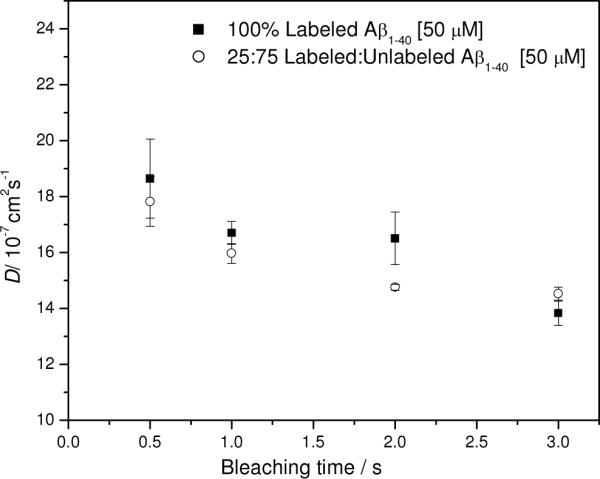
Diffusion as a function of bleaching time for labeled Aβ(1–40) and a mixture of labeled and unlabeled Aβ(1–40). Filled squares: 100% 5-carboxyfluorescein Aβ(1–40), 50 μM peptide. Open circles: mixture of 25% 5-carboxyfluorescein-labeled Aβ(1–40) with 75% Aβ(1–40) expressed as percentage of 50 μM peptide. Conditions: 50 mM PBS, 150 mM NaCl, pH 7.4, 0.5 Watts laser power. Error bars represent standard deviations from triplicate runs.
Effect of fluorescent label: general considerations
It has been shown that labeling Aβ exclusively at the N-terminus of the peptide minimizes modifications to the conformation caused by the fluorophore's presence and preserves the original biological activity.28;29 The effect of a fluorophore's presence on Aβ(1–40) solution properties was examined previously30 by preparing samples containing different ratios of 5-carboxyfluorescein-labeled Aβ(1–40) to unlabeled Aβ1–40; these samples were compared to 100% labeled Aβ(1–40). Although FPR can only detect the labeled molecules, the study of Ref. 30 was intended to determine whether the dye moiety they bear interacts with unlabeled Aβ(1–40). It was found that the observed diffusion coefficient of the 100% labeled sample was within error of that measured in the mixed labeled/unlabeled samples (Figure 2 of Ref. 30), indicating that the dye moiety does not itself preferentially interact with unlabeled Aβ(1–40). The result seems to suggest that any ratio of labeled to unlabeled material could be used in the present case. Generally speaking, though, if a protein is purchased fully labeled, mixing in some unlabeled material may help to spread any damage due to photodecomposition to molecules not visible to the FPR experiment.
Figure 2.
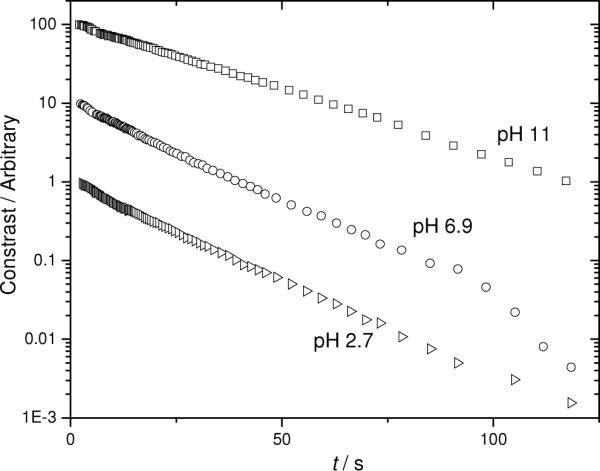
Semilogarithmic FPR traces for three different Aβ solutions at different pH values, prior to substantial aggregation. Conditions: 100 μM 25% / 75% mixture of 5-carboxyfluorescein Aβ and unlabeled Aβ in 50 mM PBS, 150 mM NaCl at pH values ▷2.7, ○ 6.9, and □ 11. Data have been offset vertically for clarity.
Measurements under conditions not favoring aggregation (unbuffered 10 mM KOH): Monomer Diffusion Coefficient
The rate of Aβ aggregation is known to depend on the peptide concentration, pH and ionic strength.31–35 In addition, details of sample preparation—such as trace impurities in the sample containers, surface roughness of vessels to which the sample is exposed, introduction of salt, metal ions, and contact with metals—can all induce aggregation; see for example Refs.18;19. It is important to investigate whether the fluorescent label could have an effect, too. One way to do this is to determine whether labeled materials hasten or delay aggregation under conditions not normally associated with self-assembly.
The diffusion coefficient of 5-carboxyfluorescein-labeled Aβ(1–40) in samples also containing Aβ(1–40) was examined in unbuffered 10 mM KOH. Increasing the total Aβ concentration from 100 μM to 300 μM had little effect on the diffusion coefficient of labeled Aβ in 75% / 25% labeled/unlabeled preparations. The samples were measured on three consecutive days, stored in a dark chamber at ambient temperature, ~25°C, and measured again on the 26th day following sample preparation. Unlabeled Aβ peptide has not been observed to aggregate at high pH, so neither time nor concentration dependence on the diffusion coefficient of the labeled peptide should be expected if the label does not trigger aggregation. For the first three days, the diffusion coefficients at all Aβ concentrations were almost identical within experimental error at (1.55 ± 0.15) × 10−6 cm2s−1. This is very close to the value from pulsed field gradient NMR (PFGNMR) measurements by Tseng et al.,36 who report ~1.5 × 10⁻⁶ cm2s−1. These authors concluded on the basis of size exclusion chromatography comparisons to other peptides that this value represents the monomeric form of Aβ(1–40). The result is consistent with an expanded coil peptide, as suggested by Danielsson et al.37 who used PFGNMR to examine Aβ(1–40) and related fragments. Similar values are observed in trifluoroethanol, but interpreted using a hard sphere model, with substantial salvation.38 In general, there is fair agreement with simulations by Massi on Aβ(10–35) (~1.4 × 10⁻⁶ cm2s−1) and the experimental results are sensibly smaller than the 2.48 × 10⁻⁶ cm2s−1 value reported39 by Mansfield et al. for the significantly smaller Aβ(12–28) molecule using PFGNMR. These latter authors, working at concentrations >5 times higher than the present measurements, probably due to the sensitivity limits of the PFGNMR method, but with the benefit of a disulfide-linked [Cys20]Aβ(12–28) analog, also estimate the diffusion coefficient of Aβ(12–28) dimers to be 1.78 × 10⁻⁶ cm2s−1. Other authors suggest dimers and higher aggregates are not easy to detect in PFGNMR.37
From the foregoing, the diffusion coefficient of the present study seems to be consistent with monomeric Aβ; however, after 26 days at pH 10, the diffusion coefficient of labeled Aβ(1–40) almost doubled to ~3 × 10⁻⁶ cm2s−1. Two interpretations consistent with this finding are that the Aβ peptide “tucked the dye away” to hide its mildly hydrophobic character resulting in a smaller structure, as seen in an unrelated system,40 or that the peptide was damaged by long exposure to high pH at 25°C. Another interpretation might at first seem to be consistent with the doubling of diffusion coefficient over long periods. One can imagine that our measured value of (1.55 ± 0.15) × 10−6 cm2s−1 represents dimer. In this putative scenario, the diffuser with D ≈ 3 × 10⁻⁶ cm2s−1 is imagined to be monomer. It could then be supposed that the species with D = (1.55 ± 0.15) × 10−6 cm2s−1 is dimer; this argument breaks down, though, because diffusion coefficient does not increase linearly with mass, except for end-to-end aggregation of thin rods.41 The Aβ(1–40) molecule is too small to ever be treated as a thin rod, and simulations of the Aβ(10–35) congener42 do not indicate very high extensions. Following the suggestion of Massi et al.42 that D ~ M−1/3 or D ~ M−2/5 one may expect the breakup of protein dimers to result not in a doubling of the diffusion coefficient but only in a 25% – 30% increase. Thus, if one assigns the highest measured D value (≈ 3 × 10⁻⁶ cm2s−1) to fluorescently labeled monomer, observed only after long times at pH 10 (and also after long exposure to high temperature; see below) one has then to suppose that the solute having D = (1.55 ± 0.15) × 10−6 cm2s−1 is a multimer. It seems far more likely that the specie with diffusion coefficient in 10 mM KOH of (1.55 ± 0.15) × 10−6 cm2s−1 is monomeric, labeled Aβ(1–40), especially given the agreement with the simulations39 and PFGNMR measurements.36–38 From Stokes' law [D = kT/(6πηRh) where kT is the molecular thermal energy and η is the viscosity] the corresponding hydrodynamic radius is Rh = 1.58 ± 0.15 nm.
Measurements in 50 mM phosphate, 150 mM NaCl
Studies at more physiologically meaningful pH were conducted in 50 mM phosphate buffer with 150 mM added NaCl. The experiments were performed at a single Aβ concentration, 100 μM, and the sample contained less labeled peptide relative to unlabeled than previously (25% labeled and 75% unlabeled). As discussed above, this strategy may help to give any photodecomposition products ample opportunity to attack unlabeled Aβ molecules, to which the FPR experiment is blind, rather than fluorescently labeled diffusers. It simultaneously provides more unaltered Aβ peptide, in case there is a difference between labeled and unlabeled material when it comes to initiating the growth of fibrils (100% 5-carboxyfluorescein labeled Aβ does make macroscopically large fibrils,30 but it is not known whether it does so as readily as unlabeled material). Three pH values were selected, representing conditions thought to put the peptide in a highly aggregated state eventually (pH 2.7), a monomeric or low oligomeric state (pH 6.9) and a purely monomeric state (pH 11). The most rapid aggregation near the isoelectric point6;35 (pH ~5.5) was deliberately avoided in order to keep the focus on low-intermediate aggregates. The semilogarithmic FPR traces in Figure 2 show the almost single-exponential FPR signals characteristic of monodisperse samples; however, close inspection shows modest curvature and overall faster decays at pH 6.9 and pH 2.7, even though aggregation is expected eventually.
The induction time to form larger, slowly diffusing aggregates in glass FPR cells seems to vary, but aggregation is clearly evident in the raw FPR traces once it begins.30 Inverse Laplace transform (ILT) analysis of the raw signals was performed using Provencher's CONTIN program43;44 to estimate the relative fluorescence intensity associated with each diffuser. The resulting distributions appear in Figure 3.
Figure 3.
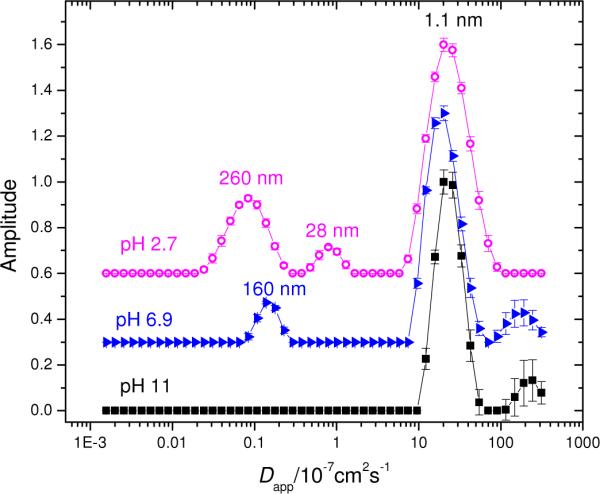
Distributions of apparent diffusion coefficient from CONTIN analysis of FPR data for aggregated Aβ at three pH values. The samples were measured 14 days after preparation. Conditions: 100 μM 25% / 75% mixture of 5-carboxyfluorescein Aβ and unlabeled Aβ in 50 mM PBS, 150 mM NaCl at pH values  2.7,
2.7,  6.9, and ■ 11. The vertical scales at pH 6.9 and pH 2.7 have been offset for clarity. Apparent hydrodynamic radii are indicated (does not imply spherical shape for the diffusers.)
The comparatively narrow major peak seen for pH 11 indicates that most diffusers have a similar diffusion coefficient and, therefore, size. The major peaks seen at pH 2.7 and 6.9 exhibit slightly greater breadth, consistent with the mild curvature reported in Figure 2, and are joined by one (pH 6.9) and two (pH 2.7) additional peaks of lesser amplitude; these represent aggregates. Application of CONTIN to FPR data is discussed elsewhere.13;15 Assuming the labeled material finds its way into fibrils of large and small size equally well, FPR distributions are weighted one moment lower than comparable distributions from dynamic light scattering (DLS). It would be difficult for DLS to find the fast, monomeric diffusers of Figure 3 in the presence of large, strongly scattering material. Additional details of the ILT analysis of the FPR data appear in the supporting information. In particular, Figure S1 shows computer screen shots taken during the data analysis. In practice, these screens are viewed between inspection of the raw data and generation of distribution plots such as those appearing in Figure 3; they increase confidence in the CONTIN analysis by showing residuals to the fits and the results of single-, double- or multiple-exponential fitting methods.
Temperature dependence
The effect of temperature on Aβ assembly is shown in Figure 4; the standard D ~ T/η adjustment for viscosity, η, has been applied on the abscissa (given the fairly low concentration of all components in these solutions, tabulated viscosities of pure water were used). High temperature often enhances hydrophobic effects, so one might expect temperature to induce the self-assembly of the Aβ peptide or increase its rate of occurrence, leading to a preponderance of slow diffusers. Instead, both fast and slowly diffusing species were present over the duration of the experiment. The diffusion coefficients of the main, fast mode is always a little higher than it was in 10 mM KOH; perhaps the molecule has contracted some in response to the lower pH and higher salt. Careful inspection of Figure 4 reveals a further, significant increase with temperature. This is consistent with damage to the peptide, conformational transition or the aforementioned “tuck-away” mechanism. No attempt has been made to distinguish among these possibilities (e.g., by MALDI measurements) because the main interest was to learn whether temperature could be used to induce fibril formation conveniently. No evidence was found to support this idea under the conditions of our measurement (prior to the rapid growth stage of assembly) but a strong correlation between temperature and rate of growth has been reported,45 based on DLS measurements.
Figure 4.
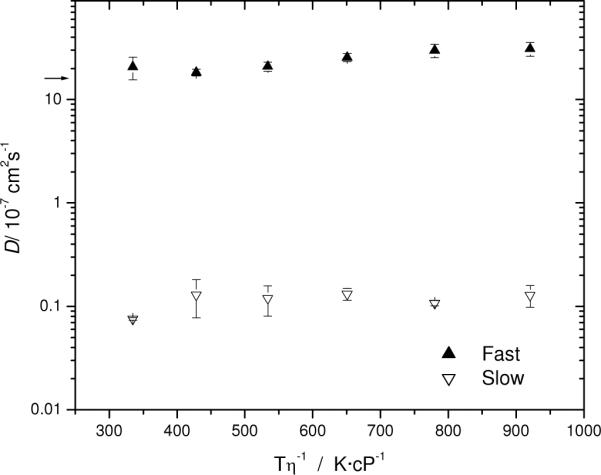
Effect of temperature on the diffusion of Aβ peptide, corrected for solvent viscosity, η. Conditions: 100 μM Aβ in a 100 mM PBS, 150 mM NaCl, pH 7.4. The arrow indicates the monomeric Aβ1–40 diffusion value (for 10 mM KOH).
β amyloid assembly as studied by dialysis FPR
The experiments described in this section were conducted using the in situ FPR dialysis cell to exert quicker control over pH and electrolytes. The rate of Aβ(1–40) aggregation was monitored by dialyzing 50 μM of labeled Aβ(1–40) sample against 10 mM citrate buffer at pH 5.0. First, the sample was solubilized in 10 mM KOH. Aggregates became apparent in the FPR signal about one hour after the introduction of citrate. The aggregates diffused about 15 times more slowly than monomer, corresponding to a hydrodynamic radius of ~23 nm. Coexisting with the original monomeric component, the aggregates accounted for about 18% of the fluorescent signal. Curiously, the aggregates were not detected after another hour, which may be due to resolvation. (One might be tempted to attribute the absence of aggregates after one hour to their adherence to the membraneous floor of the cell, but this possibility, along with growth to a size too large to measure, is easy to detect in FPR experiments by the appearance of a permanent baseline in the recovery profile).
An alternate buffer was desired in which the Aβ(1–40) aggregation would be slightly slower, to facilitate variation of other conditions. Of particular interest are metal ions. Calcium in particular is thought to be an important factor in amyloid diseases.46 As a first study, a fresh sample composed of 50 μM labeled Aβ in 10 mM KOH was dialyzed against 100 μM acetate buffer at pH 4.0. As shown in Figure 5, both fast and slow diffusers were present after about 30 min of dialysis. There was a slight decrease in the diffusion coefficient over the first 5 h of dialysis, but an additional 14 h resulted in no further change, within experimental uncertainty. This suggests that the aggregates had stabilized. The amount of CaCl2 required to bring the dialysis fluid to 5 mM was added and the sample was dialyzed for ~1 h. The FPR response remained biexponential, and both the slow and fast diffusion coefficients decreased with increasing CaCl2, at least up to 15 mM. After bringing the dialysis fluid to 25 mM CaCl2 and allowing for exchange, the diffusion coefficient at first remained identical, within error, to that measured at 15 mM. After an additional two hours of dialysis at 25 mM CaCl2, the diffusion coefficient had increased to a value slightly higher than that obtained with 15 mM CaCl2, but overall, still smaller than when the sample was dialyzed against the pH 4 acetate buffer. Thus, addition of CaCl2 (up to 15 mM) facilitated the aggregation of Aβ, but additional CaCl2 (up to 25 mM) suppressed this effect. The reason for this is not obvious but complicated effects of metal ions on Aβ aggregation are known. For example, Zn(II) was found to promote Aβ aggregation at normal pH while suppressing Aβ aggregation at slightly acidic pH conditions.47
Figure 5.
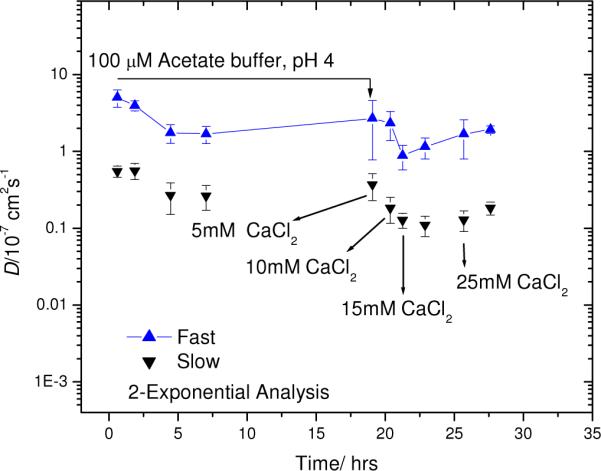
One-pot dialysis of 50 μM 5-carboxyfluorescein labeled Aβ starting at pH 11, then dialyzing against 100 μM acetate buffer, pH 4, and increasing the concentration of CaCl2.
Figure 6 shows the percent of signal amplitude (see Eq. 1) corresponding to each biexponential decay mode represented in Figure 5. Every point represents an average of three measurements, each taken after selecting a different region of the sample to minimize the risk of detecting photodamaged materials (despite the low photobleaching depth). Although the diffusion of the larger, slower species declines as CaCl2 is added, the amount of signal amplitude ascribed to this mode remains relatively constant, suggesting accretion of these species rather than growth at the expense of the smaller, faster diffusers.
Figure 6.
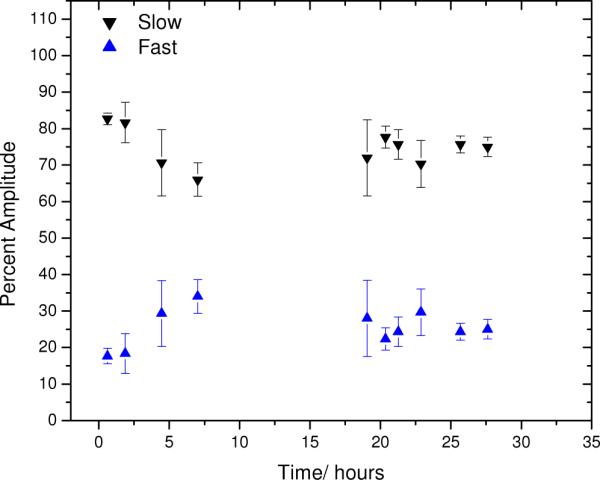
Percent amplitude of fast and slow components of FPR recoveries corresponding to the aqueous conditions of Figure 5.
After the acetate and CaCl2 additions described so far, it appeared that the formation of aggregates was sequestering the fluorophore. This was evident from a significant loss of fluorescence in the sample and the appearance of black (non-fluorescent) aggregates when the sample was viewed using the FPR instrument as an epifluorescence microscope. The full fluorescence intensity was recovered by adjusting the pH to 1 with HCl, followed by exchange to 50 mM phosphate buffer, pH 7.2. This was accompanied by the return of the diffusion coefficient to the expected monomer value and the virtual disappearance of the slow FPR recovery mode (data not shown). Although the pH 1 step raises the possibility of sample degradation through acid hydrolysis, the reversal of aggregate formation warrants further exploration.
Reversibility of the β amyloid Assemblies
The intriguing possibility that Aβ(1–40) aggregation can be reversed by pH was studied further through repeated and much milder pH changes, again using the dialysis cell. First, the effect of pH on the diffusion coefficient of labeled Aβ, without addition of any unlabeled material, was monitored. Figure 7 shows the diffusion coefficient of 100 μM labeled Aβ, initially dissolved in 10 mM KOH, brought to pH 11, and then sequentially dialyzed against 50 mM K2PO4, pH 2.7, and 50 mM PB, pH 7.2. As the system is dilute, the diffusion coefficient can be converted to a hydrodynamic radius through Stokes' law. The hydrodynamic radius of the peptide at pH 7.2 is about 1.5 nm, close to that found for monomeric Aβ peptide in 10 mM KOH. At pH 2.7, the formation of protofibrils resulted in decreased diffusion coefficient, corresponding to a hydrodynamic radius of about 90 nm. (The calculation of a hydrodynamic radius does not imply sphericity of the diffuser. By definition, the hydrodynamic radius specifies the size of a hypothetical sphere which diffuses as fast as the measured object; it may be used as a convenient estimator of the “size”.) As shown by the down-going spike in Figure 7, much larger entities (ca. 1 μm) could be detected in some regions of the sample at ~ 4.5 h. The sample was then dialyzed back against the phosphate buffer at pH 7.2. The diffusion coefficient rose to nearly the starting value. No further change in the diffusion coefficient was observed while repeatedly measuring the sample as it underwent dialysis over the course of about 15 h.
Figure 7.
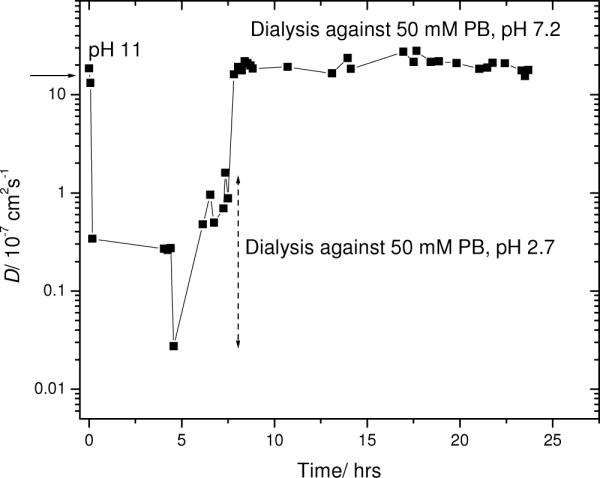
Diffusion from in situ FPR of 50 μM 5-carboxyfluorescein-Aβ starting at pH 11, then sequentially dialyzed to pH 2.7 and pH 7.2. Arrow indicates diffusion of monomeric Aβ(1–40) (in 10 mM KOH).
To further explore reversibility, this same kind of experiment was repeated with a 100 μM sample that contained 75% unlabeled Aβ peptide. Figure 8 shows the time response of the diffusion coefficient, starting at pH 11 and alternating between pH 2.7 and pH 7.4 in 50 mM phosphate buffer. The trend in the diffusion coefficient was similar to that obtained for the 100% labeled Aβ peptide in Figure 7. At pH 7.4 the Aβ had an apparent hydrodynamic radius of about 1.5 nm. At the lower pH, 2.7, the apparent hydrodynamic radius reached 85 nm on the first cycle but only 46 nm on the second. In the experiments of Figures 7 and 8, the isoelectric point at ~ pH 5.5 is apparently crossed too fast to result result in lasting aggregates.
Figure 8.
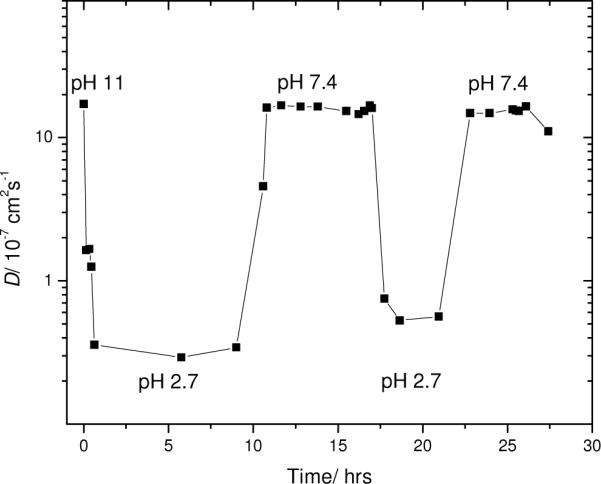
Diffusion from in situ FPR of 100 μM 5-carboxyfluorescein-Aβ (25% mixed with unlabeled 75% Aβ) starting at pH 11, then alternately dialyzed between pH 2.7 and pH 7.4 in 50 mM phosphate buffer.
Long-term Dialysis Experiment
One final experiment was performed with the in situ dialysis FPR cell, in order to determine whether extensive dialysis would raise the diffusion coefficient beyond the value estimated for monomer in previous sections—i.e., by teasing apart putative dimers by equilibrium exchange of any trace impurities with a prodigious excess of buffer. At the end of the experiment shown in Figure 8, the Aβ peptide solution was extensively dialyzed for a week at pH 7.4. No change was observed. On the other hand, neither was there evidence of aggregation, which might be expected for the duration and conditions of the experiment (see, for example, Ref. 19). Thus, while aggregation is easily and reversibly induced in the dialysis FPR cell by lowering the pH to 2.7 through the isoelectric point, the protein is slow to aggregate in this cell at pH 7.4 in 50 mM phosphate buffer. These differences cannot be resolved based on the present experiments, but two considerations deserve mention because of the partially hydrophobic nature of Aβ: 1) samples placed in dialysis cell are not in contact with air, unlike most experiments; and, 2) the dialysis cell has a very high surface-to-volume ratio compared to most vessels for experimentation; this is also true of the glass rectangular microslides.
Conclusions
The diffusion coefficient of monomeric 5-carboxyfluorescein-labeled β-amyloid is established with reasonable certainty as (1.55 ± 0.15) × 10−6 cm2s−1 in 10 mM KOH. This value may also be observed, prior to aggregation, at physiologically significant pH in phosphate buffer (Figure 8) but slightly higher diffusion coefficients are sometimes measured (Figure 4). These variations, which lay only a little bit out of our experimental uncertainty, do not affect the other conclusions.
FPR studies on 5-carboxyfluorescein-labeled β-amyloid peptide solutions readily detected the coexistence of large and small species under appropriate conditions. Formation of aggregates in the rectangular microslides sometimes required a long gestation period; more than 3 weeks was not sufficient in some observations. To provide an easy way to initiate fibril formation, address the question of reversibility, and to improve the economy of experimenting with expensive Aβ protein, an in situ dialysis cell for FPR was developed. Apparent salting-out/salting-in behavior was observed for CaCl2; however, no claim is made that this represents equilibrium behavior (even longer waits between adjustments to the CaCl2 conditions may be required). The reversibility of peptide assembly from the low oligomeric state to an aggregated state of still-modest size was demonstrated by toggling the system between physiological and low pH conditions, through the isoelectric point.
The most significant development of this work is the reversal, at least once or twice, of oligomers and aggregates initiated in the dialysis FPR cell. Future studies should focus on whether reversals still occur when the aggregates are given more time to develop, or brought close to the isoelectric point rather than across it quickly. Also, dialysis FPR should be able to simulate a wider range of cellular environments to provide information about the structural changes that accompany the passage of Aβ or other proteins inside or outside the cell. The action of potential therapeutic molecules48–51 on Aβ assembly may be studied in this fashion.
Supplementary Material
Acknowledgments
This work was supported by the National Science Foundation DGE-9987603 and by the National Institute on Aging through grant AG17983. We thank Marcus Etienne for helpful discussions concerning sample preparation. We are grateful to the reviewers for helpful comments and insights.
Footnotes
Supporting Information Available. Illustration of the graphical interface for testing agreement between CONTIN and nonlinear, single- or multi-exponential fits.
Reference List
- 1).Hardy J, Selkoe DJ. Science. 2002;297:353–356. doi: 10.1126/science.1072994. [DOI] [PubMed] [Google Scholar]
- 2).Rosenberg RN. Neurology. 1993;43:851–856. doi: 10.1212/wnl.43.5.851. [DOI] [PubMed] [Google Scholar]
- 3).Lansbury PT., Jr. Acc. Chem.Res. 1996;29:317–321. [Google Scholar]
- 4).Selkoe DJ. Science. 1997;275:630–631. doi: 10.1126/science.275.5300.630. [DOI] [PubMed] [Google Scholar]
- 5).Jarrett JT, Lansbury PT. Biochemistry. 1992;31:12345–12352. doi: 10.1021/bi00164a008. [DOI] [PubMed] [Google Scholar]
- 6).Snyder SW, Ladror US, Wade WS, Wang GT, Barrett LW, Matayoshi ED, Huffaker HJ, Krafft GA, Holzman TF. Biophys.J. 1994;67:1216–1228. doi: 10.1016/S0006-3495(94)80591-0. [DOI] [PMC free article] [PubMed] [Google Scholar]
- 7).Lansbury PT., Jr. Proc. Natl. Acad. Sci. U.S.A. 1999;96:3342–3344. doi: 10.1073/pnas.96.7.3342. [DOI] [PMC free article] [PubMed] [Google Scholar]
- 8).Forloni G. Current Opinion in Neurology. 1996;9:492–500. doi: 10.1097/00019052-199612000-00017. [DOI] [PubMed] [Google Scholar]
- 9).Conway KA, Baxger EW, Felsenstein KM, Reitz AB. Current Pharmaceutical Design. 2003;9:427–447. doi: 10.2174/1381612033391649. [DOI] [PubMed] [Google Scholar]
- 10).Ban T, Hoshino M, Takahashi S, Hamada D, Hasegawa K, Naiki H, Goto Y. J. Mol. Biol. 2004;344:757–767. doi: 10.1016/j.jmb.2004.09.078. [DOI] [PubMed] [Google Scholar]
- 11).Cannon MJ, Williams AD, Wetzel R, Myszka DG. Anal. Biochem. 2004;328:67–75. doi: 10.1016/j.ab.2004.01.014. [DOI] [PubMed] [Google Scholar]
- 12).Hasegawa K, Ono K, Yamada M, Naiki H. Biochemistry. 2002;41:13489–13498. doi: 10.1021/bi020369w. [DOI] [PubMed] [Google Scholar]
- 13).Doucet GJ, Dorman D, Cueto R, Neau D, Russo PS. Macromolecules. 2006;39:9446–9455. [Google Scholar]
- 14).Russo PS, Qiu J, Edwin N, Choi Y-W, Doucet G, Sohn D. Fluorescence Photobleaching Recovery, a Primer. In: Borsali R, Pecora R, editors. Soft-Matter Characterization. Kluwer; New York: 2008. pp. 605–636. Ch. 10. [Google Scholar]
- 15).Fong B, Stryjewski W, Russo PS. J.Coll.Int.Sci. 2001;239:374–379. doi: 10.1006/jcis.2001.7538. [DOI] [PubMed] [Google Scholar]
- 16).Cong RJ, Temyanko E, Russo PS, Edwin N, Uppu RM. Macromolecules. 2006;39:731–739. [Google Scholar]
- 17).Harper JD, Lieber CM, Lansbury PT., Jr. Chem.Biol. 1997;4:951–969. doi: 10.1016/s1074-5521(97)90303-3. [DOI] [PubMed] [Google Scholar]
- 18).Etienne MA, Edwin NJ, Aucoin JP, Russo PS, McCarley RL, Hammer RP, Fields GB. Methods in Molecular Biology (386) Humana; 2007. Methods in Molecular Biology; pp. 203–225. 2007. [DOI] [PubMed] [Google Scholar]
- 19).Fezoui Y, Hartley DM, Harper JD, Khurana R, Walsh DM, Condron MM, Selkoe DJ, Lansbury PT, Fink AL, Teplow DB. Amyloid-International Journal of Experimental and Clinical Investigation. 2000;7:166–178. doi: 10.3109/13506120009146831. [DOI] [PubMed] [Google Scholar]
- 20).Rangachari V, Moore BD, Reed DK, Sonoda LK, Bridges AW, Conboy E, Hartigan D, Rosenberry TL. Biochemistry. 2007;46:12451–12462. doi: 10.1021/bi701213s. [DOI] [PubMed] [Google Scholar]
- 21).Ferrao-Gonzales AD, Palmieri L, Valory M, Silva JL, Lashuel H, Kelly JW, Foguel D. J. Mol. Biol. 2003;328:963–974. doi: 10.1016/s0022-2836(03)00368-1. [DOI] [PubMed] [Google Scholar]
- 22).Bu Z, Russo PS. Macromolecules. 1994;27:1187–1194. [Google Scholar]
- 23).Lanni F, Ware BR. Rev.Sci.Instrum. 1982;53(6):905–908. [Google Scholar]
- 24).O'Nuallain B, Shivaprasad S, Kheterpal I, Wetzel R. Biochemistry. 2005;44:12709–12718. doi: 10.1021/bi050927h. [DOI] [PubMed] [Google Scholar]
- 25).Provencher SW. Comp.Phys. 1982;27:213–227. [Google Scholar]
- 26).Provencher SW. Comp.Phys. 1982;27:229–242. [Google Scholar]
- 27).Ware BR. Am.Lab. 1984;16:16–28. [Google Scholar]
- 28).Fulop L, Penke B, Zarandi M. Journal of Peptide Science. 2001;7:397–401. doi: 10.1002/psc.346. [DOI] [PubMed] [Google Scholar]
- 29).Prior R, Durso D, Frank R, Prikulis I, Cleven S, Ihl R, Pavlakovic G. Am. J. Pathol. 1996;148:1749–1756. [PMC free article] [PubMed] [Google Scholar]
- 30).Edwin N, Bantchev G, Russo PS, Hammer RP, McCarley RL. Elucidating the Kinetics of β-Amyloid Fibril Formation. In: Korugic L, Karasz FE, Martuscelli E, editors. New Polymeric Materials. American Chemical Society; Washington: 2005. pp. 106–118. Ch. 9. [Google Scholar]
- 31).Goldsbury CS, Wirtz S, Muller SA, Sunderji S, Wicki P, Aebi U, Frey P. J. Struct. Biol. 2000;130:217–231. doi: 10.1006/jsbi.2000.4259. [DOI] [PubMed] [Google Scholar]
- 32).Tomski SJ, Murphy RM. Arch. Biochem. Biophy. 1992;294:630–638. doi: 10.1016/0003-9861(92)90735-f. [DOI] [PubMed] [Google Scholar]
- 33).Fraser PE, Nguyen JT, Surewicz WK, Kirschner DA. Biophys.J. 1991;60:848–855. doi: 10.1016/S0006-3495(91)82154-3. [DOI] [PMC free article] [PubMed] [Google Scholar]
- 34).Yip CM, McLaurin J. Biophys.J. 2001;880:1359–1371. doi: 10.1016/S0006-3495(01)76109-7. [DOI] [PMC free article] [PubMed] [Google Scholar]
- 35).Barrow CJ, Zagorski MG. Science. 1991;253:179–182. doi: 10.1126/science.1853202. [DOI] [PubMed] [Google Scholar]
- 36).Tseng BP, Esler WP, Clish CB, Stimson ER, Ghilardi JR, Vinters HV, Mantyh PW, Lee JP, Maggio JE. Biochemistry. 1999;38:10424–10431. doi: 10.1021/bi990718v. [DOI] [PubMed] [Google Scholar]
- 37).Danielsson J, Jarvet J, Damberg P, Graslund A. Magn. Reson. Chem. 2002;40:S89–S97. [Google Scholar]
- 38).Filippov A, Sulejmanova A, Antzutkin O, Grobner G. Appl. Magn. Reson. 2005;29:439–449. [Google Scholar]
- 39).Mansfield SL, Jayawickrama DA, Timmons JS, Larive CK. Biochim. Biophys. Acta. 1998;1382:257–265. doi: 10.1016/s0167-4838(97)00162-3. [DOI] [PubMed] [Google Scholar]
- 40).Yu K, Russo PS. J.Polym.Sci., Polym.Phys.Ed. 1996;34:1467–1475. [Google Scholar]
- 41).Richards EG. An Introduction to the Physical Properties of Large Molecules in Solution. Cambridge University Press; New York: 1980. [Google Scholar]
- 42).Massi F, Peng JW, Lee JP, Straub JE. Biophys.J. 2001;80:31–44. doi: 10.1016/S0006-3495(01)75993-0. [DOI] [PMC free article] [PubMed] [Google Scholar]
- 43).Provencher SW. Comp.Phys. 1982;27:213–227. [Google Scholar]
- 44).Provencher SW. Comp.Phys. 1982;27:229–242. [Google Scholar]
- 45).Kusumoto Y, Lomakin A, Teplow DB, Benedek GB. Proc. Natl. Acad. Sci. U.S.A. 1998;95:12277–12282. doi: 10.1073/pnas.95.21.12277. [DOI] [PMC free article] [PubMed] [Google Scholar]
- 46).Ingram V. American Scientist. 2003;91:312–321. [Google Scholar]
- 47).Yoshiike Y, Tanemura K, Murayama O, Akagi T, Murayama M, Sato S, Sun X, Tanaka N, Takashima A. J. Biol. Chem. 2001;276:32293–32299. doi: 10.1074/jbc.M010706200. [DOI] [PubMed] [Google Scholar]
- 48).Etienne MA, Aucoin JP, Fu YW, McCarley RL, Hammer RP. J. Am. Chem. Soc. 2006;128:3522–3523. doi: 10.1021/ja0600678. [DOI] [PubMed] [Google Scholar]
- 49).Gordon DJ, Sciarretta KL, Meredith SC. Biochemistry. 2001;40:8237–8245. doi: 10.1021/bi002416v. [DOI] [PubMed] [Google Scholar]
- 50).Pallitto MM, Ghanta J, Heinzelman P, Kiessling LL, Murphy RM. Biochemistry. 1999;38:3570–3578. doi: 10.1021/bi982119e. [DOI] [PubMed] [Google Scholar]
- 51).Rangachari V, Davey ZS, Healy B, Moore BD, Sonoda LK, Cusack B, Maharvi GM, Fauq AH, Rosenberry TL. Biopolymers. 2009;91:456–465. doi: 10.1002/bip.21151. [DOI] [PubMed] [Google Scholar]
Associated Data
This section collects any data citations, data availability statements, or supplementary materials included in this article.