Abstract
We present a dual-element concave ultrasound transducer system for generating and tracking of localized tissue displacements in thin tissue constructs on rigid substrates. The system is comprised of a highly focused PZT-4 5-MHz acoustic radiation force (ARF) transducer and a confocal 25-MHz polyvinylidene fluoride imaging transducer. This allows for the generation of measurable displacements in tissue samples on rigid substrates with thickness values down to 500 µm. Impulse-like and longer duration sine-modulated ARF pulses are possible with intermittent M-mode data acquisition for displacement tracking. The operations of the ARF and imaging transducers are strictly synchronized using an integrated system for arbitrary waveform generation and data capture with a shared timebase. This allows for virtually jitter-free pulse-echo data well suited for correlation-based speckle tracking. With this technique we could faithfully capture the entire dynamics of the tissue axial deformation at pulse-repetition frequency values up to 10 kHz. Spatio-temporal maps of tissue displacements in response to a variety of modulated ARF beams were produced in tissue-mimicking elastography phantoms on rigid substrates. The frequency response was measured for phantoms with different modulus and thickness values. The frequency response exhibited resonant behavior with the resonance frequency being inversely proportional to the sample thickness. This resonant behavior can be used in obtaining high-contrast imaging using magnitude and phase response to sinusoidally modulated ARF beams. Furthermore, a second order forced harmonic oscillator (FHO) model was shown to capture this resonant behavior. Based on the FHO model, we used the extended Kalman filter (EKF) for tracking the apparent modulus and viscosity of samples subjected to dc and sinusoidally modulated ARF. The results show that the stiffness (apparent modulus) term in the FHO is largely time-invariant and can be estimated robustly using the EKF. On the other hand, the damping (apparent viscosity) is time varying. These findings were confirmed by comparing the magnitude response of the FHO (with parameters obtained using the EKF) with the measured ones for different thin tissue constructs.
I. INTRODUCTION
Several research groups have investigated the tissue response to external focused beams using magnetic resonance imaging (MRI) [1], [2] and ultrasonic methods [3], [4]. Other groups investigated the tissue response to (quasi-)static [5]–[9] or low frequency vibrations [10]–[13]. More recently, a supersonic shear imaging (SSI) method for measuring the viscoelastic properties of tissue was introduced [14]. This method employs a sequence of acoustic radiation force (ARF) beams progressively focused at a set of points along a predetermined path so that their corresponding shear waves interfere constructively to generate high-amplitude plane shear waves in soft tissue media. This allows for the generation of uniform displacements throughout the region of interest (ROI). Combined with high frame rate image acquisition and inverse solution of the shear wave propagation, a reconstruction of the viscoelastic properties of the tissue in the ROI is possible. Each of the methods mentioned here has its advantages for certain imaging applications, but the SSI appears to be the most general at the expense of high-end performance of the imaging system and the need for solving a potentially ill-posed inverse problem. To date, no inverse solution has been demonstrated to produce quantitative values of both moduli and viscosity parameters in tissue media. This has been attributed to the lack of accurate constitutive models for viscoelastic tissue response. In addition, observations of tissue response at points removed from the ARF application point are potentially complicated by dispersion and/or multiple reflections in the presence of nearby boundary conditions [15]. Measurement of transient response at or in the immediate vicinity of the ARF application point remains one of the most promising tools for robust identification of the underlying constitutive model.
We are currently investigating two potential applications of ARF-based viscoelastic tissue property measurement. These involve the interrogation of thin tissue constructs on rigid substrates. In the first application, the maturation of tissue-engineered constructs grown in vitro can be noninvasively and nondestructively studied. Current characterization methods require harvest and destructive mechanical property testing. In one approach, the growing tissue results from cell entrapment into a biopolymer gel followed by biopolymer degradation and extracellular matrix production by the cells, with the tissue being supported by a rigid surface. Model tissue constructs for screening culture conditions are grown on tissue culture polystyrene plates (e.g., [16], [17]) and bioartificial arteries [18] and heart valves [19] are grown in Teflon® molds. The thickness varies during the culture period starting in the range of 2000–4000 µm and attaining 100–300 µm, with the ultimate tensile strength increasing from xx kPA to MPa during that period. Combining high frequency ultrasound (HFUS) imaging and ARF-based viscoelastic tissue property measurement has the potential advantage of providing both structural and functional information about these tissue constructs at various stages of their growth before deployment. The second application is imaging and characterization of skin lesions in the presence of bone as a substrate. In this application, the thickness of the target tissue may range from 2–5 mm or more, but the multilayered nature of skin tissue may complicate the viscoelastic tissue property measurements. The combination of the structural imaging provided by B-mode HFUS and the ARF-based viscoelastic property measurement may prove to be very useful.
The quality of the estimation of viscoelastic properties from ARF-based methods depends on the knowledge of the local intensity of the ARF beam, which may be significantly affected by the presence of strongly reflecting boundaries at or near the focus. For example, in multilayered absorbing media, two types of radiation forces occur: one due to reflections at the boundaries and the other due to local absorption of the ARF beam. B-mode HFUS may provide structural information that could be used in modeling and predicting the ARF beam profile in the presence of these boundaries. The accuracy of this prediction depends on the accurate knowledge of the reflection coefficients at the boundaries. In addition, uncertainties in the ARF beam intensity profile in the ROI may result from aberrations in the speed of sound (beam defocusing) and variations in local absorption values. These uncertainties represent a process noise that may affect the dynamics of the viscoelastic response at the target.
Tissue displacements are typically estimated using speckle tracking methods, which are subject to errors from low SNR and decorrelation of the RF echo signals [20], [21]. Additional jitter in the speckle tracking displacement estimation may result from tissue deformation due to highly focused ARF beams [22]. The jitter in displacement estimation (observation noise) may mask some of the dynamics of the viscoelastic response. This noise source can be severe, especially if the intensity of the ARF beam is subject to the U.S. Food and Drug Administration (FDA) limits on mechanical index (MI) and peak and average spatial peak intensities, ISPPA and ISPTA, respectively [23].
The Kalman filter is well suited to address the process and observation noise sources mentioned. It can be used in filtering, prediction, and smoothing of data generated by dynamic systems subject to process and observation noises [24]. Furthermore, if the underlying dynamic (state) model of the viscoelastic response is accurate, the parameter values of the model can be estimated using the extended Kalman filter (EKF). The EKF formulation allows for on-line (sample-by-sample) state estimation and parameter tracking. Therefore, with the EKF, the transient viscoelastic response of the tissue upon application and release of the ARF becomes an asset rather than a liability. This paper describes a model-based approach for measuring the viscoelastic properties of tissue constructs subject to localized ARF application. Our approach is founded on the following bases:
The use of a large-aperture, highly focused (f# = 0.65) transducer capable of localizing the ARF source in a cigar-shaped volume with diameter of 187 µm and height of 908 µm (measured 3-dB dimensions). This tight focus may be necessary to minimize the deleterious effects of nearby boundary conditions on the shape of the ARF beam. In addition, the viscoelastic response to a highly localized ARF source may be less sensitive to inhomogeneities in the viscoelastic properties of the surrounding tissue.
High-quality, uninterrupted estimation of the transient response (displacement/strain) to the ARF beam before, during, and after its application. The temporal profile of the pushing beam intensity will be controlled precisely to achieve predictable and repeatable tissue response in the interrogation volume.
The use of the EKF approach for on-line estimation of the underlying viscoelastic model parameters. This dynamic, nonlinear model is not only useful for real-time implementation, but it can also account for the dynamics of the tissue under other force fields, e.g., breathing or the presence of nearby pulsating blood vessels, etc.
It must be mentioned that the parameter estimation through the EKF depends on the dynamic model of the tissue response (i.e., constitutive viscoelastic model). Commonly used constitutive models (e.g., Maxwell, Voigt, and Kelvin) are idealizations and do not directly apply to real tissue [25]. This is still an open research question and it is outside the scope of this paper. To demonstrate the use of EKF in parameter estimation, we model the tissue response to the ARF as a forced harmonic oscillator (FHO). This model results from the constitutive models by adding an inertia (mass) term. In addition, its use is motivated by the observed underdamped displacement response in thin tissue constructs. The use of this model allows us to demonstrate the convergence properties of the EKF in tracking observed data (filtering and state estimation) and model parameters.
II. MATERIALS AND METHODS
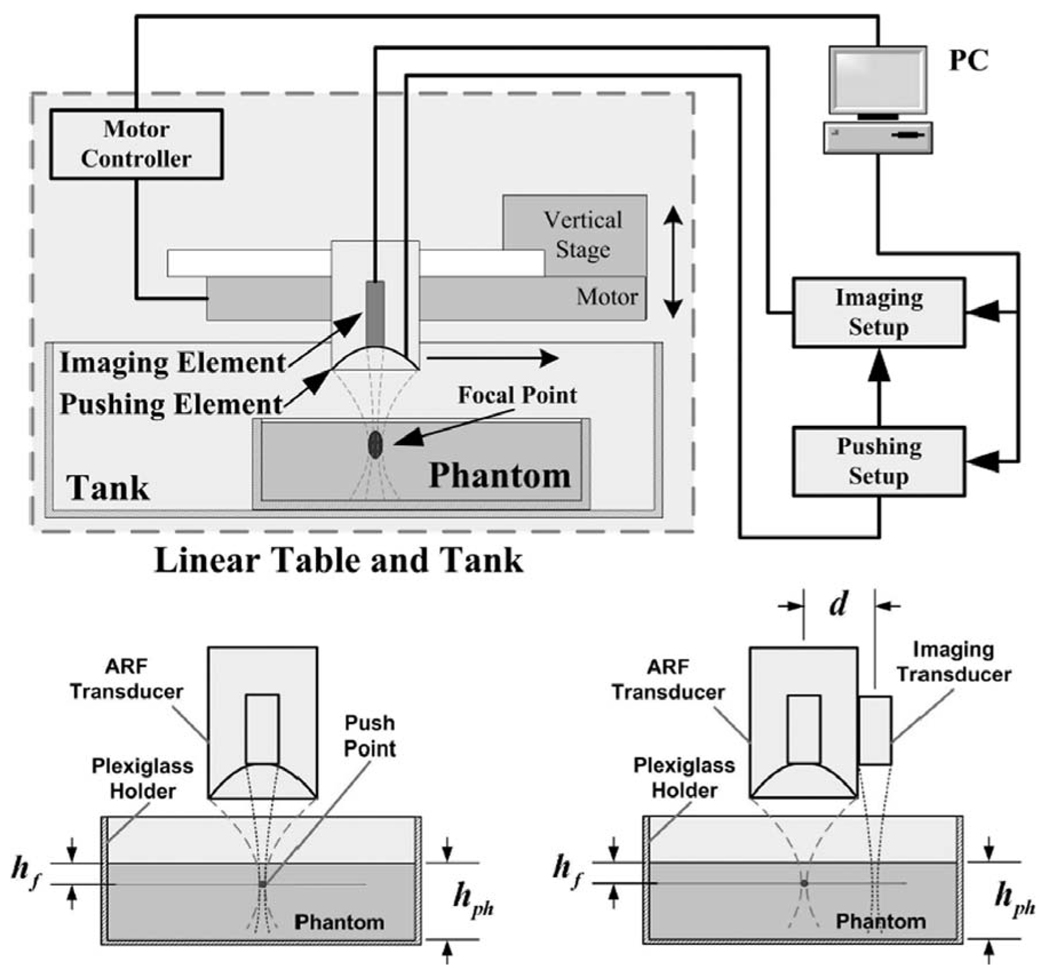
The imaging setup shown in Fig. 1 was used for measuring the viscoelastic properties of thin tissue constructs. It employs a mechanically scanned transducer for ARF generation in the target tissue and an imaging transducer for collecting RF data in M-mode before, during, and after the ARF pulse generation. A two-channel arbitrary waveform generator is used to drive both transducers synchronously. The waveform generator shares its timebase with the digitizer used for collecting echo data from the imaging transducer. This integrated dual-element system minimized the sampling clock jitter and allowed the routine tracking of submicron tissue displacements.
Fig. 1.
Top: Imaging setup using the integrated dual-element transducer for viscoelastic tissue measurements. The phantom is positioned in a Plexiglas® container that provides the rigid substrate distal to the focal point of the ARF beam. Bottom: Two measurement configurations used for displacement tracking along the axis of the ARF beam (left) and along a line at d = 16 mm from the ARF beam axis (right). The latter configuration was used for verification of shear wave generation in the phantoms (Section II-C,3).
A. Imaging Targets
Experiments were performed on elastography phantoms fabricated from gelatin, graphite, water, and glutaraldehyde in quantities as suggested in [4] and using the procedure outlined in [26]. Two types of phantoms with reported Young’s modulus values of 0.5 and 1.6 kPa were tested [4]. As per [4], we refer to these phantoms as medium (0.5 kPa) and stiff (1.6 kPa). We estimated the Young’s modulus values for the medium and stiff phantoms using the experimental procedure outlined in [26]. Typical Young’s modulus values were measured at 3.6 and 7.7 kPa for the medium and stiff phantoms, respectively. We note here that the authors of both [4] and [26] have expressed reservations regarding the accuracy of making modulus measurements in phantoms with low Young’s modulus values. For the purposes of this paper, however, the contrast between the two phantoms used is more important than their actual modulus values.
The acoustic properties of the phantoms were measured using transmission-mode ultrasound on 1-mm-thick samples. Sample thickness was measured in water using a digital caliper (Digimatic; Mitutoyo Corp., Kawasaki, Kanagawa, Japan) with 0.01-mm precision. We used a pair of polyvinylidene fluoride (PVDF) transducers with center frequencies of 25 MHz and 100% fractional bandwidths. The two phantoms have approximately the same density of 1100 kg/m3. The speed of sound was measured to be 1518 m/s for both phantoms (T = 20.5°C, with the speed of sound in water equal to 1492 m/s). The attenuation was measured to be 0.36 and 0.45 dB/MHz/cm for the medium and stiff phantoms, respectively.
B. Imaging System
1. Instrumentation
An HFUS imaging system employing a 2-stage rectilinear servo motor with a single-element high frequency transducer was built and is currently available in our laboratory. The core system is a Virtex2Pro field programmable gate array (FPGA) (XC2VP30; Xilinx Inc., San Jose, CA) which can generate control signals and perform data transactions between the external high speed A/D (AD9430; Analog Devices, Inc. (ADI), Boston, MA) and D/A (AD9777; ADI) devices. Two arbitrary waveform generators are implemented using FPGA fabrics and external D/A: one for chirp signal generation (to drive the imaging transducer) and the other for modulated sinusoidal signal generation (to drive the ARF transducer). A high-speed data capture unit is also employed, which can acquire data with a sampling rate of either 125 mega samples per second (MSPS) (for B-mode) or 200 MSPS (for M-mode). The architecture of the system is described in more detail in [27].
2. Image Formation
As an image-guided characterization system for thin tissue samples, the system has complete support for high frequency (up to 40 MHz) B-mode and M-mode ultrasound imaging. A typical B-mode image is formed from 400 A-lines with spacing of 0.05 mm. The output of the motor optical encoder is tapped and decoded by the FPGA to generate the trigger for the internal chirp generator and data acquisition unit to capture the data from the region of interest (typically 5–20 mm from the transducer).
We decided to use coded excitation as a default mode for imaging with our PVDF transducer. Coded excitation using elongated waveforms with good compression properties can significantly improve the SNR of received echoes [28]. In addition, it effectively suppresses reverberations due to the concave structure of ARF transducer, which were found to be quite significant. Acquired data were first compressed using a matched filter to boost the SNR and achieve similar resolution as pulse/echo imaging. B-mode images were formed by applying standard envelope detection and logarithmic compression without time-gain compensation.
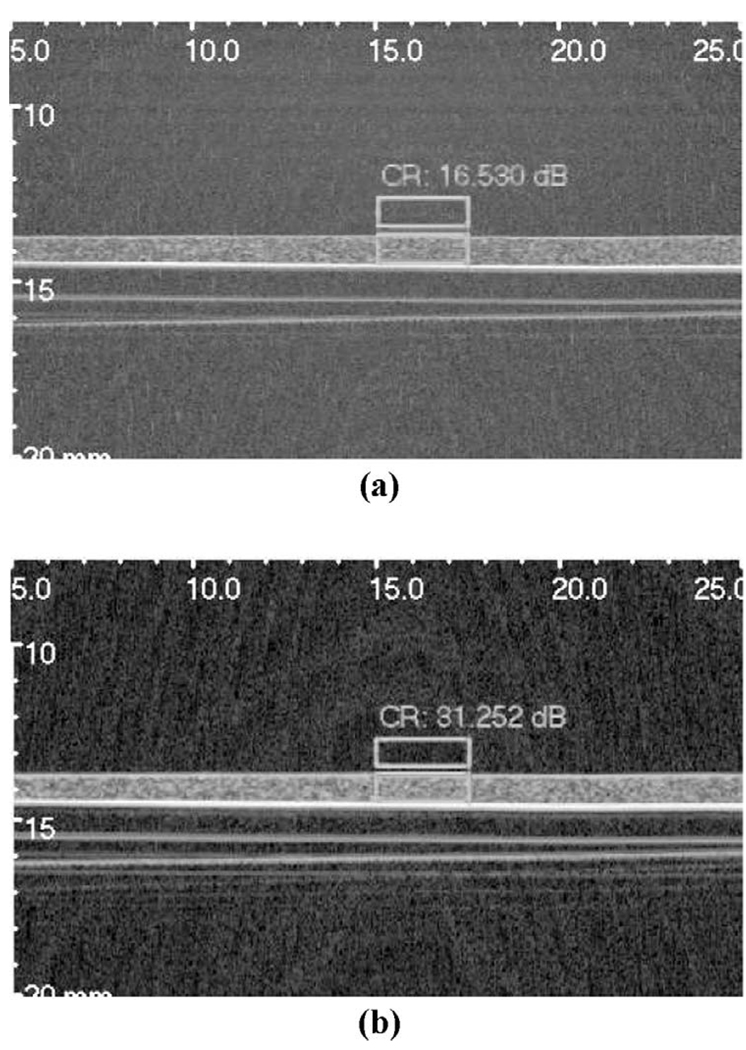
Fig. 2 demonstrates the improvement in image quality due to the use of chirp excitation, as opposed to conventional pulse-echo imaging. Fig. 2(a) was acquired using conventional pulse-echo while Fig. 2(b) was acquired using a 4-µs linear chirp with a Gaussian envelope centered at 22.5 MHz with 100% fractional bandwidth. The 72-dB grayscale images, showing a 1-mm-thick phantom on a Plexiglas substrate, clearly demonstrate the improved dynamic range of the image acquired using chirp excitation compared to the conventional pulse-echo image. In addition, the contrast ratio (CR) between tissue and water was evaluated for each image according to
| (1) |
where Iph and Iw refer to the average intensities in phantom and water (boxed regions), respectively. The CR was measured to be 16.5 and 31.2 dB for the conventional pulse-echo and chirp images, respectively.
Fig. 2.
Grayscale images (72 dB) of a 1-mm-thick phantom on a Plexiglas substrate obtained using the 25-MHz PVDF transducer: (a) conventional pulse-echo, and (b) chirp excitation. Boxes indicate regions used for contrast calculations. Axes are labeled in mm.
3. Motion Tracking
M-mode imaging data are used for motion tracking. In this mode, all A-lines are acquired at the same location by using a high pulse-repetition frequency (PRF; typically 10 kHz) to capture the tissue deformation dynamics. A clock synthesizer in the FPGA is responsible for generating synchronized clock for the D/A input update (100 MHz) and A/D capture (200 MHz); the A/D gate control is also embedded into the chirp generation unit to minimize the sampling jitter. These design techniques can effectively bring the sampling jitter down to the order of picoseconds. M-mode data are used in displacement tracking according to 1D version of the speckle tracking algorithm described in [29].
We used two types of excitation for the ARF generation: ARF impulse (ARFI [4], [30]) and sine-modulated continuous waveform. For data acquired with sine-modulated ARF beams, a digital in-phase quadrature (I–Q) demodulator was used to extract the magnitude and phase of the computed displacement data.
C. Acoustic Radiation Force
1. ARF Beam Characterization
Acoustic radiation force is caused by transfer of momentum from the acoustic wave to the propagation medium. In a homogeneous unbounded attenuating medium (attenuation of acoustic wave is mainly due to absorption [31]), a focused beam produces an acoustic radiation force (body force) given by [4]
| (2) |
where c is the speed of sound in the medium, α is the absorption coefficient of the phantom, and I is the temporal average intensity of the acoustic beam. Depending on the degree of focusing of the ARF beam, F could generate both compressional and shear displacements in the attenuating medium. In the presence of boundary conditions, radiation pressure at the boundary produces a net force [32], [33]
| (3) |
where the subscripts 1 and 2 refer to side 1 (source) and side 2 of the reflecting boundary, and A is the cross-sectional area of the beam. The reflection coefficient, R, accounts for the multilayer structure of the imaged medium [32]. For multilayer structures interrogated with axisymmetric beams, the radiation forces can be estimated by using a Fourier decomposition of the axial and lateral components of the ARF beam and enforcing the appropriate boundary conditions as described in [33].
A focused beam placed at or just below a free reflecting surface produces a mixture of the two forces given above. Note that the force, F, in (2) is always in the direction of the acoustic beam while Fnet in (3) may be positive or negative with respect to the beam’s propagation direction. This is determined by the specific values of c and ρ for the two media on both sides of the interface. In addition, the presence of a rigid substrate under the pushing beam modifies the radiation force to satisfy the boundary conditions at the substrate. This puts a limit on the proximity of the focal point to the rigid substrate. The lower the f#, the closer the interrogation point to the substrate. This is the motivation for choosing a 5-MHz ARF transducer with f# = 0.65 for this study. It allows us to bring the focal point within 0.5 mm from a rigid surface (e.g., when imaging skin over bone).
The radiation pressure force component given in (3) is proportional to the acoustic power in the beam. The output acoustic power was measured with an ultrasound power meter (Ohmic Model UPM-DT-100AV; Ohmic Instruments Co., Easton, MD).
2. ARF Beam Generation
The carrier signal is digitally generated by a direct digital synthesizer (DDS) in the FPGA fabric. The 5-MHz carrier signal and the modulation signal are then fed into a digital multiplier to generate the modulated output. An external D/A is employed to convert the digital stream into analog signal.
Note that for the digital multiplier, there is an additional input called silencing control. While this signal is active, the ARF beam will be completely suppressed. The reason for this design is that the high-intensity ARF beam will generate strong interference on the M-mode imaging data acquisition, which renders the tracking impossible during the force application. The silencing control function features a nicely designed synchronization mechanism that enables reliable tracking during ARF application by briefly (30 µs) silencing the pushing beam while the single A-line interrogation is performed. PRF values as high as 10 kHz could be used while still achieving a duty cycle of 70%. Arbitrary modulation waveforms (e.g., step function, impulse function, white Gaussian noise) with duration up to 204 ms can be generated (limited by waveform memory). For sine modulation, the duration of the pushing beam can be up to a several seconds (limited by acquisition memory).
3. Remote Detection of Shear Waves
A crude experimental verification of shear wave generation in our phantoms was made by attaching a 25-MHz PVDF transducer (6-mm diameter and f# = 2) on the outside of the ARF transducer with the axis of the imaging transducer in parallel to that of the ARF transducer. The distance between the two axes was approximately 16 mm. This was dictated by the geometry of the highly focused ARF transducer and the current setup. This setup is shown in the lower right corner of Fig. 1 with hph = 11 mm, hf = 1.1 mm, and d = 16 mm. Two-cycle ARF pulses were used and the first arrival time was recorded for each ARF pulse. The measured displacements were extremely small, but measurable, with peak-to-peak values on the order of ± 250 nm. The average delay was measured to be 16.5 ms for the medium phantom and 10.5 ms for the stiff phantom. These measurements resulted in estimated shear velocity values of 0.97 and 1.52 m/s for the medium and stiff phantoms, respectively. Using (ρ is the density and cs is the shear velocity), the shear modulus values were estimated to be 1.034 and 2.554 kPa for the medium and stiff phantoms, respectively. Assuming a Poisson’s ratio of approximately 0.5, the Young’s modulus values are 3.10 and 7.66 kPa for the medium and stiff phantoms, respectively. These values are more in line with the stress test measurement suggested by Hall et al. [26]. Similar measurements were attempted in the thin samples (hph ≈ 1 mm), but significant dispersion was observed and the variability in the earliest time of arrival was too large to allow reliable measurements of the shear velocity.
D. Estimation of Viscoelastic Tissue Properties
1. Dynamic Model
Tissue displacement in response to focused ultrasonic beams have been measured by a number of research groups and have been shown to generally agree with the Voigt model for very soft tissue [3]. For stiffer tissue with finite thickness backed by a rigid substrate, a second-order model provides a better fit of an apparent underdamped behavior in terms of tissue displacement near the focus of the pushing beam. We have observed this underdamped behavior in thin viscoelastic constructs similar to those described in this paper. Given the uncertainty in the forcing function (due to unknown attenuation, beam distortion, etc.), we use the standard forced harmonic oscillator with process noise, w(t):
| (4) |
where is the undamped natural frequency of the oscillator and ξ = η/2Mω0 is the damping coefficient. The parameters K and η are related to the stiffness and viscosity of the tissue, respectively. The mass, M, is estimated by
| (5) |
where Vf is the tissue volume affected by the ARF beam. In (4), the force function, Fz(t), is determined by both the body force resulting from local absorption of the focused ARF beam and stress forces due to the radiation pressure at the boundaries. This is a result of the balance of linear momentum in the volume affected by the ARF beam [34]. In the case of a thin tissue construct on a rigid substrate at z = zs, F(zs, t) ≈ 0 results in a reduction of the body force calculated by (2). This reduction can be predicted by invoking image theory. For example, if the ARF beam is positioned so that the focal point is at the water/tissue interface, Fz(t) can be given by
| (6) |
where Vf is the volume of the focal spot of the ARF beam within the absorbing medium and Fnet is given by (3). The second term on the right-hand side accounts for the rigid substrate at z = zs, where F(z, t) is given by (2).
Eqs. (5) and (6) allow the use of the lumped-parameter model proposed by (4) by defining the forcing function on the right-hand side. It should be noted, however, that the underlying model is the 3D Navier-Stokes equation, which accounts for the compressional and shear response to the focused ARF beam. A faithful representation of this model requires multiple observation points in the axial and lateral dimensions. For thin tissue constructs on rigid substrates, (4) could still be used, but with an appropriate interpretation of both the force term and the coefficients on the left-hand side. For example, the total force in (6) is divided by the mass term from (5) to produce an effective force causing surface indentation (and tissue strain). This has been reported extensively in the indentation literature [35], where the effective or apparent modulus of the tissue/substrate is estimated from the indentation depth. Formulas relating the effective modulus to the true modulus of a thin tissue construct can be developed from integral equations accounting for the pressure field produced by the indenter and the thickness of the sample [35]. For the dual-element transducer system described in this paper, it is possible to estimate Fz(t) from knowledge of the geometry and acoustic power output of the ARF transducer together with the boundaries and approximate acoustic properties of the target tissue. The B-mode imaging capabilities of the system can be used to place the ARF beam focus with respect to the substrate and determine the geometry needed to evaluate the integral in (6). For example, for homogeneous thin tissue constructs, this could be accomplished by identifying and localizing the water/target interface (free surface) and the target/substrate interface to determine the geometry. Using measured acoustic properties of the phantom and substrate, it is possible to compute the ARF beam in the phantom and interfaces to provide an estimate of Fz(t) as given in (6).
The process noise, w(t), accounts for uncertainty in the ARF applied (e.g., due to imperfect knowledge of acoustic properties, beam distortion, etc.) as well as forces contributing to the model where an appropriate stochastic model can be assumed (e.g., breathing effects or a nearby pulsating blood vessel). The Kalman filter formulation described below accounts for this type of process noise as well as observation or measurement noise due to errors in the displacement estimation algorithm, which has been described by several authors [20], [21], [36].
2. State Variable Representation and the Extended Kalman Filter
Eq. (4) can be presented in state variable form by defining the state variables q1 = uz and q2 = duz/dt. This allows us to rewrite the input to state equations (note: q̇ = dq/dt.):
| (7) |
The output equation is simply uz = q1 + v(t), where v(t) is the observation noise. The state equations can be written in matrix form:
| (8) |
| (9) |
where the matrices and vectors given in bold are as defined. In (9), the observation noise results from the speckle-tracking algorithm used. The statistics of this error can be estimated from locally measured figures-of-merit proposed in the recent literature, e.g., [20], [21], [36].
Having defined the state-variable model for the system, it is now possible to develop the Kalman filter algorithm, given the system model together with the statistics of the process and the observation noise [24]. This, however, requires knowledge of the parameters ω0 and ξ, which is not available. This problem can be addressed by the use of the EKF, which defines a nonlinear system in terms of the original state variables, q1 and q2, as defined above, and two additional state variables representing the unknowns, q3 = ω0 and q4 = ξ. This results in a new set of input-to-state equations:
| (10) |
Note that the equations for q̇3 and q̇4 reflect the fact that we are treating the unknown parameters as time-invariant, i.e., these are not trivial equations. Note also that, in reality, the tracked parameters may or may not be time-invariant. This does not represent a fundamental problem as long as the convergence time of the EKF is much smaller than the rate of change in these quantities. Fortunately, both the rate and the quality of the convergence of the EKF can be characterized during on-line tracking. It is now possible to give the extended Kalman filter equations for the problem at hand.
Nonlinear dynamic model:
| (11) |
| (12) |
where f(·) is a nonlinear function obtained from (10) with q = [q1 q2 q3 q4]T ,𝒩 (mean, cov) indicates normal distribution, and Q is the covariance matrix of w.
Observation model:
| (13) |
| (14) |
where R is the covariance of v.
Implementation:
State estimation:
| (15) |
Predicted measurement:
| (16) |
Linear approximation equations:
| (17) |
| (18) |
| (19) |
Kalman gain equations:
| (20) |
| (21) |
The Kalman gain vector K̅ is responsible for updating the values of ω0 and ξ in addition to the original state variables. In this case, it is a 4 × 1 vector with entries determined by the observation noise covariance and the error covariance matrix, P. The latter converges to a final value according to the matrix Riccati differential equation (20). The final entries of the error covariance matrix provide a measure of uncertainty in the final estimate of the state vector. That is, it provides a figure-of-merit describing the performance of the Kalman filter in both state and parameter estimation. Typically, the trace of the matrix P is used as the performance or quality measure for the convergence of the algorithm. It is also common to use the diagonal elements of P to characterize the convergence of the individual state variables in the model. These issues are thoroughly analyzed in many classical references on the subject [37], [38]. The linearization of (10) given in (17) is a necessary step in the EKF implementation. Its consequences are discussed in the next subsection.
3. Computational Considerations
Due to the linearization step in (17), we have used a continuous-discrete computational model in the implementation of the EKF algorithm. A fourth-order Runge-Kutta method with 32 steps between observations was used for integration of the state equations of the nonlinear model in (11). Eq. (4) was normalized so that the unit time was equal to the sample time, ΔT = 1/PRF. This normalization scales ω0 on the left-hand side of (4) by ΔT and the force terms on the right-hand side by (ΔT)2. Under this normalization, (4) can be written in the form
| (22) |
where
The force terms in (22) are given in units of length and the natural frequency is given in radians.
III. RESULTS
B-mode images of the target tissue structures are used for guiding the placement of the ARF beam based on identification of the rigid substrate. The objective is to achieve the highest possible SNR for the displacement estimates while maintaining the peak focal intensity of the ARF beam within the diagnostic mechanical and thermal indexes [23].
A. Image Guidance
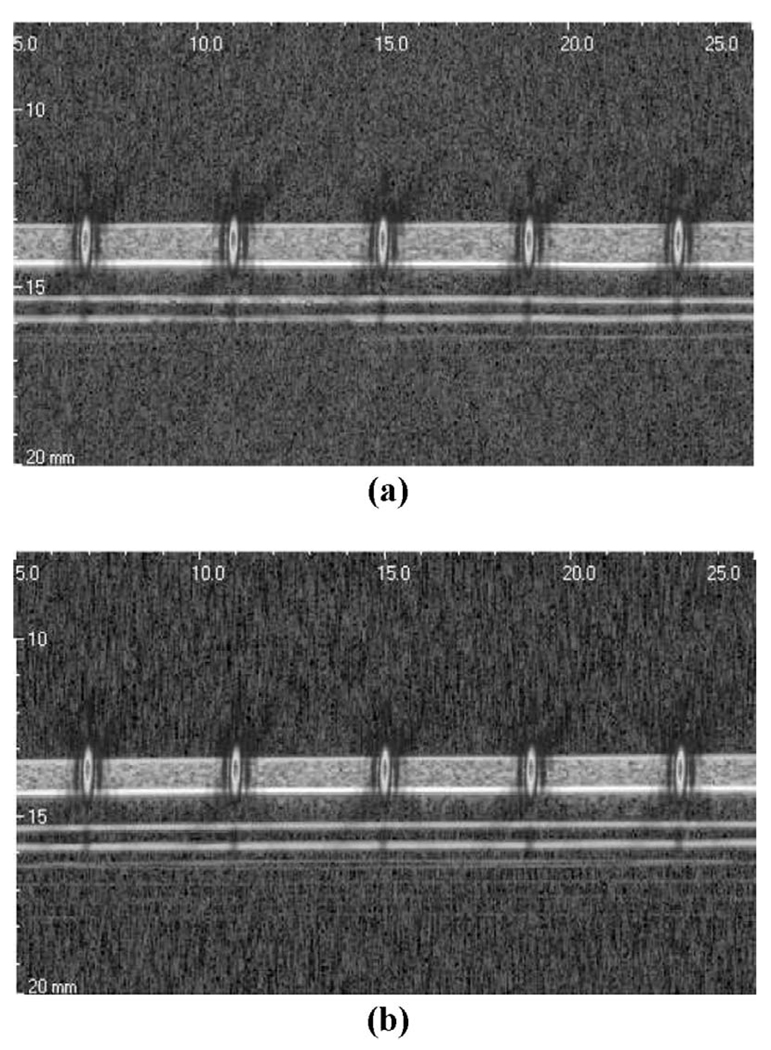
Fig. 3 shows the guidance images for the medium and stiff thin layer phantoms. The average thickness values of the phantoms were measured in water at 1.0 and 0.8 mm for the medium and stiff phantoms, respectively. With the assistance of these B-mode images, we placed the ARF beam focus on the surface of the phantom. To illustrate this point, the measured intensity profile for the ARF beam is overlaid on the grayscale images at the locations of the pushing points. For these experiments, the focal point was placed just slightly below the free surface in both phantoms. Similar results can be obtained for ARF beam placement below the surface as long as the focal point remains more than 500 µm (1/2 the depth of field of the ARF beam) above the Plexiglas. If the focal point is placed closer to the substrate, significant reduction of the ARF results. This reduces the quality of displacement tracking and potentially reduces the contrast in displacement due to the soft tissue samples in the presence of the rigid substrate.
Fig. 3.
Image-guided placement of the ARF beams in thin tissue constructs: (a) guidance image for the medium phantom, and (b) guidance image for the stiff phantom. The intensity profiles (PSFs) of the ARF beams at the pushing locations are overlaid to scale.
B. Acoustic Radiation Force Impulse Experiment
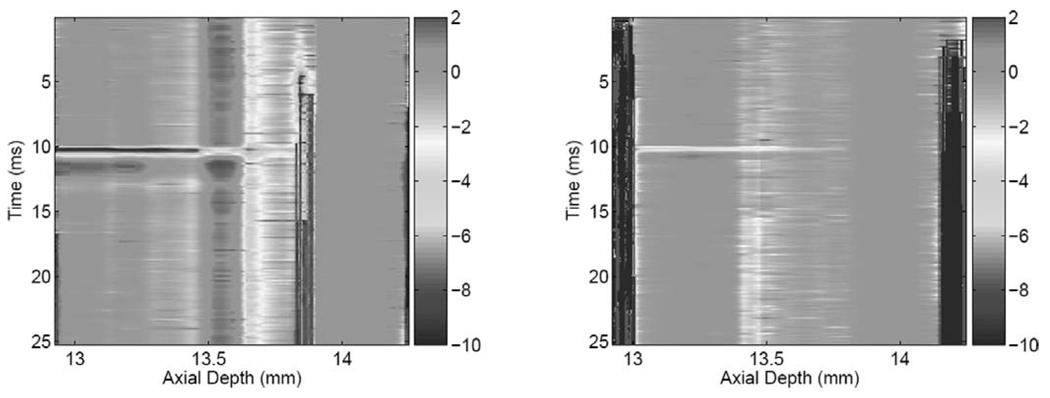
The acoustic radiation force impulse (ARFI) results were acquired by applying a 300-µs pushing beam with maximum intensity of 400W/cm2. Shorter-duration ARFI pulses are possible, but we wanted to achieve acceptable displacement SNR and sample the displacement during the application of the ARF (3 samples at a PRF = 10 kHz). For each experiment, displacement tracking begins 2 ms before the application of the ARFI beam and continues for a total duration of 15 ms (only 12-ms duration shown). Fig. 4 shows the spatio-temporalmaps of tissue response to the ARFI excitation for the medium (left) and stiff (right) phantom, respectively. The focal point of the ARF beam was placed at 13.4 mm in both cases, which is 0.5 mm from the Plexiglas surface at 13.9 mm. It is interesting to note that the deformation exhibits different strain levels in two distinct regions:
A low-strain region extending from the top of the phantom to just below the focal point (13.2–13.6 mm).
A higher-strain region extending from just below the focal point to the surface of the Plexiglas (13.6–13.9 mm).
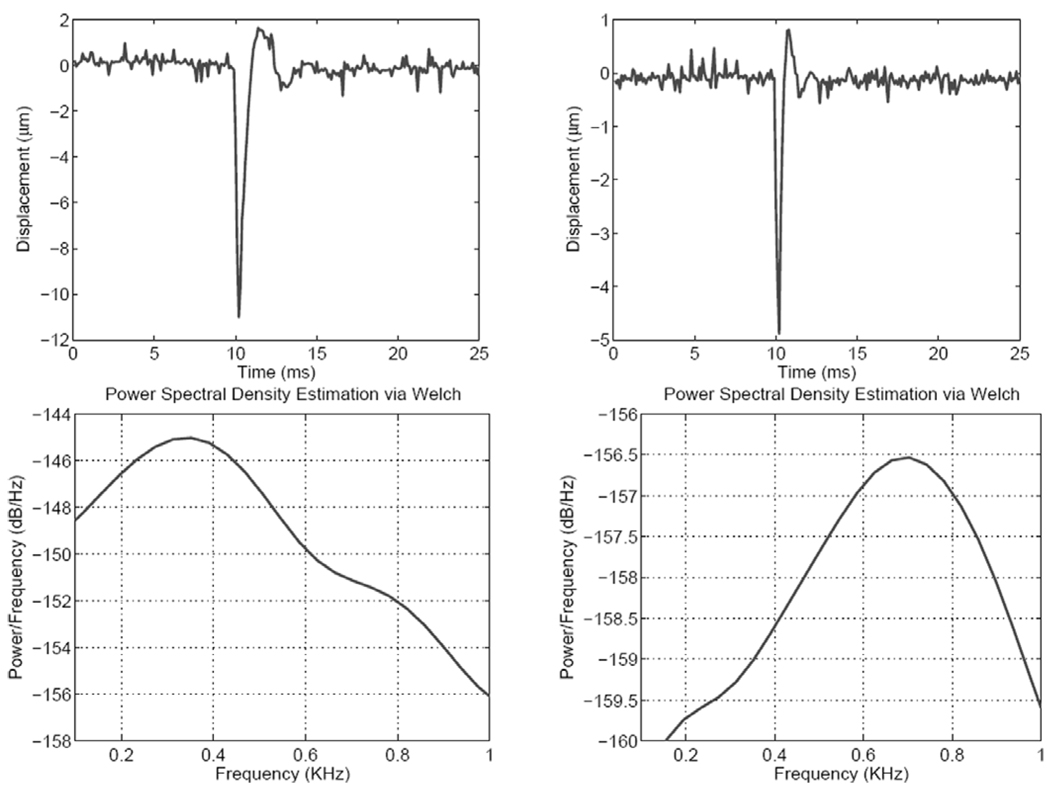
These characteristics are common to both the medium and the stiff phantoms. The temporal response, on the other hand, shows marked differences in the duration and the nature of recovery after removal of the ARFI beam. This is illustrated in Fig. 5, which shows the temporal responses at the focal point (top two panels) and the corresponding power spectral densities for both phantoms. One can see clearly the faster response of the stiff phantom compared to that of the medium phantom, as expected. The decay oscillations observed in the ARFI response for both phantom stiffness values justify the choice of the forced harmonic oscillator for modeling the dynamic response of thin tissue constructs.
Fig. 4.
Spatio-temporal displacement (µm) response to ARFI excitation. Left: medium phantom; right: stiff phantom.
Fig. 5.
Top: Displacement profiles at the ARF beam focus in the medium (left) and stiff (right) phantoms. Bottom: Corresponding power spectral density curves using the Welch method.
C. Sinusoidal ARF Modulation
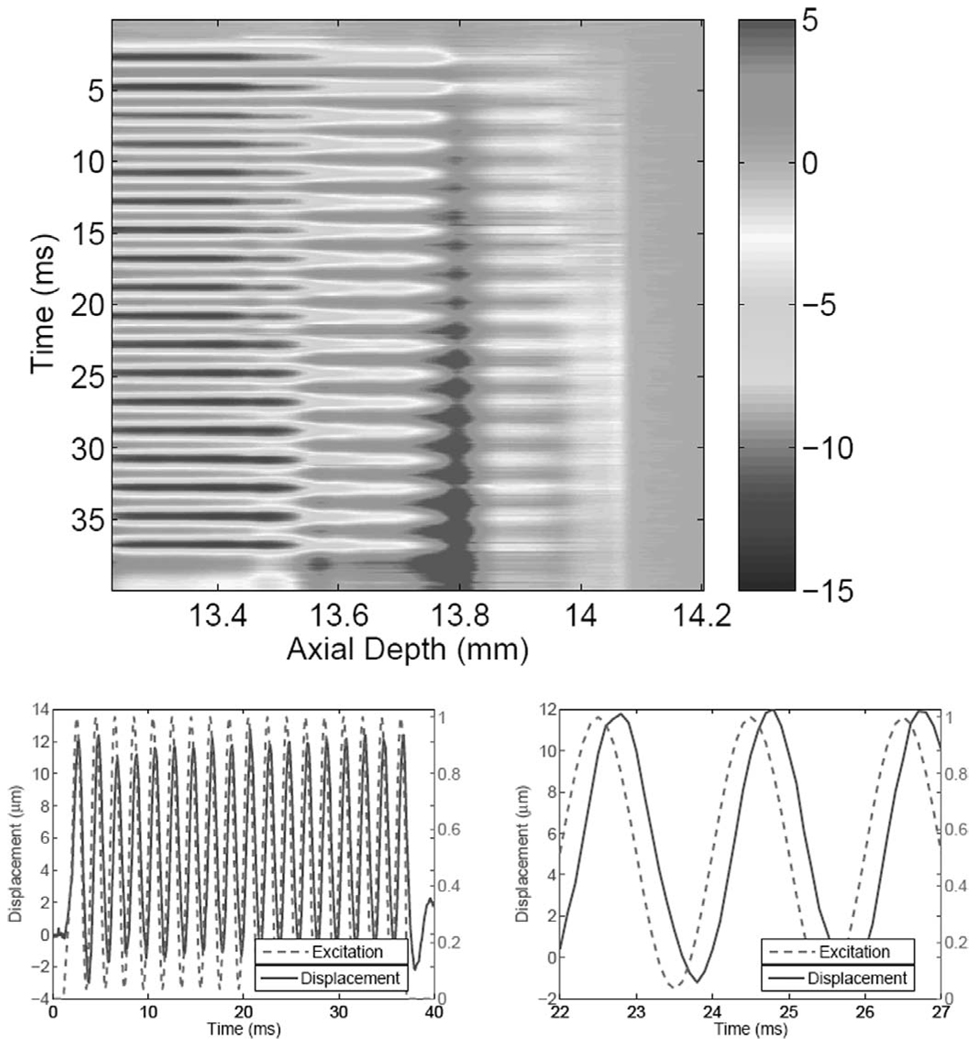
To measure the frequency response of the imaging targets, we implemented a sinusoidal modulation scheme for the 5-MHz driving signal. In this mode, 10 ms of baseline data are collected before the ARF beam is turned on. A 1-ms ramp is used to bring the ARF beam to a dc (or bias) level. This is followed by sinusoidal modulation for up to 100 ms, depending on the modulation frequency. The data collection continues (at 10 kHz PRF) for the duration of the ARF application and an additional 10-ms interval after the ARF beam is turned off. The use of the 1-ms ramp at the onset of ARF application was intended to minimize the overshoot in the transient response so that the quadrature detector would produce valid amplitude and phase estimates with minimum delay. As an example, Fig. 6 shows one result from the medium phantom with the pushing force amplitude modulated at 500 Hz with a 100% modulation index. As with the ARFI results, the spatio-temporal map shows two strain regions with respect to the ARF focal point. It is interesting to note that the high-strain region exhibits time-varying response to the sinusoidally modulated ARF while, on the other hand, the time-varying nature of the response in the low-strain region is much less pronounced. Some of this behavior can be attributed to a small temperature rise in the sample due to the relatively long duration of the ARF beam. The temperature rise in this case is very small and could not be measured reliably using available thermocouples. In a separate study [39], however, we have measured ≈ 0.5°C rise due to the use of 100-ms ARF pulses using the same transducer in the stiff phantom material.
Fig. 6.
Top: Spatio-temporal displacement map (in µm) in a thin medium phantom in response to a modulated ARF beam (500 Hz, 1-ms baseline data, 35-ms ARF excitation). Bottom-left: Normalized excitation and displacement at ARF beam focus. Bottom-right: Zoomed view to show the phase shift between the excitation and output (displacement).
The plots at the bottom of Fig. 6 show the displacement measured near the ARF focus (solid) and the normalized force (dashed). The complete history (40 ms) is shown on the left, illustrating the timing of the ARF application and observation. A 5-ms portion (from 22 to 27 ms), which represents 2.5 cycles at the modulation frequency, is shown on the right. Note the clean sinusoidal response to the ARF excitation and the precise phase relationship between the two curves. Also note that the displacement response has a dc (average) component due to the dc component of the ARF and a sinusoidal component due to the 500-Hz modulation frequency.
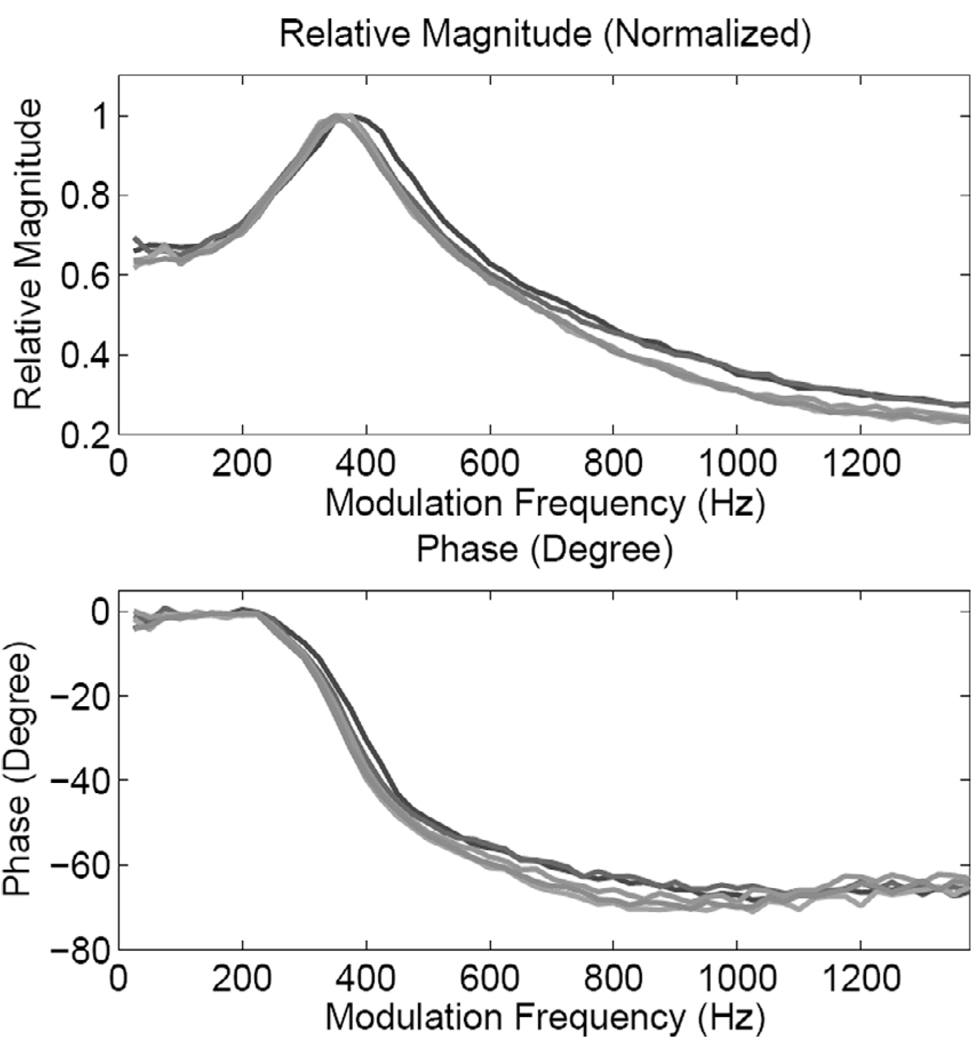
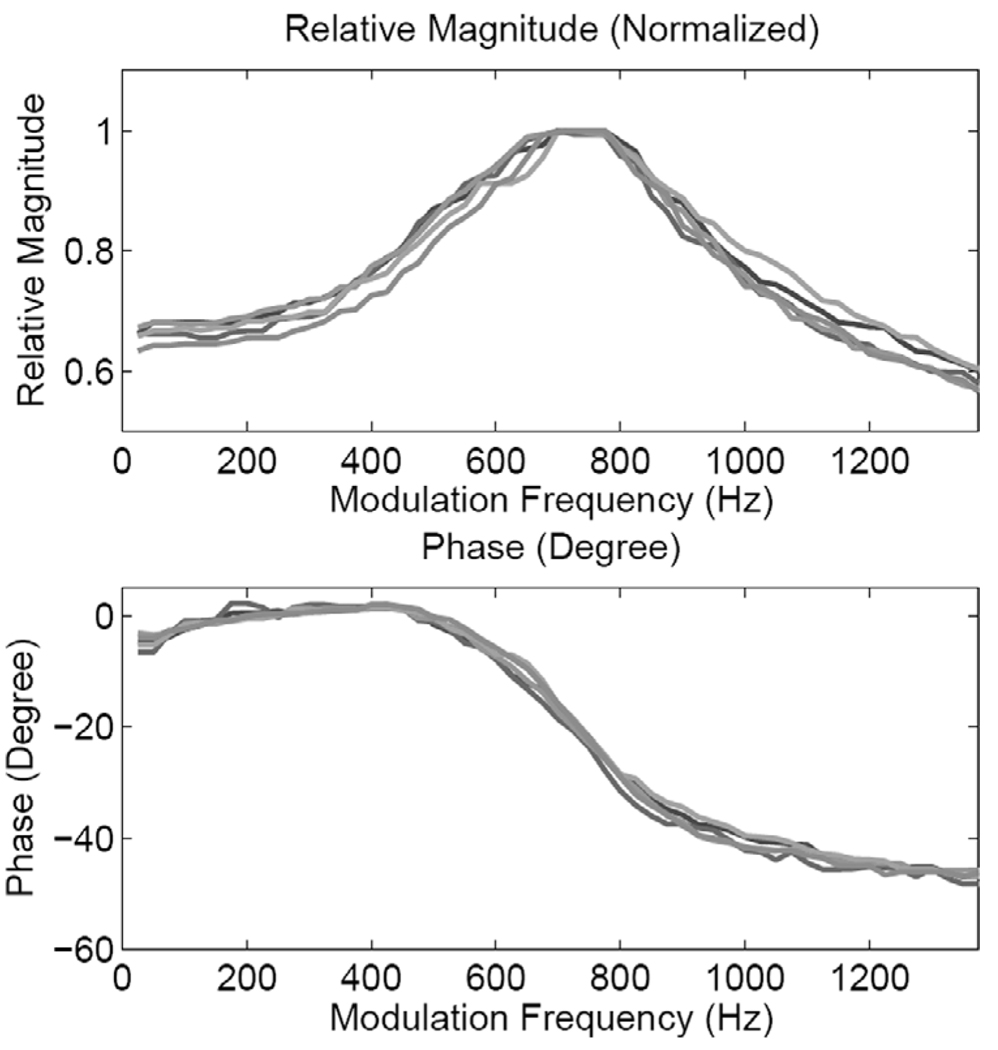
Fig. 7 shows the magnitude and phase responses from all five locations for the medium phantom. The frequency response measurements were made at values in the frequency range 25–1375 Hz (ΔF = 25 Hz). One can clearly observe the resonance characteristics (with some local variations) at all locations. A similar response is exhibited by the thin stiff phantom, as suggested by the frequency response curves shown in Fig. 8. The results suggest that the resonance frequency is determined by the thickness and stiffness of the sample being tested. In terms of (4), these results suggest that the sample stiffness modifies, where Kph is the modulus of the phantom.
Fig. 7.
Magnitude and phase responses of the medium phantom at the five pushing locations shown in Fig. 3.
Fig. 8.
Magnitude and phase responses of the stiff phantom at the five pushing locations shown in Fig. 3.
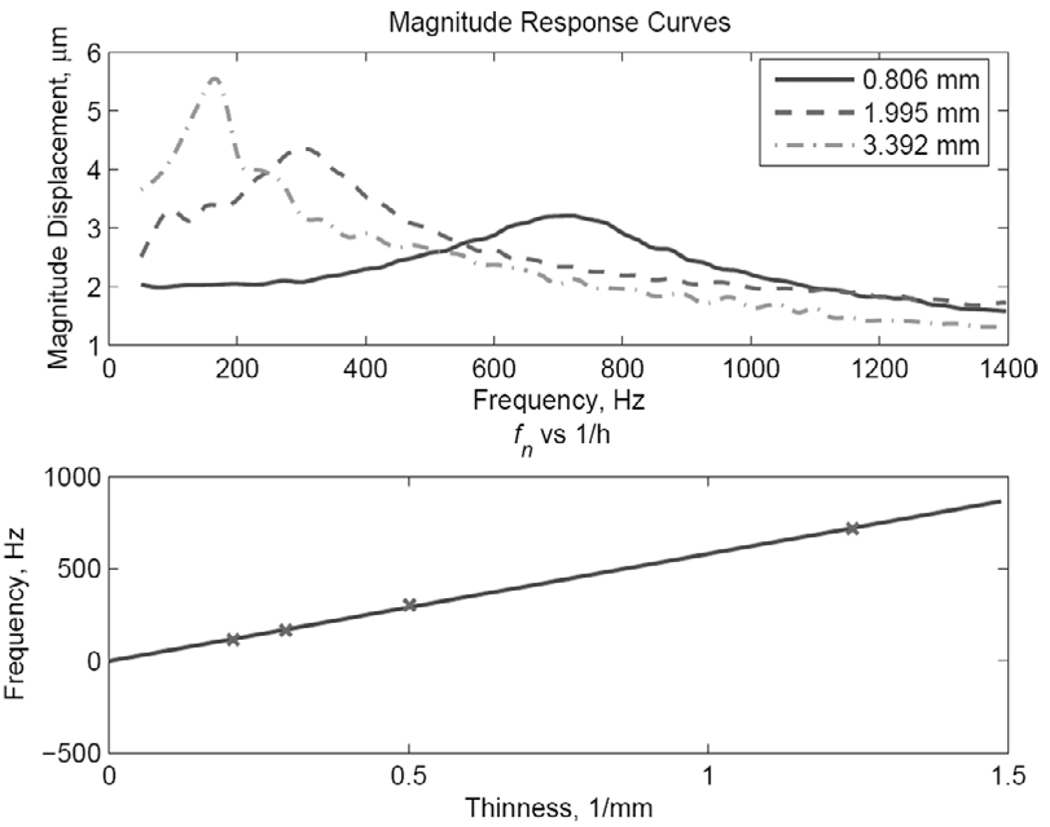
To examine the effect of the sample thickness on the resonant frequency, we generated frequency response curves in four stiff phantoms with thickness values hph = 0.806 mm, 1.995 mm, 3.392 mm, and 4.62 mm in the same frequency range used above. Three of these curves are shown in Fig. 9 (top), which clearly displays the increase in the resonance frequency with the decrease in sample thickness. This result is quantified further by plotting the peak frequency fn against 1/hph(bottom). In terms of (4),, where f0 = ω0/2π. Therefore, the relationship between the peak frequency (proportional to ω0 for small ξ) and 1/hph is as follows:
| (23) |
where f0 is given in Hz. Based on the results shown in Fig. 7 and Fig. 8 and assuming a ratio of 3 to 1 between the moduli, the constant, C, appears to be related to the square root of the modulus of the sample.
Fig. 9.
Top: Amplitude response curves for three samples of the stiff phantom with the thickness values indicated (in mm). The “x” symbols indicate the measurement frequencies. Bottom: The “x” symbols show the measured peak frequency vs. sample thickness for four (stiff) samples. The line results from a polynomial fit of the measurement points with a first-order polynomial.
The resonant behavior of the thin phantoms under ARF excitation can be clearly seen from the measured frequency responses shown in this section. This is in agreement with the ARFI results shown in Fig. 6. This resonant behavior of the phantoms lends strong support to the use of the second-order dynamic model, and, more significantly, sheds some light on the dependence of at least one of the coefficients of the differential equation on the structure and the intrinsic properties of the thin tissue construct
D. High-Contrast Imaging with Modulated ARF
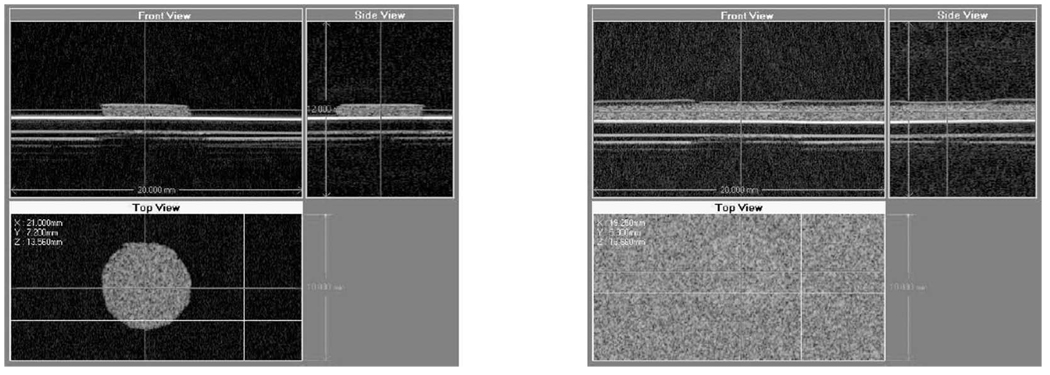
A comparison of the magnitude and phase responses of the two phantoms given in Fig. 7 and Fig. 8 shows the difference in the resonance characteristics between the two phantoms. This result suggests that a judicious selection of the modulation frequency could result in maximum contrast between the two phantoms. This is especially true for the phase response, which yields the maximum contrast at modulation frequencies in the range of 300–700 Hz (between the resonances of the two phantoms). To illustrate this idea, a 0.6-mm-thick, disk-shaped stiff inclusion was embedded in an 0.8-mm medium phantom, with the composite phantom placed on Plexiglas substrate. The images of the inclusion before and after embedding in the medium phantom material are shown in Fig. 10. Neither the B-mode nor the C-mode images of the composite phantom show any contrast between the inclusion and the background.
Fig. 10.
Orthogonal views of the inclusion before (left) and after (right) embedding in the composite phantom. In each panel, two B-mode images provide axial/lateral cross-sectional views, which are shown on the top. A C-scan through the phantom at the pushing location is shown in the bottom view.
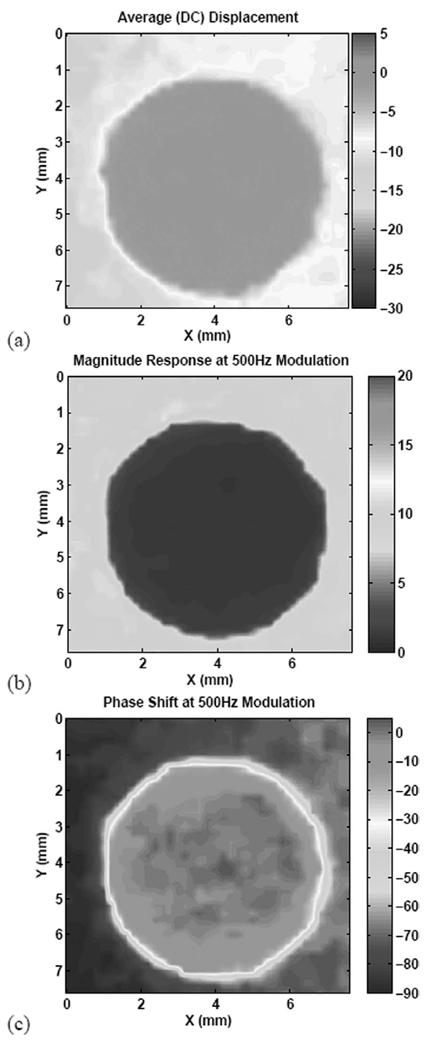
Fig. 11 shows the results of imaging the composite phantom using an amplitude-modulated ARF beam with 60% modulation index, i.e., both dc and sinusoidal ARF components are present simultaneously. The figure shows the dc response (a) together with the magnitude (b) and phase (c) responses at 500-Hz modulation. All three images produce significant contrast enhancement over the conventional ultrasound. There are some subtle differences, however, between the dc response image and the magnitude response image. The dc image shows the medium phantom to be less compliant on the right-hand side, but such a trend could not be discerned from the magnitude and phase images at 500 Hz. The explanation for this discrepency is that the dc image is vulnerable to bias due to very low frequency vibrations in the structure. The I-Q demodulation of the displacement response to amplitude modulated ARF beams is very robust against such vibrations and other sources of noise.
Fig. 11.
Images of the inclusion using a 5-MHz ARF beam: (a) dc response (µm), (b) magnitude response (µm) at 500-Hz modulation, and (c) phase response (degree) at 500-Hz modulation.
E. On-Line Parameter Tracking Using the EKF
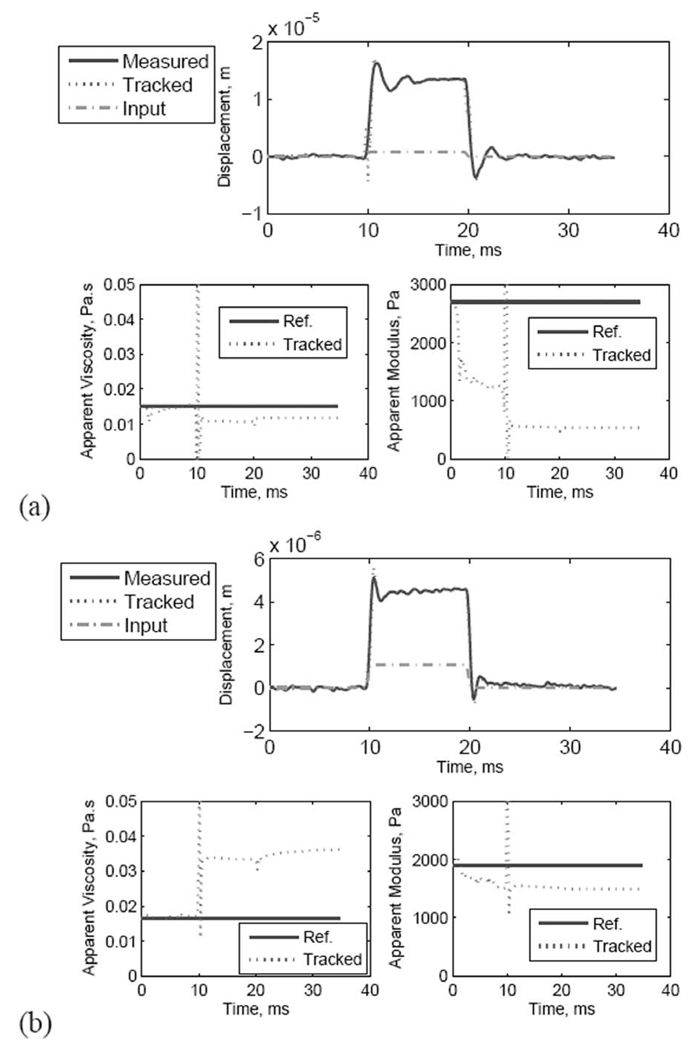
Fig. 12 shows EKF state and parameter estimation for a 10-ms ARF pulse applied to the medium and stiff samples described in Section III-A. The EKF setup for obtaining the results shown is as follows:
The displacement data from speckle tracking at 13.3 mm (i.e., low-strain, prefocal region) were used.
We have removed a temperature-dependent component from the displacement data, which resulted from the relatively long duration of the modulated ARF. This was simply performed by removing the linear trend in the displacement data. This technique was described recently in [40].
A short 5-point moving average (MA) filter was applied to the data and the modulation function of the ARF beam.
The variance of the process noise was set at a fraction of the estimated ARF from intensity calculation. The threshold was chosen high enough to emphasize data tracking in the absence of the ARF. It is set low enough that the parameter tracking responds immediately to the application of the ARF. In this case, we chose .
The variance of the observation noise was estimated from the observed data after the application of the MA filter and set accordingly in the EKF equation. For the data presented in this paper, the observation noise variance was set to 5 × 10⁻¹⁵. This value is nearly 20 times the noise variance estimated directly from the baseline displacement data before the application of the ARF. It is nearly five orders of magnitude higher than the Cramer-Rao lower bound (CRLB) [20] for our imaging system. This value was chosen empirically to achieve an acceptable convergence rate of the matrix Riccati equation (20) without causing divergence. Faster convergence rate could be achieved using smaller values, but with increased probability of divergence.
The initial values for ω0 and ξ were chosen somewhat arbitrarily; the EKF is very robust in producing final estimated values that are largely independent of the initial value.
The initial state covariance matrix, P(0), was a diagonal matrix with entries such that the standard deviation of each parameter is 10 times its initial value. This allowed us to characterize the convergence of the matrix differential Riccati equation.
Fig. 12.
Data and parameter tracking using the EKF with pulsed ARF force: (a) medium thin phantom, and (b) stiff thin phantom.
Comparing the measured and tracked displacements in Fig. 12, one can see that the EKF tracks the displacement closely before, during, and after the application of the ARF beam. The maximum error occurs during the first 1 ms after the initial application of the ARF beam when the changes in the estimated parameter are most pronounced. This can be seen in the results from the medium phantom (at t ≈ 10 ms). The tracking of the apparent modulus and viscosity show that the modulus converges to a constant value within the first few milliseconds of the onset of the ARF beam. Using the output power measurement from the ARF transducer and taking the absorption values in the two different phantoms into account, we used (6) to estimate the value of Fz max. We estimated the force to be 3.6 and 4.8 µN in the medium and stiff phantoms, respectively. Using a simplified formula relating the stiffness to the Young’s modulus, where L and A are the effective length and cross-sectional area, respectively, of the volume affected by the ARF beam), an estimate of the apparent modulus is given by . The value of L for each phantom experiment was estimated by measuring the extent of the low-strain region from the spatio-temporal map. Based on these measurements, we estimated L to be 0.3 and 0.245 mm for the medium and stiff phantoms, respectively. Therefore, the force values given above produced a steady state estimate of the apparent modulus values of 535 and 1545 Pa for the medium and stiff phantoms, respectively. These estimates are consistent with the values predicted according to the fabrication procedure [4]. However, they are well below the measured values based on the procedure described in [26]. These discrepancies are discussed further in the next section.
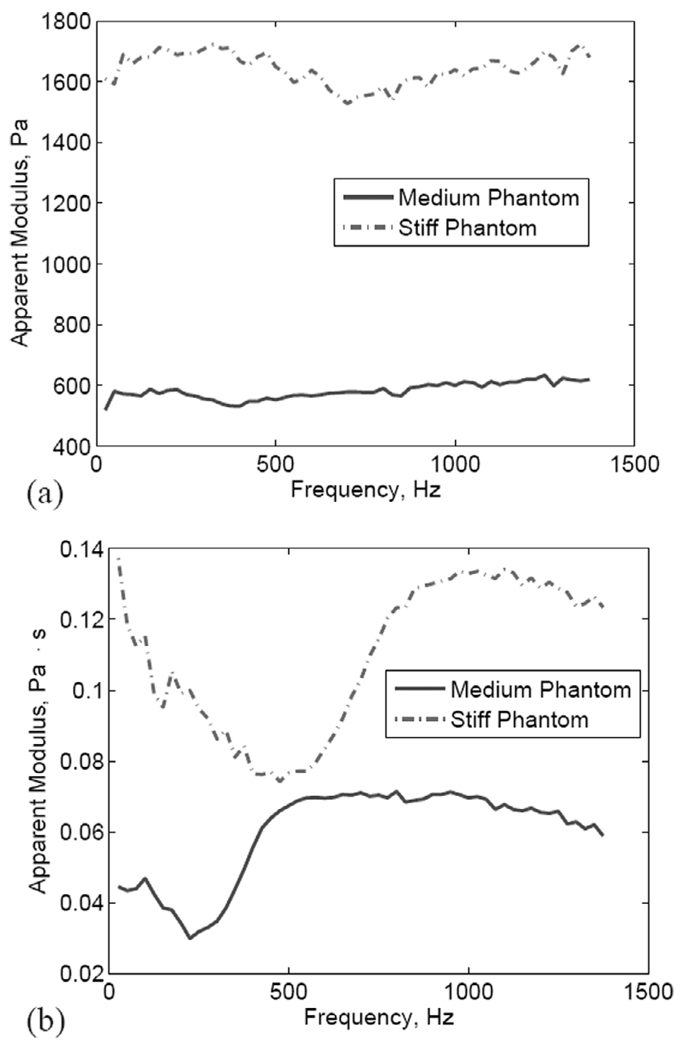
The EKF was run using sinusoidally modulated ARF inputs used to generate the frequency responses shown in Fig. 7 and Fig. 8. The results are summarized in Fig. 13, which shows the following:
The modulus estimates are largely independent of the modulation frequency for both the medium and the stiff phantoms.
The ratio between the modulus values for the stiff and the medium phantoms is approximately 2.8 in the frequency range shown. This is lower than the value obtained based on the modulus values reported in [4] (3.2), but higher than those obtained from the shear wave velocity test (2.5) and the compression test (2.1).
The viscosity estimates exhibit frequency dependence characterized by a sharp transition around the resonance frequency for both the medium and the stiff phantoms. For frequencies higher than the resonance frequency, the estimated viscosity appears to be flat. On the other hand, for low frequencies, the estimated viscosity appears to decrease with frequency.
Fig. 13.
Estimated modulus (a) and viscosity (b) values in the frequency range 25–1375 Hz (ΔF = 25 Hz). Solid: medium phantom; dashed: stiff phantom.
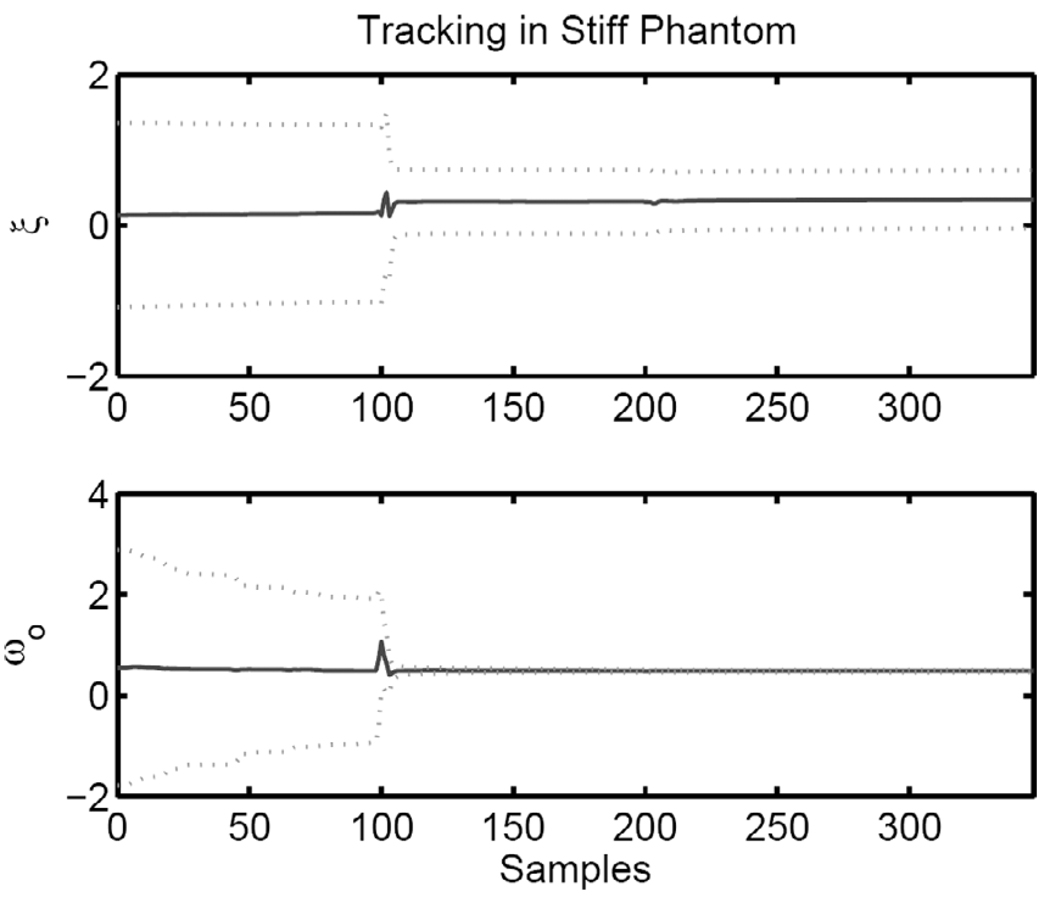
The figure-of-merit for the quality of the tracking performance of the EKF is the convergence of the matrix differential Riccati equation (20). Fig. 14 shows ξ and ω0 and the one standard deviation of the estimate (dashed lines) based on P(t). One can see that ω0 converges quickly with much tighter variance than ξ, indicating higher confidence in this measurement. The characteristics of the convergence of the Riccati equation are shown for the stiff phantom, but they are representative of the results in the medium phantom. Furthermore, similar characteristics are observed when the EKF is used for tracking sinusoidally modulated ARF inputs.
Fig. 14.
Tracked parameters (solid) with the one standard deviation boundaries from the matrix Riccati equation (dotted).
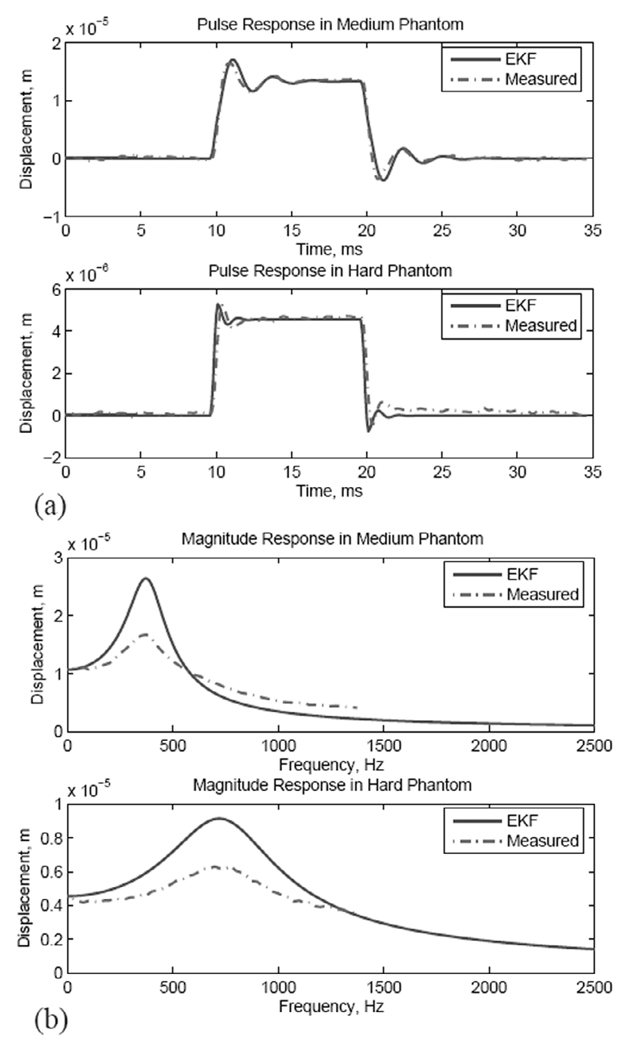
Another way to characterize the quality of the modulus and viscosity estimates is to evaluate the FHO response to ARF input using the estimated parameter values without tracking. This is illustrated in Fig. 15, which shows FHO simulation results using the estimated modulus and viscosity values shown in Fig. 12 and corresponding measurements. Fig. 15(a) shows the displacement response to the 10-ms ARF pulse in the medium (top) and stiff (bottom) phantoms. The solid lines are the simulated FHO response to the ARF using the EKF-estimated modulus and viscosity values whereas the dotted lines are the measured displacement. Examining the overshoot and decay oscillations (also the rise times and decay times) at the onset and end of the ARF pulse, one can see that the EKF-based FHO is slightly slower than for the medium phantom and slightly faster than for the stiff phantom. This suggests that the EKF appears to slightly underestimate the stiffness of the medium phantom while slightly overestimating the stiffness of the stiff phantom. Fig. 15(b) shows the magnitude response of the EKF-based FHO for the medium (top) and stiff (bottom) phantoms overlaid on the corresponding measured responses using the sinusoidally modulated ARF given above. One can see that the resonance peak is accurately predicted in both cases, but the Q-factor of the FHO is higher than that of the measured response. This indicates that our estimate of viscosity appears to be lower than the true value. These results demonstrate that the modulus estimate is quite robust and that the FHO, despite limitations discussed below, is a suitable dynamic model for the estimation of the modulus from the transient response to pulsed ARF beams.
Fig. 15.
Comparison between the time-invariant FHO based on EKF estimates and the measured responses in medium and stiff phantoms: (a) pulse response, and (b) magnitude response.
IV. DISCUSSION
The results provide a partial validation of the FHO as a dynamic model of thin tissue constructs on rigid substrates for the application of focused ARF beams. The effect of the tissue thickness and stiffness on the presence of a well-defined resonance in the frequency response was demonstrated experimentally. The imaging results shown in Section III-D indicate that the tissue response to the application of the ARF is highly localized. Together, the results of Section III-C and Section III-D suggest a simple relationship between the resonance and the tissue volume affected by the ARF beam within the thin tissue construct. A reliable estimate of this resonance is therefore expected to produce a measurement of the modulus of thin tissue construct on hard substrates. Based on the FHO model, the EKF was validated as a tool for tracking this parameter from transient tissue response to the application of ARF. Robust estimation of the stiffness coefficient in the FHO equation (4) was demonstrated experimentally, but the viscosity coefficient could not be estimated reliably based on the FHO model. The slow convergence of the viscosity term could be explained based on the following:
The FHO model with a single observation point does not account for energy escaping the system due to shear wave generation by the ARF beam.
The FHO model with a single observation point does not account for energy escaping the system due to damping of surface oscillation by the water medium on top of the sample.
The FHO model does not account for strains in the tissue response due to thermal effects of the ARF beam. These thermal effects are present for ARF beams with durations in the millisecond range, especially in the stiff phantom. In this paper, we simply removed the trend in the displacement data due to temperature rise. However, a more appropriate solution must include the estimation of local strains as is typically done in temperature estimation [29].
The limitations of the FHO model proposed in this paper can be addressed by increasing the number of observation points to account for the spatial tissue response. The number of observation points along the axis of the dual-element transducer can be increased provided that a good characterization of the SNR of the displacement estimates is available [20], [21]. The spatial resolution of the resulting system will depend on whether the stress-strain or the force-displacement relationship is used in dynamic modeling of tissue response to the ARF beam. If the latter is used, then the spatial resolution will match the spatial sampling of the observation grid. If a stress-strain model is used, then the spatial resolution depends on the bandwidth of the filter(s) used in evaluating axial derivatives for strain calculations. This is similar to temperature estimation based on speckle tracking [29].
The total force model suggested by (6) was investigated experimentally by positioning the focal point at 0, 0.5, and 1 mm from the free surface of a 4-mm-thick (stiff) phantom. The results indicate that the radiation pressure term is significant when the ARF focus is positioned at the surface, but diminishes when the ARF focus is placed at 0.5 or more mm below the surface. However, the measured frequency response curves near the ARF focus produced the same resonance frequency, with small changes in viscosity (suggested by phase response). Similarly, the frequency response at a fixed point below the surface (≈ 0.5 mm) showed that the resonance frequency is independent of the ARF focal point. This suggests that the stiffness term in (4) is determined by the thickness of the phantom and is independent of the pushing location. Based on these results, we plan to use B-mode HFUS guidance to place the ARF focus at points that maximize the SNR for displacement and parameter tracking. For example, for tissue constructs with thickness values below 1 mm, maximum displacements are obtained when placing the ARF focus at the surface. Obviously, for thicker tissue constructs, more localized parameter estimation can be obtained by placing the ARF focus near the points of interest. This issue is being investigated in conjunction with the multiple observation EKF model currently being developed.
The phase response of the FHO is similar to that of the experimentally measured phase responses for the thin tissue constructs except that the FHO swings from zero to −180° around the resonance frequency of the sample. On the other hand, the measured phase responses swing from zero to ≈ −65° and ≈ −45° for the medium and stiff samples, respectively. This suggests a modification for (4) by expressing the force in the form Fz(t) + τ Ḟz(t). Such a modification can also be justified by the use of the Kelvin or standard linear solid as a constitutive model for the tissue viscoelastic response (See Eq. 2.11.7 in [25].) This is an open research question that is being pursued by a number of groups [41], [42].
Interrogation of thin tissue constructs on rigid substrates using the ARF presents some opportunities for significant increase in contrast compared to that of conventional ultrasound. Even for the phantoms with relatively low modulus values used in this paper, the effect of thickness and stiffness on the presence of measurable resonances is quite pronounced. These resonances can be estimated using ARFI-type excitation followed by interrogation with sinusoidally modulated ARF beams at a select frequency (or frequencies) to achieve maximum image contrast between the background (e.g., normal skin on bone) and inclusions (e.g., tumors). We emphasize that there will be no need to interrogate the tissue with a full spectrum of modulation frequencies. In addition, the duration of the sinusoidally modulated ARF beams need not be in the tens of milliseconds, as shown here. The quadrature detector converges within the first cycle interval of the modulation frequency. Therefore, depending on the selected modulation frequency, 2–5 ms durations may be necessary to acquire the displacement data. This also applies for tracking the modulus using the EKF, where the convergence of the matrix differential Riccati equation is practically achieved within a few milliseconds from the onset of the ARF. This does not apply, however, to the tracking of the viscosity parameter, which exhibits slower convergence and may, in fact, be a time-varying parameter. This issue is currently being investigated as part of an effort to determine the proper constitutive model for tissue response in conjunction with a complete viscoelastodynamic model of the tissue response to ARF excitation [42]. The model accounts for the presence of the boundary conditions as well as the propagation of both compressional and shear waves in the tissue. The constitutive model most appropriate for explaining the tissue response based on the observed data will be used to reinterpret the viscoelastic parameters estimated through the EKF. If necessary, the results of this investigation will also be used in modifying the differential equations used in building the appropriate EKF model for direct quantitative estimation of the viscoelastic parameters of interest.
The apparent modulus values resulting from the EKF underestimate the Young’s modulus values for the phantom materials used. This is most likely the result of our interpretation of the effective length, L, of the tissue volume affected by the ARF beam. In this paper, we have simply estimated L from the low-strain region perceived to be undergoing translation in response to the ARF beam. In addition, we have used a simplified geometrical relationship between the Young’s modulus and stiffness, K = EA/L, which assumes a uniform force over the cross-sectional area, A. A more appropriate solution is to seek an analytical or numerical relationship between K and E that takes the ARF beam and phantom geometry into account. This is the usual practice in the interrogation of thin viscoelastic layers on hard substrates using axisymmetric indentation [35] and atomic force microscopy [43]. Once this is accomplished, the modulus estimates resulting from the EKF can be expected to reflect the true values for the tissue being tested.
V. CONCLUSION
We have presented preliminary results from a dual-mode system for imaging viscoelastic tissue properties in thin tissue constructs on rigid substrates. The motivation for this approach is to provide nondestructive testing of tissue-engineered constructs as they are incubated within molds for tissue growth and maturation prior to harvest and use. The results presented herein indicate that the proposed system could provide a nondestructive estimate of the apparent modulus of the heart valve samples on rigid substrates.
The results shown in Section III-D show that sinusoidal modulation of ARF beams, together with quadrature detection, may provide a higher level of specificity to variations in the viscoelastic properties of thin tissue constructs. In addition, these measurements can be made with high lateral resolution, as suggested by the image reconstructions shown in Fig. 11. These results also demonstrate that the modulus measurements obtained using the EKF will have similar lateral resolution. Therefore, high-resolution 2D characterization of viscoelastic properties of thin tissue constructs is feasible.
An additional motivation for our work is imaging skin tumors and detecting their boundaries with high contrast in the presence of nearby boundary conditions. This is a more challenging task and requires the use of spatiotemporal displacement (or strain) responses together with multiple observation point EKF. The results shown in this paper show that our approach is feasible; the spatiotemporal displacement maps are well behaved and should provide reliable estimates of both displacement and strain. The extension of the EKF results to multiple observation points is straightforward. The main issue is the validation of the noise model of the displacement (or strain) estimates from speckle tracking at the different observation points.
The high degree of integration between the ARF generation and displacement estimation allowed us to produce very high quality displacement estimation, capturing the full transient behavior of the tissue constructs in response to ARF. In addition, the results provide a strong initial validation of the EKF methodology for data and parameter tracking. This methodology, together with the appropriate constitutive viscoelastic models, promises to provide a means for quantitative and/or functional imaging of relevant biomechanical tissue properties.
ACKNOWLEDGMENT
The authors thank Professor Robert Tranquillo and Professor Bojan Guzina for fruitful discussions.
This work was funded in part by NIH Grant HL 71538 from the National Heart, Blood, and Lung Institute and in part by NIH Grant EB 006893 from the National Institute of Biomedical Imaging and Bioengineering.
Biographies

Dalong Liu was born in China in 1977. He received his B.Sc. and M.Sc. degrees in biomedical engineering from Zhejiang University, Hangzhou, China, in 2001 and 2004, respectively. He is currently working toward the Ph.D. degree in the Department of Biomedical Engineering at the University of Minnesota, Minneapolis, MN.
His research interests are in elastography with acoustic radiation force, ultrasound imaging, and signal processing.

Emad S. Ebbini received his B.Sc. degree in electrical engineering/communications in 1985 from the University of Jordan, and his M.S. and Ph.D. degrees in electrical engineering from the University of Illinois at Urbana-Champaign in 1987 and 1990, respectively. From 1990 until 1998, he was on the faculty of the Electrical Engineering and Computer Science Department at the University of Michigan, Ann Arbor. Since 1998, he has been with the Electrical and Computer Engineering Department at the University of Minnesota, Minneapolis. In 1993, he received the NSF Young Investigator Award for his work on new ultrasound phased arrays for imaging and therapy. He was a member of AdCom for the IEEE Ultrasonics, Ferroelectrics, and Frequency Control between 1994 and 1997. In 1996, he was a guest editor for a special issue on therapeutic ultrasound in the IEEE Transactions on Ultrasonics, Ferroelectrics, and Frequency Control. He was an associate editor for the same transactions from 1997–2002. He is a member of the standing technical program committee for the IEEE Ultrasonics Symposium and a member of the Board of the International Society for Therapeutic Ultrasound. His research interests are in signal and array processing with applications to biomedical ultrasonics and medical devices.
Contributor Information
Dalong Liu, Department of Biomedical Engineering, University of Minnesota, Minneapolis, MN.
Emad S. Ebbini, Department of Electrical and Computer Engineering, University of Minnesota, Minneapolis, MN (emad@ece.umn.edu).
REFERENCES
- 1.Sarvazyan AP, Rudenko OV, Swanson SD, Fowlkes JB, Emelianov SY. Shear wave elasticity imaging: A new ultrasonic technology of medical diagnostics. Ultrasound Med. Biol. 1998;vol. 24:1419–1435. doi: 10.1016/s0301-5629(98)00110-0. [DOI] [PubMed] [Google Scholar]
- 2.Wu T, Felmlee JP, Greenleaf JF, Riederer SJ, Ehman RL. MR imaging of shear waves generated by focused ultrasound. Magnet. Reson. Med. 2000;vol. 43:111–115. doi: 10.1002/(sici)1522-2594(200001)43:1<111::aid-mrm13>3.0.co;2-d. [DOI] [PubMed] [Google Scholar]
- 3.Walker WF, Fernandez FJ, Negron LA. A method for imaging viscoelastic parameters with acoustic radiation force. Phys. Med. Biol. 2000;vol. 45:1437–1447. doi: 10.1088/0031-9155/45/6/303. [DOI] [PubMed] [Google Scholar]
- 4.Nightingale KR, Palmeri ML, Nightingale RW, Trahey GE. On the feasibility of remote palpation using acoustic radiation force. J. Acoust. Soc. Amer. 2001 July;vol. 110:625–634. doi: 10.1121/1.1378344. [DOI] [PubMed] [Google Scholar]
- 5.Ophir J, Cespedes I, Pnekanti H, Yazdi M, Li X. Elastography: A quantitative imaging method for measuring the elasticity of biological tissue. Ultrason. Imag. 1991;vol. 13(no. 2):111–134. doi: 10.1177/016173469101300201. [DOI] [PubMed] [Google Scholar]
- 6.O’Donnell M, Skovoroda A, Shapo B, Emelianov SY. Internal displacement and strain imaging using ultrasonic speckle tracking. IEEE Trans. Ultrason., Ferroelect., Freq. Contr. 1994;vol. 41(no. 3):314–325. [Google Scholar]
- 7.Cohn NA, Emelianov SY, Lubinski MA, O’Donnell M. An elasticity microscope: Part I. Methods. IEEE Trans. Ultrason., Ferroelect., Freq. Contr. 1997 Nov;vol. 44:1304–1319. [Google Scholar]
- 8.Cohn NA, Emelianov SY, O’Donnell M. An elasticity microscope: Part II. Experimental results. IEEE Trans. Ultrason., Ferroelect., Freq. Contr. 1997 Nov;vol. 44:1320–1331. [Google Scholar]
- 9.Zheng YP, Bridal SL, Shi J, Saied A, Lu MH, Jaffre B, Mak AFT, Laugier P. High resolution ultrasound elastomicroscopy imaging of soft tissues: System development and feasibility. Phys. Med. Biol. 2004;vol. 49:3925–3938. doi: 10.1088/0031-9155/49/17/007. [DOI] [PubMed] [Google Scholar]
- 10.Parker KJ, Huang SR, Musulin RA, Lerner RM. Tissue response to mechanical vibrations for sonoelasticity imaging. Ultrasound Med. Biol. 1990;vol. 16(no. 3):241–246. doi: 10.1016/0301-5629(90)90003-u. [DOI] [PubMed] [Google Scholar]
- 11.Lerner RL, Parker KJ, Holen J, Gramiak R, Waag RC. Sonoelasticity: Medical elasticity images derived from ultrasonic signals in mechanically vibrated tissue. Acoust. Imaging. 1998;vol. 16(no. 3):317–327. [Google Scholar]
- 12.Fatemi M, Greenleaf JF. Vibroacoustography: An imaging modality based on ultrasound stimulated acoustic emission. Proc. Natl. Acad. Sci. USA. 1999;vol. 96:6603–6609. doi: 10.1073/pnas.96.12.6603. [DOI] [PMC free article] [PubMed] [Google Scholar]
- 13.Konofagou EE, Hynynen K. Localized harmonic motion imaging: Theory, simulations and experiments. Ultrasound Med. Biol. 2003;vol. 29:1405–1413. doi: 10.1016/s0301-5629(03)00953-0. [DOI] [PubMed] [Google Scholar]
- 14.Bercoff J, Tantar M, Fink M. Supersonic shear imaging: A new technique for soft tissue elasticity mapping. IEEE Trans. Ultrason., Ferroelect., Freq. Contr. 2004;vol. 51(no. 4):396–409. doi: 10.1109/tuffc.2004.1295425. [DOI] [PubMed] [Google Scholar]
- 15.Palmeri ML, McAleavey SA, Fong KL, Trahey GE, Nightingale KR. Dynamic mechanical response of elastic spherical inclusions to impulsive acoustic radiation force excitation. IEEE Trans. Ultrason., Ferroelect., Freq. Contr. 2006;vol. 53:2065–2079. doi: 10.1109/tuffc.2006.146. [DOI] [PMC free article] [PubMed] [Google Scholar]
- 16.Neidert M, Lee E, Oegema T, Tranquillo RT. Enhanced fibrin remodeling in vitro with tgf-b1, insulin and plasmin for improved tissue-equivalents. Biomaterials. 2002;vol. 23:3717–3731. doi: 10.1016/s0142-9612(02)00106-0. [DOI] [PubMed] [Google Scholar]
- 17.Williams C, Robinson P, Tranquillo R. Cell sourcing for fibrin-based valve-equivalents. Tissue Eng. 2006;vol. 12(no. 6):1489–1502. doi: 10.1089/ten.2006.12.1489. [DOI] [PubMed] [Google Scholar]
- 18.Grassl E, Oegema T, Tranquillo RT. A fibrin-based arterial media-equivalent. Biomaterials. 2003;vol. 66:550–561. doi: 10.1002/jbm.a.10589. [DOI] [PubMed] [Google Scholar]
- 19.Robinson P, Johnson S, Evans M, Barocas V, Tranquillo RT. Functional tissue-engineered valves from cell-remodeled fibrin with commissural alignment of cell-produced collagen. Tissue Eng. 2008;vol. 14(no. 1):83–95. doi: 10.1089/ten.a.2007.0148. [DOI] [PubMed] [Google Scholar]
- 20.Walker WF, Trahey GE. A fundamental limit on delay estimation using partially correlated speckle signals. IEEE Trans. Ultrason., Ferroelect., Freq. Contr. 1995;vol. 42(no. 2):301–308. [Google Scholar]
- 21.Varghese T, Ophir J. A theoretical framework for performance characterization of elastography: The strain filter. IEEE Trans. Ultrason., Ferroelect., Freq. Contr. 1997;vol. 44(no. 1):164–172. doi: 10.1109/58.585212. [DOI] [PubMed] [Google Scholar]
- 22.Palmeri ML, McAleavey SA, Trahey GE, Nightingale KR. Ultrasonic tracking of acoustic radiation force-induced displacements in homogeneous media. IEEE Trans. Ultrason., Ferroelect., Freq. Contr. 2006;vol. 53:1300–1313. doi: 10.1109/tuffc.2006.1665078. [DOI] [PMC free article] [PubMed] [Google Scholar]
- 23.Office of Device Evaluation. Revised 510(k) diagnostic ultrasound guidance for 1997. U.S. Food and Drug Administration. 1997 Sep [Google Scholar]
- 24.Haykin S. Adaptive Filter Theory. Englewood Cliffs, NJ: Prentice-Hall; 2002. [Google Scholar]
- 25.Fung YC. Biomechanics: Mechanical Properties of Living Tissue. 2nd ed. New York: Springer-Verlag; 1993. [Google Scholar]
- 26.Hall TJ, Bilgen M, Insana MF, Krouskop TA. Phantom materials for elastography. IEEE Trans. Ultrason., Ferro-elect., Freq. Contr. 1997;vol. 44:1355–1365. [Google Scholar]
- 27.Liu D, Ebbini ES. Viscoelastic tissue property measurement using high frequency ultrasound. Proc. 4th IEEE Int. Symp. Biomed. Imag. (ISBI); 2007. pp. 892–895. [Google Scholar]
- 28.Chiao RY, Hao X. Coded excitation for diagnostic ultraound: A system developer’s perspective. IEEE Trans. Ultrason., Ferroelect., Freq. Contr. 2005;vol. 52(no. 2):160–170. doi: 10.1109/tuffc.2005.1406543. [DOI] [PubMed] [Google Scholar]
- 29.Simon C, VanBaren P, Ebbini ES. Two-dimensional temperature estimation using diagnostic ultrasound. IEEE Trans. Ultrason., Ferroelect., Freq. Contr. 1998 July;vol. 45:989–1000. doi: 10.1109/58.710592. [DOI] [PubMed] [Google Scholar]
- 30.Fahey BJ, Nightingale KR, Stutz DL, Trahey GE. Acoustic radiation force impulse imaging of thermally and chemically induced lesions in soft tissues: Preliminary ex vivo results. Ultrasound Med. Biol. 2004;vol. 30:321–328. doi: 10.1016/j.ultrasmedbio.2003.11.012. [DOI] [PubMed] [Google Scholar]
- 31.Christensen D. Ultrasonic Bioinstrumentation. New York: Wiley; 1988. [Google Scholar]
- 32.Chu B-T, Apfel RE. Acoustic radiation pressure produced by a beam of sound. J. Acoust. Soc. Amer. 1982;vol. 72(no. 6):1673–1687. [Google Scholar]
- 33.Wang TG, Lee CP. Radiation pressure and acoustic levitation. In: Hamilton MF, Blackstock DT, editors. Nonlinear Acoustics. ch. 6. San Diego, CA: Academic Press; 1998. pp. 177–205. [Google Scholar]
- 34.Morse PM, Ingard KU. Theoretical Acoustics. Princeton, NJ: Princeton University Press; 1986. [Google Scholar]
- 35.Sakai M. Elastic and viscoelastic contact mechanics of coating/substrate composites in axisymmetric indentation. Philosoph. Mag. 2006;vol. 86(no. 33):5607–5624. [Google Scholar]
- 36.Cespedes I, Ophir J, Alam SK. The combined effect of signal decorrelation and random noise on the variance of time delay estimation. IEEE Trans. Ultrason., Ferroelect., Freq. Contr. 1997;vol. 44(no. 1):220–225. doi: 10.1109/58.585223. [DOI] [PubMed] [Google Scholar]
- 37.Ljung L, Soderstrom T. Theory and Practice of Recursive Identification. Boston: MIT Press; 1983. [Google Scholar]
- 38.Candy JV. Signal Processing: The Model-Based Approach. New York: McGraw-Hill; 1986. [Google Scholar]
- 39.Al-Kaisi M. M.S. thesis. Minneapolis, MN: University of Minnesota; 2007. Characterization of the heating efficiency of pulsed HIFU. [Google Scholar]
- 40.Maleke C, Pernot M, Konofagou EE. Single-element focused ultrasound transducer method for harmonic motion imaging. Ultrason. Imag. 2006;vol. 28:144–158. doi: 10.1177/016173460602800302. [DOI] [PubMed] [Google Scholar]
- 41.Sinkus R, Tanter M, Catheline S, Lorenzen J, Kuhl C, Sondermann E, Fink M. Imaging anisotropic and viscous properties of breast tissue by magnetic resonance-elastography. Magnet. Reson. Med. 2005;vol. 53(no. 2):372–387. doi: 10.1002/mrm.20355. [DOI] [PubMed] [Google Scholar]
- 42.Tuleubekov K, Guzina BB, Liu D, Ebbini ES. Modeling of viscoelastodynamic response to acoustic radiation force in multilayered media. Phys. Med. Biol. to be published. [Google Scholar]
- 43.Mahaffy RE, Park S, Gerde E, Käs J, Shih K. Quantitative analysis of the viscoelastic properties of thin regions of fibroblasts using atomic force microscopy. Biophys. J. 2004;vol. 86:1777–1793. doi: 10.1016/S0006-3495(04)74245-9. [DOI] [PMC free article] [PubMed] [Google Scholar]


