Abstract
A photoacoustic correlation technique, inspired by its optical counterpart—the fluorescence correlation spectroscopy (FCS), was tested for the first time to demonstrate the feasibility of low-speed flow measurement based on photoacoustic signal detection. A pulsed laser was used to probe the flow of light-absorbing beads. A photoacoustic correlation system of 0.8 sec temporal resolution was built and flow speeds ranging from 249 to 14.9 µm/s with corresponding flow time from 4.42 to 74.1 sec were measured. The experiment serves as a proof of concept for photoacoustic correlation spectroscopy, which may have many potential applications similar to FCS.
Fluorescence correlation spectroscopy (FCS) is a powerful technique widely used in analytical chemistry and biological research [1]. In FCS, fluctuation of fluorescence intensity of a small number of fluorescent molecules is analyzed using temporal correlation. FCS has found a wide range of applications [2,3]. We propose a technology, photoacoustic correlation spectroscopy (PACS), by extending the fluorescence detection in FCS to the acoustic signal domain. The PACS is based on pulsed laser excitation. Autocorrelation is performed using measured photoacoustic signals, and the term “spectroscopy” refers to time-spectrum rather than in common usage as a frequency spectrum. PACS is different from other techniques using PA effects in correlation measurements, such as photoacoustic spectroscopy (PAS) [4] and correlation photoacoustic spectroscopy (CPAS) [5]. PAS was to analyze the absorbing chemical groups of samples from the measured IR spectrum. CPAS measures the cross correlation between excitation source and detected acoustic response. CPAS was mainly used to study static properties such as depth-profiling and thermal imaging. In contrast, the specific purpose of the PACS technique is to study functional dynamics of PA species.
The PACS could open up a range of applications in medical diagnosis. As one example, the analysis of microcirculation system provides unique comprehension of disease processes [6]. Current used methods include Doppler related techniques and histological sectioning. However, these techniques in studying microcirculation have been restricted by issues of invasiveness, low resolution, limited imaging depth, and minimum measurable flow speed [7]. Take Doppler techniques for example. Doppler ultrasound method is not easy to detect the flow speed less than 1 mm/s [8]. Doppler optical coherence tomography has difficulties in flow measurement at depth greater than 1 mm [9]. One way to overcome these limitations is using PA signals from the red blood cells (RBCs) excited by a pulsed laser, which circumvents the diffusive light scattering in tissues [10].
In this letter, we conduct experiments on flow measurement to demonstrate feasibility of PACS technique. The PACS flowmetry for assessment of microvascular blood flow has several advantages. (1) It provides a label-free measurement because the high optical contrast between RBCs and the surrounding tissues [11]. (2) Low scattering of sound signals enables high imaging depth. (3) Wide range flow speeds can be measured by properly designed temporal resolution and probe beam size. (4) Photoacoustic microscopy (PAM) scheme can be used to provide high spatial resolution [12].
Light-absorbing beads generate PA waves when they absorb laser energy and undergo an instantaneous thermal expansion. In PACS, we name the counterpart of fluorescence intensity in FCS as PACS strength. It can be expressed as
| (1) |
where I(r) is the normalized spatial fluence distribution of the laser beam, and n(r,t) is the bead concentration at position r and time t. The laser beam used in our PACS setup defines the probe volume. When the beads move in and out of the volume, the number of beads present in this volume, denoted as nin(t), fluctuates. Because PA pressure amplitude is not directly proportional to PACS strength P(t), the information of P(t) needs to be extracted by proper signal processing from the measured PA signals. In our flow measurement configuration, a one-dimensional step excitation profile was used. Thus, I(x) = 1 at |x| ≤ w/2 and I(x) = 0 otherwise, where w is a width of the probe laser beam. The temporal autocorrelation of P(t) provides information about the average duration and strength of the fluctuations [13]. Specifically, the decay profile of the autocorrelation function G(τ) reveals the beads’ dwell time in the probe volume. The magnitude of G(0) is related to the number density of the beads in the probe region. The normalized autocorrelation function can be calculated as
| (2) |
where δP(t) = P(t) − <P(t)> is the fluctuation of P(t) and < > denotes ensemble average.
We choose a flow experiment because it is easy to obtain a range of dwell time. Analysis of flow for a step laser profile has been studied [14]. With a flow speed V of the beads, the autocorrelation function takes the following form:
| (3) |
where τ0 = w/V. Here, the diffusion of the beads due to Brownian motion is neglected, which is a reasonable assumption considering the long diffusion time, sec [15,16], where the Boltzmann constant kB = 1.38 × 10⁻²³ J/K, the temperature T = 300 K, the viscosity coefficient η = 10−3 Pa·s, the bead radius a = 24.5 µm, and probe beam size w = 1.1 mm.
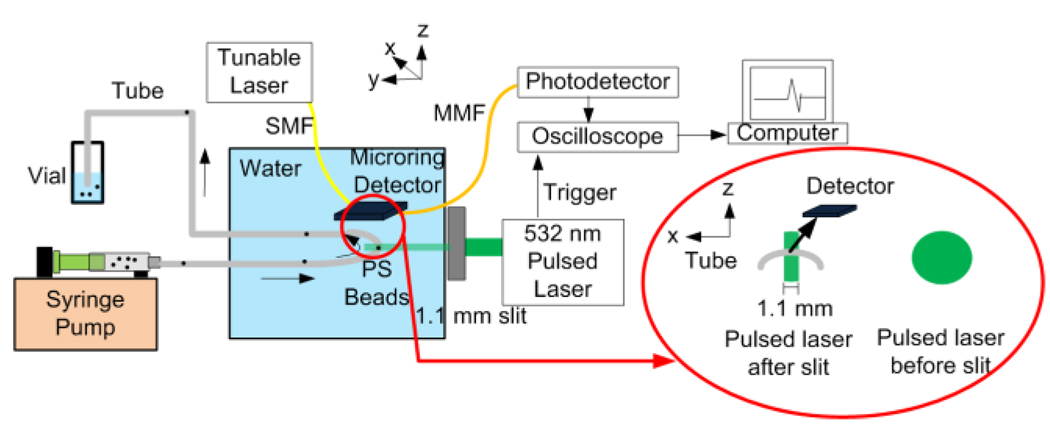
The experimental setup is shown in Fig. 1. A 532 nm pulsed laser (Surelite I-20, Continuum, Santa Clara, CA) generating 6-ns pulses with a 20 Hz repetition rate was used as the probing light source. The laser beam (fluence ~70 mJ/cm2) illuminated the flow sample (49 µm diameter black polystyrene (PS) beads in water) with a beam width of 1.1 mm. A microring resonator was used to detect the PA signals [17,18]. Assuming the probe volume is around the origin, the detector was positioned in the x–z plane, (x,0,z), as shown in Fig. 1. The photodetector output was fed to an oscilloscope (WaveSurfer 432, LeCroy, Chestnut Ridge, NY). Beads were flowing in a tubing (inner diameter: 0.8 mm) driven by a syringe pump. Flow rates were calibrated from 200 to 14 µm/s using a microscope.
Figure 1.
(Color online) Experimental setup for PACS flow measurement. SMF, MMF, and PS stand for single-mode fiber, multi-mode fiber, and polystyrene beads, respectively. Beads flow in the x-direction. The PA signals were detected by using a microring resonator positioned in the x–z plane. The shape of the pulsed laser before and after a slit is illustrated.
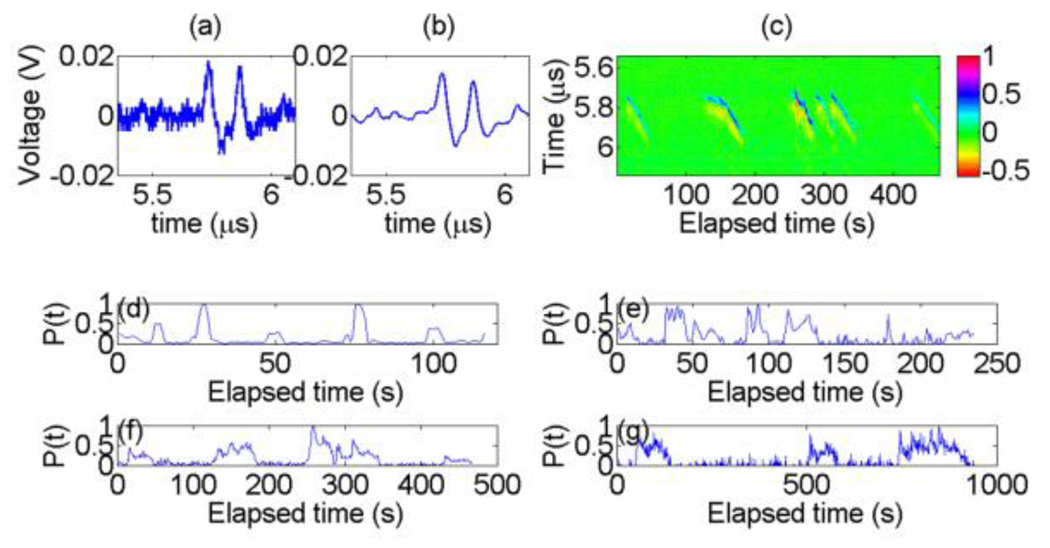
Fig. 2 (a)–(c) shows the measured PA signals from the PS beads at a calibrated flow speed of 33 µm/s. Fig. 2 (a) and (b) show the temporal PA waveform taken at a particular elapsed time before and after applying a low-pass filter (cutoff frequency: 50 MHz). The complete PA signals collected are shown in Fig. 2 (c). As time elapses, temporal PA signals appear from 5.75 to 5.95 µs. Thus, we can determine that the one-dimensional flow direction is away from the detector. For measuring three-dimensional flow vectors, line scan FCS [19] can be applied to PACS. Fig. 2 (d)–(g) show the PACS strength P(t) for four calibrated speeds. It was extracted using collected temporal PA data to within a constant scaling factor by taking the root-mean-square value of the measured PA signals, which is suitable for a low-concentration solution. Due to a finite time duration needed for each data transmission from the oscilloscope to a computer, the available temporal resolution of our current PACS system is 0.8 sec, meaning one sample of P(t) per 0.8 sec. Noise in P(t) estimate was offset to zero for more accurate estimation of G(0) [15]. Fig. 2 (d)–(g) show that the beads dwell time becomes longer as the speed decreases. Different noise level in P(t) is due to different devices’ sensitivity. The signal-to-noise ratio (SNR) of the filtered PA signals in the four cases was estimated as 35, 26, 29, and 22 dB.
Figure 2.
(Color online) (a) Detected raw PA signals at a calibrated flow speed of 33 µm/s and at elapsed time = 309.1 s. (b) Signals after filtering. (c) Detected PA signals as a function of elapsed time, measured at the calibrated speed of 33 µm/s. The average distance from the beads to the detector was ~8.5 mm. (d)–(g) PACS strength fluctuation as a function of elapsed time. PACS strengths in (d)–(g) correspond to calibrated speeds of 200, 90, 33, and 14 µm/s, respectively.
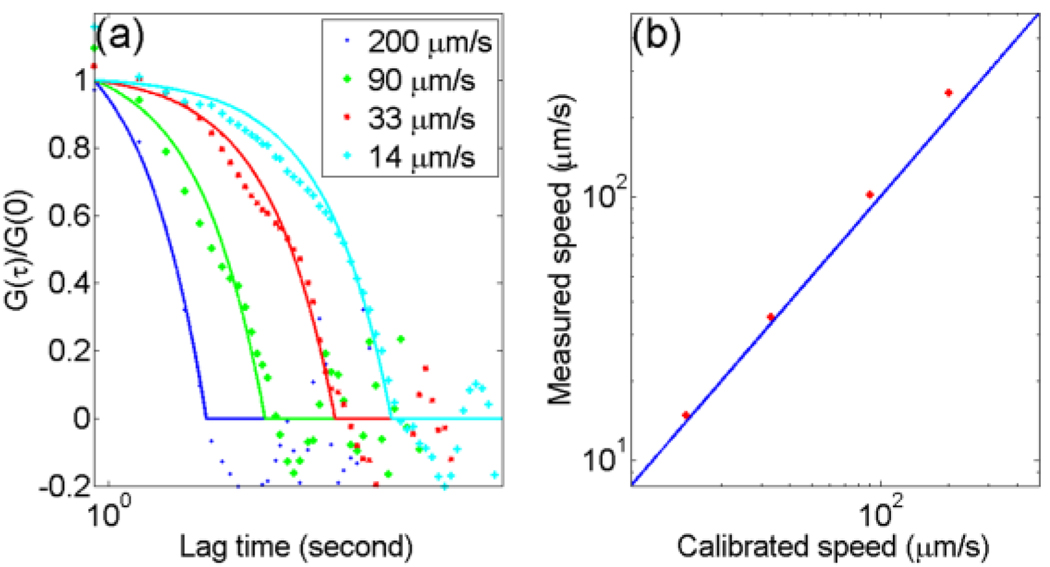
The PACS curves are shown in Fig. 3 (a). The dotted points are autocorrelation curves calculated from Eq. (2). The solid curves are the fits using Eq. (3). The dwell times, τ0, obtained from PACS curves were 4.42–74.1 s. The measured flow speeds calculated from the relation V = w/τ0 were 249–14.9 µm/s. In Fig. 3 (b), the dotted points are the speeds by PACS measurement and the solid line represents results from direct measurement, which shows excellent agreement between the two. Discrepancy in the case of faster flow speed might be due to limited fitting points.
Figure 3.
(Color online) (a) PACS curves of designed flow speeds of 200, 90, 33, and 14 µm/s. The solid curves are the corresponding fits. (b) The measured flow speeds by the PACS technique, shown in stars, versus the calibrated flow speeds. The solid line represents the results from direct measurement.
The extracted average bead number <nin> were 0.53. Accordingly, the concentration can be estimated as 0.96 mm−3 [= 0.53/(1.1×π×(0.8/2)2)], which is a little different from the designed concentration, ~0.69 mm−3. The former could have been overestimated because the nonuniform spatial fluence distribution of laser can result in a less-than-1 volume contrast [15,20], and thus an underestimated probe volume. Longer measurement time and lower noise are helpful to determine the concentration more accurately. To measure a higher concentration in PACS, either a better detection scheme to distinguish nin(t) >> 1 or a small probe volume can be used. In the former case, a detector array enables imaging capability. In the latter case, the temporal resolution of a PACS system should also be improved according to the relation τ0 = w/V. Otherwise, the maximum measurable flow speeds would be limited. As V increases, the flow time τ0 decreases and eventually approaches the limit of system’s temporal resolution. A small probe volume also expands the minimum measurable V, which has no theoretical limitation in PACS flowmetry, by preventing prohibitively long time for measurement. Combining the two methods, PACS techniques can be further engineered for clinical applications.
To show the potential of PACS to study microcirculation at significant depth, we analyze a case of photoacoustic detection of a RBC. Assuming the effective noise-equivalent pressure (NEP) of a microring detector array is 2 Pa over 1–80 MHz and a 7 µm RBC, the imaging depth is estimated as 4.6 mm by using an analysis similar to that in [17] with parameters: , J0 = 20 mJ/cm2, and A = 20 dB/cm. In comparison, FCS for blood flow is limited by the optical transport mean free path, ~1 mm in human skin. The spatial resolution of the probe volume can be several micrometers [12]. So it is feasible to use PACS technique to study randomly oriented networks of small microvessels. Our analysis shows that PACS has potential to study microcirculation with a low flow speed in small capillaries. The high sensitivity and wideband properties of the microring detector [17,18] enables deep imaging depth and high spatial resolution.
In summary, a photoacoustic correlation technique for low-speed flow measurement has been developed. We have demonstrated that the PACS technique can accurately measure bead flow speeds as slow as 14.9 µm/s. The technique has abilities to discriminate flow direction and to measure the concentration of solution. Exploring the PACS for other applications will be valuable future work.
Acknowledgments
We would like to thank Dr. Yu-Chung Chang for useful discussion on FCS. Support from NIH grant EB007619-01A1 is gratefully acknowledged.
References
- 1.Elson EL. Quick tour of fluorescence correlation spectroscopy from its inception. J. of Biomed. Opt. 2004;9:857. doi: 10.1117/1.1779234. [DOI] [PubMed] [Google Scholar]
- 2.Hess ST, Heikal AA, Webb WW. Biological and chemical applications of fluorescence correlation spectroscopy: A review. Biochemistry. 2002;41:697. doi: 10.1021/bi0118512. [DOI] [PubMed] [Google Scholar]
- 3.Kim SA, Heinze KG, Waxham MN, Schwille P. Intracellular calmodulin availability accessed with two-photon cross-correlation. Proc. Natl. Acad. Sci. 2004;101:105. doi: 10.1073/pnas.2436461100. [DOI] [PMC free article] [PubMed] [Google Scholar]
- 4.Irudayaraj J, Yang H. Depth profiling of a heterogeneous food-packaging model using stepscan Fourier transform infrared photoacoustic spectroscopy. J. Food Eng. 2002;55:25. [Google Scholar]
- 5.Telenkov SA, Mandelis A. Fourier-domain biophotoacoustic subsurface depth selective amplitude and phase imaging of turbid phantoms and biological tissue. J. Biomed. Opt. 2006;11:044006. doi: 10.1117/1.2337290. [DOI] [PubMed] [Google Scholar]
- 6.Fagrell B, Intaglietta M. Microcirculation its significance in clinical and molecular medicine. J. Intern Med. 1997;241:349. doi: 10.1046/j.1365-2796.1997.125148000.x. [DOI] [PubMed] [Google Scholar]
- 7.Goertz DE, Christopher DA, Yu JL, Kerbel RS, Burns PN, Foster FS. High-frequency color flow imaging of the microcirculation. Ultrasound Med. Biol. 2000;26:63. doi: 10.1016/s0301-5629(99)00101-5. [DOI] [PubMed] [Google Scholar]
- 8.Christopher DA, Burns PN, Armstrong J, Foster FS. A high-frequency continuous-wave Doppler ultrasound system for the detection of blood flow in the microcirculation. Ultrasound in Med. & Biol. 1996;22:1191. doi: 10.1016/s0301-5629(96)00153-6. [DOI] [PubMed] [Google Scholar]
- 9.Moger J, Matcher SJ, Winlove CP, Shore A. The effect of multiple scattering on velocity profiles measured using Doppler OCT. J. Phys. D. 2005;38:2597. [Google Scholar]
- 10.Fang H, Maslov K, Wang LV. Photoacoustic Doppler effect from flowing small light-absorbing particles. Phys. Rev. Lett. 2007;99:184501. doi: 10.1103/PhysRevLett.99.184501. [DOI] [PubMed] [Google Scholar]
- 11.Kolkman RGM, Hondebrink E, Steenbergen W, de Mul FFM. In vivo photoacoustic imaging of blood vessels using an extreme-narrow aperture sensor. IEEE J. Sel. Top. Quantum Electron. 2003;9:343. [Google Scholar]
- 12.Maslov K, Zhang HF, Hu S, Wang LV. Optical-resolution photoacoustic microscopy for in vivo imaging of single capillaries. Opt. Lett. 2008;33:929. doi: 10.1364/ol.33.000929. [DOI] [PubMed] [Google Scholar]
- 13.Haustein E, Schwille P. Single-molecule spectroscopic methods. Current Opinion in Structural Biology. 2004;14:531. doi: 10.1016/j.sbi.2004.09.004. [DOI] [PubMed] [Google Scholar]
- 14.Asai H. Proposal of a simple method of fluorescence correlation spectroscopy for measuring the direction and magnitude of a flow of fluorophores. Japanese J. Appl. Phys. 1980;19:2279. [Google Scholar]
- 15.Chang Y-C, Ye JY, Thomas T, Chen Y, Baker JR, Norris TB. Two-photon fluorescence correlation spectroscopy through a dual-clad optical fiber. Opt. Express. 2008;16:12640. doi: 10.1364/oe.16.012640. [DOI] [PubMed] [Google Scholar]
- 16.Vobornik D, Banks DS, Lu Z, Fradin C, Taylor R, Johnston LJ. Fluorescence correlation spectroscopy with sub-diffraction-limited resolution using near-field optical probes. Appl. Phys. Lett. 2008;93:163904. [Google Scholar]
- 17.Huang S-W, Chen S-L, Ling T, Maxwell A, O’Donnell M, Guo LJ, Ashkenazi S. Low-noise wideband ultrasound detection using polymer microring resonators. Appl. Phys. Lett. 2008;92:193509. doi: 10.1063/1.2929379. [DOI] [PMC free article] [PubMed] [Google Scholar]
- 18.Chen S-L, Huang S-W, Ling T, Ashkenazi S, Guo LJ. Polymer microring resonators for high-sensitivity and wideband photoacoustic imaging. IEEE Trans. Ultrason. Ferroelect. Freq. Contr. 2009;11:2482. doi: 10.1109/TUFFC.2009.1335. [DOI] [PMC free article] [PubMed] [Google Scholar]
- 19.Pan X, Shi X, Korzh V, Yu H, Wohland T. Line scan fluorescence correlation spectroscopy for three-dimensional microfluidic flow velocity measurements. J. Biomed. Opt. 2009;14:024049. doi: 10.1117/1.3094947. [DOI] [PubMed] [Google Scholar]
- 20.Mertz J, Xu C, Webb WW. Single-molecule detection by two-photon-excited fluorescence. Opt. Lett. 1995;20:2532. doi: 10.1364/ol.20.002532. [DOI] [PubMed] [Google Scholar]


