

Abstract
A number of studies aimed to distinguish the structural patterns at the interfaces of obligate and non-obligate protein-protein complexes. These studies revealed better geometric complementarity of protomers in obligate complexes over non-obligates. We showed that protein surface roughness can be used to explain this observation. Using smoothened atomic fractal dimension (SAFD) as a descriptor, this work investigates the role of interface roughness in the molecular recognition of these two types of protein-protein complexes. We studied 52 obligate and 62 nonobligate heteromeric high quality crystal structures from benchmark data sets. We found that distribution of interface roughness values obligate and non-obligates are quite similar. However, we observed a distinct preference for obligate protomers to complex with chains having similar roughness. The roughness pairing is correlated in obligates only. The later indicates, an increase/decrease of roughness in one chain causes a proportional change in roughness in its binding partner. Based on these observations we proposed that similar and correlated roughness pairing leads to more interdigitation and contacts at the interface leading to better geometric fit in obligates. We propose that roughness information can find useful application in improving machine learning based complex type classifiers and filtering protein-protein docking solutions.
Keywords: fractal dimension, surface roughness, protein-protein interface, obligate complex, non-obligate complex
Background
Protein-protein interactions (PPI) in living cells mediate numerous if not most biological processes. Structural data, when available for such protein complexes, could enable us to model the underlying molecular mechanism of such interactions. Such models could be potentially helpful for predicting protein function by identifying the complex type. Two different types of protein complexes can be distinguished on the basis of protomer affinity. In an obligate interaction, the protomers are not found as stable structures on their own in vivo. Such complexes are generally also functionally obligate. Most homodimers and some heterodimers belong to this category. Non-obligate interactions are those whose protomers exist independently. The components of such proteinprotein complexes are often initially not co-localized and thus need to be independently stable. Protein complexes are also categorized as permanent and transient according to their lifetime in vivo. Structurally and functionally obligate interactions are also mostly permanent and non-obligatory interactions can be transient or weaker (compared to obligatory interactions) .Transient interactions are more stable compared to the weaker ones and requires a molecular trigger for association or dissociation in vivo.
Previous workers like Ofran and Rost [1] analyzed six types of protein complexes, including homo-obligomers and hetero-obligomers. Nooren and Thornton [2] studied homo and heterodimeric transient protein complexes. This study revealed that transient complex interfaces have lesser area, are more planar and polar compared to those homodimers which show permanent and stable interactions. Block et. al identified several physiochemical interface descriptors [3] and used machine learning techniques to classify permanent and transient complexes. The first breakthrough in classifying permanent and transient complexes was achieved by Mintseris and Weng using atomic contact vectors [4] as a structural descriptor. Dey et. al [5] compiled a nonredundant set of 82 obligatory and 30 non-obligatory complexes to compare their structural properties. Among the various differences in interface properties, obligates showed somewhat better shape complementarity at the interfaces compared to non-obligates using Colman's method. The differences in interface area as well as residue propensities were only marginally different for the two types of complexes. Zhu et.al [6] used a non redundant training set and six interface properties to train a Support vector machine to classify obligate, non-obligate and crystal packing interactions. Zhu's NOXclass classifier achieved a remarkable accuracy of 91.8% in classifying obligates from non-obligates. Of the various interface properties Gap volume and gap volume index were studied as a measure of shape complementarity. In accordance with previous studies obligate complexes show better geometric complementarity over non-obligate ones.
Protein surface roughness is a structural property, which was shown to be associated with binding surfaces. Surface roughness can be quantified by the Fractal dimension (D), which denotes the rate of change in the proteins surface area with respect to the yardstick or probe size used to measure it. It is defined in equation 1 (see supplementary material) as described elsewhere [7, 8] . From a study of surface roughness study Lewis & Rees [7] and Aqvist & Tapia [8] postulated that oligomeric protein-protein interfaces were rough compared to the other regions of the protein chain. In a similar study Pettit & Bowie [9] used a smoothened atomic fractal dimension (SAFD) to measure protein surface roughness. As the measurement of individual surface area of atoms is prone to statistical error, The SAFD calculates the roughness around each atom by smoothing over its neighborhood. The SAFD (fi) is defined in equation 2 (see supplementary material).
Analyzing the active site SAFD of a small data set (26 complexes), they came to an almost opposite conclusion that oligomeric interfaces are not much rougher than non interfacial regions of the complexes, particularly when the interface area is 600Å2 or more. On the other hand small molecule binding pockets showed significantly higher surface roughness values. In a later work Pettit et. al used SAFD in a neural network based protein functional site prediction software, HOTPATCH [10]. Toufic et. al [11] used fractal dimension as one of the structural descriptors for the characterization and prediction of different protein-RNA binding sites. Protein-RNA interface residues were found to be rougher compared to the non-interfacial ones. In another study the SAFD and Fractal Dimension were used to evaluate the accuracy of protein homology models [12]
From the previous studies it became apparent that surface roughness has an important role in molecular recognition. However, earlier studies were performed on limited number of complexes and no discrimination was made between obligates and non-obligates. This motivated us to probe the role of surface roughness, in obligate and non- obligate interactions. We specifically studied if SAFD is a discriminating feature for these two types of complexes and if so, whether it could possibly provide a plausible mechanism for complex formation. We hypothesized that similar interface roughness pairing would provide more interdigitation leading to better geometric fit in obligates and vice versa in non-obligates. We tested our hypothesis against well characterized high quality benchmarked datasets of obligates and non-obligates. The correlations (or lack of it) between the roughness values of interacting chains in two types of complexes substantiated our hypothesis.
Methodology
Generation of obligate and non-obligate dataset
Most homodimeric proteins fall into the obligate category. Obligate homodimers are also in most cases symmetric in a way, that the interface contains equivalent atoms belonging to the same surfaces of the protomers. Such symmetric homomeric obligates were excluded from our study. Because, in such complexes, the difference in interface SAFD would be essentially zero, making it unsuitable for this analysis. Therefore our dataset comprised of heteromeric subunits only. For obligates, a subset of heteromeric complexes from the dataset of Mintseris & Weng [13] were considered. This dataset of permanent complexes was an extension of [4] and was generated by automated means. From this set we chose binary complexes having no more than 30% sequence identity between protomers. We rejected complexes having ligands in the interfaces, as described in [6]. To select obligates we subjected the rest of the complexes to the NOXclass multistage classifier [6] which has high prediction accuracy. The NOXclass features used for classification include interface area, interface area ratio, area-based amino acid composition, correlation between interface and protein surface and gap volume index. Complexes that were predicted to be obligate with greater than 55 % certainty were accepted. Finally a total of 52 obligate complexes were considered (Table 1a: Supplementary data). For the non-obligate protein complexes, the entire NOXclass [6] non-obligate data set was taken, comprising of 62 hetero complexes (Table 1b: Supplementary data). All the PDB files corresponding to the data sets were downloaded and ’ATOM‘ records of complexes and individual chains were written into separate files.
Calculation of SAFD values
We used “Ezprot 2.2”, a free suite of programs, developed by Frank Pettit [14] to calculate SAFD, and interface residues.
Finding interface residues
To identify the amino acids at the interface of each chain, the ’listoligface‘ program which comes along the Ezprot suite was used. ’listoligface‘ reads one or more protein complex , and for each chain, identifies any oligomeric interfaces; the output is a list of which residues on each chain contact which neighboring chains. Here, a ’neighboring chain‘ is defined as any chain within a fixed distance to any heavy atom on a different chain. We used the default fixed distance of 4.2 Angstroms. This method is akin to one of the methods described in [5] for defining interface residues using a lenient accessible surface area change criterion.
Calculation of Fractal dimension
To calculate the fractal dimension of each atom, and to remove the statistical error, the program ’rufness‘ calculates the SAFD for each atom of the protein according to equation (2). In the default option the probe radius is 1.4 Å and the small change in probe radius to be used for calculating areas and fractal dimension is 0.1 Å. We used these default values in all our calculations. The ’rufness‘ program can optionally calculate the SAFD for solvent exposed atoms only. We used this feature to calculate the atomic SAFD averaged over all neighboring atoms that were solvent exposed and not buried. The SAFDi values for each exposed atom of all the amino acid residues present at the interface, of each chain were calculated, and averaged to get the average SAFD (ISAFD) of the chain interface atoms. Gap volume Index (GVI) is a measure of interface geometric complementarity, was calculated using the NOXclass server [6]. A lesser value of GVI indicated better shape or geometric complementarity at the interface.
Statistical analysis
Graphical and statistical analysis of SAFDs, viz. Box plots, correlation coefficient and t-test calculations were done using the ’R‘ software suite. Correlation plots were made using Microsoft Excel.
Discussion
Interacting protein chains in different complexes
In this study a total of 52 obligate and 62 non-obligate heteromeric complexes of high resolution were used from curated benchmark data sets. [6,13]
Interface SAFD values of obligates and non-obligates
The interface averages SAFD (ISAFD) of the two protomers in the two types of complexes were studied using boxplots and unpaired ttest (Figure 1). For the obligate complexes, the ISAFD ranged from 2.94 to 3.45, the median value being 3.18. For the non-obligates the ISAFD ranged from 2.84 to 3.77, the median value being 3.15. However the spread of ISAFD values is a little more in non-obligates. The two tailed unpaired t-test gave P value of 0.4689, considered insignificant. The boxplots and statistics show that the median ISAFD values of protomers didn't differ in two types of complexes and the distributions of roughness values are quite close. The median interface roughness values comes close to the average value of 3.12 reported by Pettit [9] for large functional sites (interface area >600 Å2)
Figure 1.
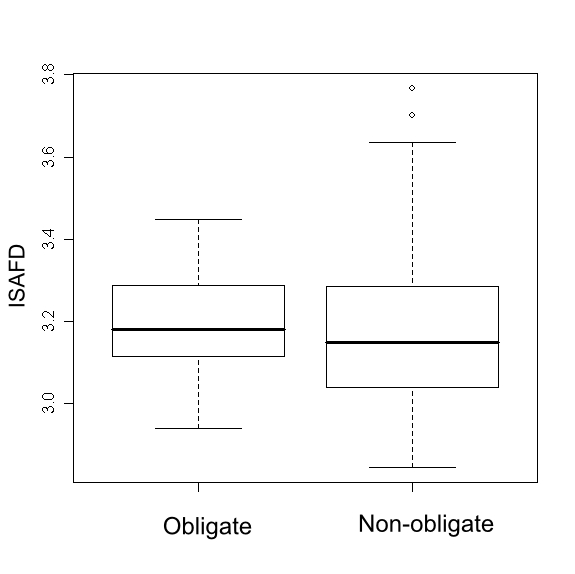
The interface average SAFD (ISAFD) values observed in obligates and non-obligates
ISAFD differences between chains in obligates and non-obligates
For the two types of complexes, the absolute differences of ISAFD (d- ISAFD) between the protomers were calculated, and analyzed by boxplots and unpaired t-test (Figure 2). The median d-ISAFD values for obligate and non-obligates are 0.109 and 0.179 respectively. Thus there was a noticeable, more than 1.6 fold increase in the median value of ISAFD between protomers for non-obligates over obligates. The two tailed unpaired t-test gave P value ≪ 0.0001, considered highly significant. This indicates that in obligates the interface roughness difference is much less than that of non-obligates. As a result a tight distribution of d-ISAFD values in obligates was seen in the plot. In non-obligates, d-ISAFD values were much scattered, indicating the two chains of the complex had a wide range of interface roughness.
Figure 2.

The difference in ISAFD (d-ISAFD) between protomers in obligates and non obligates
Correlation of protomer ISAFD in obligates and non-obligates
Correlations between the ISAFD of protomers in both types of complexes were quantified by Pearson correlation coefficient. A high positive correlation coefficient of 0.621 (P value ≪ 0.0001, considered highly significant) was observed between the interface SAFD values of the two chains involved in obligatory interactions. The correlation coefficient for non-obligates was 0.027(P value 0.84, considered not significant), which was negligible when compared with obligates. This showed that there was practically no correlation of roughness between the non-obligatory chains. A visual inspection of the scatter plots (Figure 3, 4) also revealed that the chains in obligates have more correlated surface roughness with respect to non-obligates.
Figure 3.

Correlation plot of ISAFD values between protomers in obligate complexes
Figure 4.

Correlation plot of ISAFD values between protomers in non-obligate complexes
Our study showed the predominant preference of protomers of similar roughness to form obligate interactions. From correlation studies, it is apparent that in obligates, the increase or decrease in roughness in one of the protomers is also reflected in its binding partner by a proportional increase or decrease of roughness. The underlying mechanism can be described by Figure 5. The surfaces of protomers of similar roughness can interdigitate well to form better geometric fit (Figure 5: I, II). Given that the roughness values are similar, rougher protomers can geometrically fit well, leaving lesser gap at the interface, just as well the two protomers with comparatively smooth interfaces can fit together. This type of protomer pairings are observed in our obligate data set. On the other hand, protomer surfaces with marked difference in interface roughness can't interdigitate well, resulting in poor geometric fit with more gaps in the interface. The later explains the case of non-obligates (Figure 5: III, IV). This structural model is in accordance with the better shape complementarity observed in obligates over non-obligates [5,6, 15].The average GVI for our obligate data set was 2.15 as compared to 5.3 for the non-obligate set [6] indicating better geometric fit in obligate complexes. This further corroborates our proposed mechanism. In obligates the correlation allows the chains to preserve structural complementarity as the roughness of one protomer is changed, unlike the non-obligates. The proposed model also explains the more number of contacts observed at obligate interfaces over non-obligates [5]. Evidently, chances of having more contacts are more for rough/rough or smooth/smooth association, compared to a rough/smooth association.
Figure 5.

Preferential pairing of rough(R) and smooth(S) interfaces in obligates (I, II) and non-obligates (III, IV). R-R and S-S pairings are favored in obligates, whereas non-obligates prefer R-S type association.
Shape complementarity, in form of GVI, was successfully used as one of the six descriptors in NOXCLASS [6] to characterize complex types by a Support vector machine, achieving 91.8% accuracy. In our study too we have obtained high discriminatory values of correlation coefficients (0.621, 0.027) and median d-IASFD values (0.0109 and 0.179) for obligate and non-obligates respectively. We propose that the difference in interface SAFD (d-ISAFD) can be used as a discriminatory feature for classification of complexes along with other descriptors.
Conclusion
We studied interface roughness properties of a high quality, nonredundant obligate and non-obligate heteromeric protein complex dataset. We found that subunits with similar roughness values at the interfaces tend to form obligate complexes, and those with different values tend to form non-obligate complexes. One of the essential features of obligate complexes is the better geometric fit between the protomers. Our structural model provides an explanation of such complementarity from observed similar and correlated roughness pairing of subunits with better interdigitation at the interface. The model also explains the observed higher interface contacts in obligates compared to non-obligates. There are a few practical implications of our findings. Firstly, along with various other surface based descriptors interface roughness property can be used to discriminate among heteromeric obligate and non-obligate complexes and thus can further improve the performance of existing classifiers. This could be an important tool for protein function prediction in a structural genomics framework. Secondly, preferential roughness pairing can be used to filter out wrong candidates in computational protein-protein docking when the type of protein complex is known beforehand, viz. from biological data. Thirdly, protein design experiments can also benefit from these findings for designing appropriate binding interfaces.
Supplementary material
Acknowledgments
The authors thank the authorities of Birla Institute of Technology (Mesra, Ranchi), Calcutta Center, for kindly providing the infrastructure to carry out part of this research. IB did a part of this work for her Masters thesis at BIT, Calcutta under the guidance of SR (ex-lecturer, BIT).
Footnotes
Citation:Bera & Ray, Bioinformation 4(5): 210-215 (2009)
References
- 1.Ofran Y, Rost B. J Mol Biol. 2003;325:377. doi: 10.1016/s0022-2836(02)01223-8. [DOI] [PubMed] [Google Scholar]
- 2.Nooren IM, Thornton JM. J Mol Biol. 2003;325:991. doi: 10.1016/s0022-2836(02)01281-0. [DOI] [PubMed] [Google Scholar]
- 3.Block P, et al. Proteins. 2007;68:170. doi: 10.1002/prot.21296. [DOI] [PubMed] [Google Scholar]
- 4.Mintseris J, Weng Z. Proteins. 2003;53(3):629–639. doi: 10.1002/prot.10432. [DOI] [PubMed] [Google Scholar]
- 5.De S, et al. BMC Struct Biol. 2005;5:15. doi: 10.1186/1472-6807-5-15. [DOI] [PMC free article] [PubMed] [Google Scholar]
- 6.Zhu H, et al. BMC Bioinformatics. 2006;7:27. doi: 10.1186/1471-2105-7-27. [DOI] [PMC free article] [PubMed] [Google Scholar]
- 7.Lewis M, Rees DC. Science. 1985;230:1163. doi: 10.1126/science.4071040. [DOI] [PubMed] [Google Scholar]
- 8.Aqvist J, Tapia O. J Mol Graph. 1987;5:30. doi: 10.1016/0263-7855(92)80065-l. [DOI] [PubMed] [Google Scholar]
- 9.Pettit FK, Bowie JU. J Mol Biol. 1999;285:1377. doi: 10.1006/jmbi.1998.2411. [DOI] [PubMed] [Google Scholar]
- 10.Pettit FK, et al. J Mol Biol. 2007;369:863. doi: 10.1016/j.jmb.2007.03.036. [DOI] [PMC free article] [PubMed] [Google Scholar]
- 11.Toufic F, et al. Int J Data Min Bioinform. 2009 In press. [Google Scholar]
- 12.Chakravarty S, et al. Nucleic Acids Res. 2005;33:244. doi: 10.1093/nar/gki162. [DOI] [PMC free article] [PubMed] [Google Scholar]
- 13.Mintseris J, Weng Z. Proc Natl Acad Sci USA. 2005;102:10930. doi: 10.1073/pnas.0502667102. [DOI] [PMC free article] [PubMed] [Google Scholar]
- 14. http://www.doe-mbi.ucla.edu/~pettit/Ezprot/ezpl_page.htm.
- 15.Jones S, Thornton JM. Proc Natl Acad Sci USA. 1996;93:13. doi: 10.1073/pnas.93.1.13. [DOI] [PMC free article] [PubMed] [Google Scholar]
Associated Data
This section collects any data citations, data availability statements, or supplementary materials included in this article.