Abstract
Purpose
Surgeons routinely evaluate and modify their surgical technique in order to improve patient outcome. It is also common for surgeons to analyze results before and after a change in technique to determine whether the change did indeed lead to better results. A simple comparison of results before and after a surgical modification may be confounded by the surgical learning curve. Here, we aim to develop a statistical method applicable to the analysis of before / after studies in surgery.
Materials and Methods
We used simulation studies to compare different statistical analyses of before / after studies. We evaluated a simple two group comparison of results before and after the modification by chi squared, and a novel bootstrap method that adjusts for the surgical learning curve.
Results
In the presence of the learning curve, a simple two group comparison almost always found an ineffective surgical modification to be of benefit. If the surgical modification was harmful, leading to a 10% reduction in success rates, a two group comparison nonetheless reported a statistically significant improvement in outcome about 80% of the time. The bootstrap method had only moderate power, but did not find ineffective surgical modifications of benefit more than would be expected by chance.
Conclusions
Simplistic approaches to the analysis of before / after studies in surgery can lead to grossly erroneous results under a surgical learning curve. A straightforward alternative statistical method allows investigators to separate the effects of the learning curve from those of the surgical modification.
Keywords: research design, surgery, evaluation studies
Introduction
Surgeons routinely evaluate and modify their surgical technique in order to improve patient outcome. It is also common for surgeons to analyze results before and after a change in technique to determine whether the change did indeed lead to better results. For example, Poulakis et al. report on a series of 182 men with high risk prostate cancer treated by laparoscopic radical prostatectomy. Several modifications to surgical technique were implemented after the 71st patient was treated and the authors report that the rate of positive surgical margins reduced from 28% before the change, to 10% afterwards (p<0.001).1 Similarly, Chuang and colleagues introduced two changes to radical prostatectomy - early release of the neurovascular bundle, and early release under magnification – and reported that potency rates rose from 40.5% for unmodified surgery, to 54.8% and 66.1% after the two successive modifications were introduced2.
These “before / after” studies do not involve randomization of patients to the different types of operation and are therefore prone to the biases known to be associated with non-randomized trials. These include differences in case mix and in medical treatments adjunctive to surgery. A unique problem for before / after studies in surgery is the surgical learning curve. It is widely assumed that a surgeon’s results improve with increasing experience with a particular procedure4 and there is now compelling empirical evidence that this is indeed the case. Numerous studies have documented that technical aspects of a procedure, such as operating time5, blood loss6 or rates of conversion to open surgery7, improve with greater surgical experience. Data are also emerging that clinical outcomes also improve. For example, we recently reported a learning curve for cancer recurrence after radical prostatectomy for prostate cancer, with dramatically decreased recurrence rates for experienced surgeons 3. Figure 1 shows the learning curve specifically for patients with organ-confined disease8.
Figure 1.
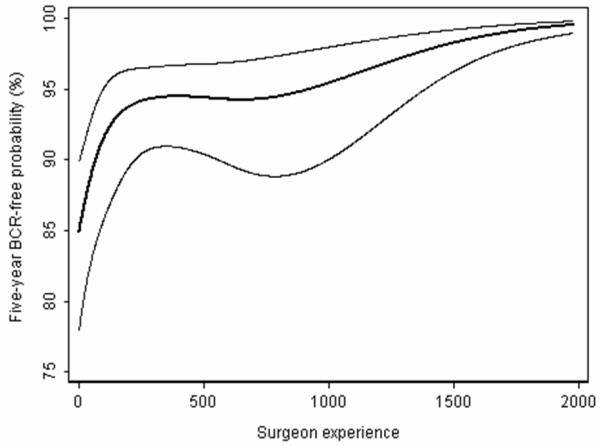
The learning curve for cancer control after radical prostatectomy for patients with organ confined disease. The graph gives the predicted probability of freedom of biochemical recurrence at 5 years with increasing surgeon experience. Thin lines are 95% confidence intervals.
If a surgeon’s results are continually improving as cases accrue, results will differ either side of any randomly picked point in time. If that point in time corresponds to when a modification was made to surgical technique, it will appear as though the change in surgical technique resulted in a change in outcome, even if it had no effect.
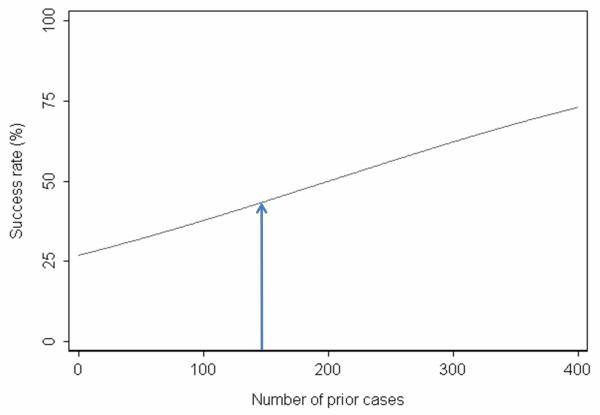
Figure 2 shows a hypothetical learning curve for a surgeon, showing on the x axis the number of cases and on the y axis the success rate (which could either be a patient outcome or a process measure, such as time of operation less than 180 minutes). The success rate was 35% for patients treated before 150 prior cases, and 50% for patients treated afterwards (absolute difference 15%, p=0.03). Now imagine that the surgeon made a change in technique at 150 prior cases, and in truth the technique did not impact outcome. We would still observe an improvement in success rates of 15% due to the learning curve. Without proper adjustment for the learning curve, this improvement would be erroneously attributed to the surgical modification.
Figure 2.
Hypothetical learning curve. The arrow shows when an ineffective modification was made to surgical technique: due the learning curve, results after the modification are better than results before the modification, making the modification appear effective.
Materials and Methods
Motivating example: erectile dysfunction after radical prostatectomy
The motivating example for this paper comes from urologic oncology. A surgeon (JE) had modified his approach to radical prostatectomy in an effort to ameliorate erectile dysfunction, a common side-effect of this procedure. He wanted to know whether his modification had led to improvement in outcome.
Figure 3 shows the surgeon’s results up to the time where he made the modification. The x axis gives the number of consecutive cases; the y axis gives the potency rates at 6 months after adjustment. The line was calculated using logistic regression with potency as the outcome, number of cases since the start of the cohort as the predictor, and age and nerve sparing (a strong predictor of postoperative erectile function) as covariates. Results are clearly improving over time, suggesting that the surgeon is indeed experiencing a learning curve. The dashed line in figure 3 shows how we predict potency rates would have changed had the surgeon not modified his technique.
Figure 3.
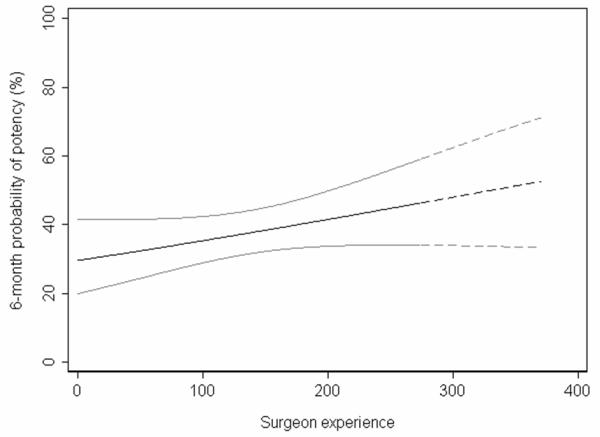
Learning curve for 6-month potency based on old technique. Solid line represents the cases receiving the old technique. Dashed line represents the predicted outcome of cases receiving the modified technique, had they received the old technique. Gray lines are 95% confidence intervals.
The potency rate before the modification (n=275) was 38%. Now if the modification was totally ineffective, we predict on the basis of the learning curve that the potency rate in the 97 patients treated after the modification would be around 50%. A comparison of 38% in 275 patients to 50% in 97 patients is statistically significant (p<0.005). As a result, a before / after comparison would often conclude that an ineffective surgical modification improved outcome.
Adjusting for the learning curve in before / after studies
One idea for how to adjust for the learning curve in before / after studies would be to fit a logistic regression model with an indicator of surgical modification as the predictor, and the number of cases since the start of the cohort as a covariate (along with other variables known to be associated with outcome). The immediate problem with this analysis is that the predictor and the covariate are correlated: for example, if the modification occurs near the middle of the series, the correlation between the modification and number of cases since the start of the cohrot will be around 0.85. When two variables are highly correlated, it is very difficult to differentiate between the two statistically.
Given the surgical learning curve, our question is not “Do results improve after the change in surgical technique?” but “Are results after the change better than expected?”. Figure 4 shows the actual results after the change in surgical technique. To obtain this line, we applied a logistic regression to data obtained after the surgical modification was implemented, again using potency rates as the dependent variable and the number of cases since the modification, age and nerve sparing as predictors. The actual outcomes appear superior to those expected on the basis of the learning curve.
Figure 4.
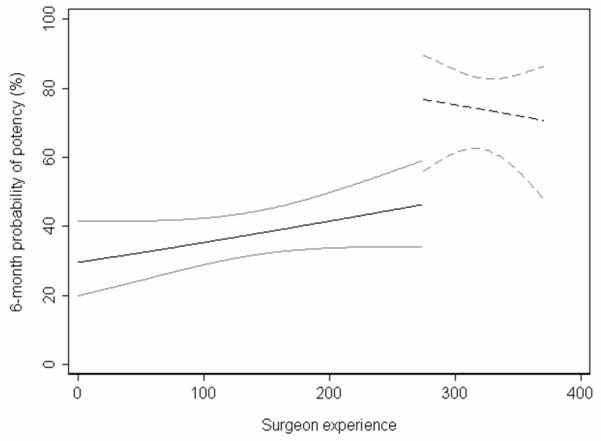
6-month potency for patients receiving the old technique (solid line) and those receiving the new technique (dashed line). Gray lines are 95% confidence intervals.
Before we can conclude that results really do improve, we need to calculate a p value; we would also like 95% C.I. around our estimate of how much the technique improves outcome. To obtain these statistics, we used a statistical technique called bootstrapping. To illustrate bootstrapping, imagine that we had sampled 1000 medical school applicants, taking data on age and gender. We then create a new, artificial group of 1000 by randomly sampling from this data set. Because an applicant can be sampled more than once (or not at all) this is known as “bootstrap resampling with replacement”. The gender ratio and average age of the new data set is likely to be close to that of the original sample. This new “bootstrap sample” gives us an example of what our results might have been had we repeated the study. If we take a large number of bootstrap samples (2,000 – 10,000 is typical) we get a range of possible study results. These might be analyzed to conclude that, for example, although in our study, 58% of our applicants were women, “if we had run the study a large number of times, 95% of the time, the proportion of women would have been between 55% and 61%”. As it turns out, we do not have to run a bootstrap to obtain these numbers because there is a simple formula for the confidence interval around a proportion. A bootstrap is helpful when the formula for a particular statistic is difficult to specify.
For our before / after study in surgery, we use bootstrapping to obtain the p value and 95% C.I. as follows. First, we define two groups, patients treated before the modification (group 1) and those treated afterwards (group 2). Cases are then numbered consecutively in date order from the very first case in the cohort. We then follow the following steps.
Bootstrap resample with replacement from group 1 (those receiving surgery before the modification).
Generate a regression model on the bootstrap sample with the outcome of interest as the dependent variable and the number of cases as the predictor. Non-linear terms can be used, if desired, so that the learning curve need not follow a straight line. Covariates, such as patient age, or disease severity at baseline, can also be added to the statistical model.
Bootstrap resample with replacement from group 2 (those receiving modified surgery).
Use the regression model generated in step (2) to calculate the predicted outcome for bootstrapped sample of patients created in step (3).
- Calculate the mean difference between the predicted and actual outcome for patients in group 2. Formally, we define S as the estimated change in outcome attributable to the surgical modification, Y as the actual outcome and p̂ as the predicted outcome. For the i patients in group 2, we then compute:
Repeat steps (1) to (5), 10,000 times, recording the value for S, the mean difference between predicted and actual outcome.
- 7. Calculate statistics as follows:
- The estimate for the change in outcome attributable to the surgical modification as the mean value of S over all replications
- The standard error of S, denoted by SE (S), is given by the standard deviation of S over all replications.
- The 95% confidence interval is given by S ± 1.96 × SE (S).
- The test statistic S / SE (S) can be related to a standard normal distribution to obtain the P value associated with null hypothesis of no change in outcome
Application of the method to hypothetical data
To evaluate our statistical method further, we applied it to the hypothetical data set shown in figure 2. We assumed that the surgeon had changed surgical technique at the mid-point of the series and that doing so had either: a) had no effect; b) immediately reduced success rates by 10% or c) immediately improved success rates by 10% or 20%. We simulated data sets, applied one or other of these effects, and then applied our bootstrap method.
Results
The results for 2,000 replications of the simulated data set are given in table 1 alongside the results for a simple before and after comparison by a chi squared test. The results for the first row – where the modification is ineffective – give the false positive rate or “size” of the test. For a one-sided test (i.e. statistically significant improvement), this is expected to be 2.5%. The results for the second and third rows give the power of the test.
Table 1. Analysis of a hypothetical surgical study with a learning curve.
Proportion of results in favor of the surgical modification at p<0.05. Where the effect of the surgical modification is zero, or a decrease in success rates, this proportion is the size (or false positive rate) of the test. Where the effect of the modification is a 10% or 20% improvement in success rates, the proportion of positive results constitutes the power of the test.
| Effect of surgical modification | Simple before after comparison |
Bootstrap technique single surgeon |
Bootstrap technique three surgeons |
|---|---|---|---|
| None | 0.999 | 0.024 | 0.042 |
| Improve success rates by 10% | 1.000 | 0.116 | 0.494 |
| Improve success rates by 20% | 1.000 | 0.393 | 0.999 |
| Decrease success rates by 10% | 0.814 | 0.004 | 0.001 |
As can be seen, the size of the bootstrap test is reasonable: when there is no effect of the surgical modification, one would conclude that the modification significantly improved potency only 2.4% of the time, close to ideal. In contrast, the simple before/after comparison has a size of 99.9%, in other words, nearly 100% of analyses conducted using the simple before /after comparison would conclude that an ineffective modification was effective. Table 1 also suggests that a simple before / after comparison would give us an 80% probability of leading us to conclude that a harmful modification was in fact beneficial. The power of the bootstrap test is moderate (12% and 40%, respectively, when improving success rates by 10% and 20%), but it will not fool us into concluding that an ineffective or harmful modification improves outcomes.
In our view, the problem with power is not a matter of the test, but of the data: it is inherently difficult to use a single surgeon series to demonstrate that a surgical modification leads to an improvement in outcome. This is analogous to clinical trials, where studies attempting to identify small but worthwhile effects – as would be the case with a surgical modification – generally involve large numbers of patients at multiple institutions. We repeated the simulation studies including three surgeons. The learning curve for each surgeon was modeled separately; predictions made for each patient treated after the modification were calculated using the unique learning curve of the patient’s surgeon. As can be seen from the table, power is improved.
Discussion
We have described a method for the analysis of before / after studies in surgery, where a surgeon wants to know whether a change in technique has led to a change in outcome. That said, whatever the level of statistical sophistication that we apply to this type of study, it remains a non-randomized design, and thus subject to several potential biases. First, although the method can control for slowly developing trends over time, it cannot adjust for rapid changes in medical practice occurring after the surgical modification. In our potency study for example, had the surgeon modified technique in 1997, the introduction of Viagra in 1998 would have biased results in favor of the modification. Second, only randomization can adequately address the possibility of baseline differences between groups. In our potency example we adjusted for age, but no such statistical adjustment is perfect, and age is only a moderate predictor of potency.
Third, since the shape of the learning curve can vary, the test is sensitive to how well the true learning curve is modeled. Consider the scenario depicted in Figure 5. The solid black line shows the true learning curve before the surgical modification. This learning curve is non-linear, that is, it is steeper in the earlier part of the learning curve and starts to flatten out past 200 cases. With the introduction of an effective surgical modification at 200 prior cases, we would expect an improvement in outcome similar to that depicted with the dashed black line. However, if the bootstrap test was implemented by modeling the learning curve as linear, rather than non-linear, the expected outcome past 200 cases would be higher than that observed. In this case, since the true learning curve was not correctly modeled, one might falsely conclude that the modification was ineffective – or perhaps even harmful.
Figure 5.
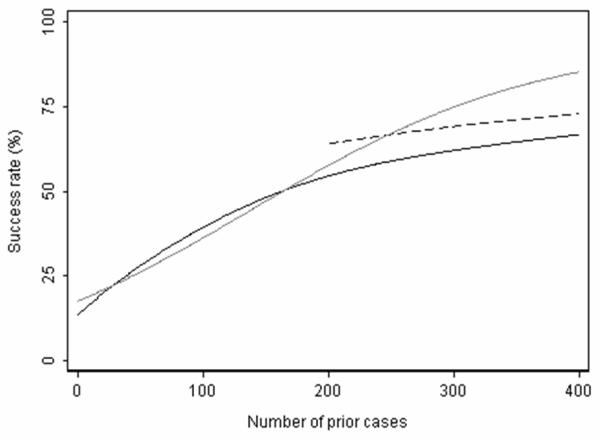
Hypothetical learning curve. Solid black line represents the learning curve in the absence of the modification, which starts to flatten out after 200 prior cases. Dashed line represents outcome after the modification: clearly the modification is effective. Gray line represents the expected learning curve in the absence of the modification. In this case, use of learning curve methodology would falsely conclude that the modification was harmful or ineffective.
Fourth, the size (false positive rate) of the bootstrap test is sensitive to the steepness of the learning curve. We conducted additional simulations to examine this phenomenon: the size of the bootstrap test was lower than our main analysis with a steeper learning curve (0.8%), and was higher with a flatter learning curve (4.1%). Therefore, the size of the bootstrap test may be anticonservative with a flat learning curve. We consider this to be a small cost compared to the gross errors associated with the simple before/after comparison, which had a size >99%.
Randomized trials comparing different approaches to surgery are all too rare As such, we would like to re-emphasize the importance of randomized trials, and encourage the surgical community to conduct more such studies. Nonetheless, randomized studies can be difficult and expensive, and generally require preliminary data. Accordingly, surgeons will continue to conduct studies comparing results before and after a change in surgical technique.
Conclusions
We have shown that if surgeons’ results improve with experience, a simple comparison of results before and after a change in surgical technique would likely tell us that an ineffective modification, or even a harmful one, was of benefit. A straightforward alternative is to use regression modeling to compare observed with expected results. This method can help control for the learning curve and thus provide more accurate estimates of the effects of changing surgical technique.
Acknowledgments
Supported in part by funds from David H. Koch provided through the Prostate Cancer Foundation, the Sidney Kimmel Center for Prostate and Urologic Cancers and P50-CA92629 SPORE grant from the National Cancer Institute to Dr. P. T. Scardino.
References
- 1.Poulakis V, de Vries R, Dillenburg W, et al. Laparoscopic radical prostatectomy: impact of modified apical and posterolateral dissection in reduction of positive surgical margins in patients with clinical stage T2 prostate cancer and high risk of extracapsular extension. J Endourol. 2006;20:332. doi: 10.1089/end.2006.20.332. [DOI] [PubMed] [Google Scholar]
- 2.Chuang MS, O’Connor RC, Laven BA, et al. Early release of the neurovascular bundles and optical loupe magnification lead to improved and earlier return of potency following radical retropubic prostatectomy. J Urol. 2005;173:537. doi: 10.1097/01.ju.0000148941.57203.ec. [DOI] [PubMed] [Google Scholar]
- 3.Vickers AJ, Bianco FJ, Serio AM, et al. The surgical learning curve for prostate cancer control after radical prostatectomy. J Natl Cancer Inst. 2007;99:1171. doi: 10.1093/jnci/djm060. [DOI] [PubMed] [Google Scholar]
- 4.Treasure T. The learning curve. BMJ. 2004;329:424. doi: 10.1136/bmj.38176.444745.63. [DOI] [PMC free article] [PubMed] [Google Scholar]
- 5.Ito M, Sugito M, Kobayashi A, et al. Influence of learning curve on short-term results after laparoscopic resection for rectal cancer. Surg Endosc. 2009;23:403. doi: 10.1007/s00464-008-9912-1. [DOI] [PubMed] [Google Scholar]
- 6.Tseng JF, Pisters PW, Lee JE, et al. The learning curve in pancreatic surgery. Surgery. 2007;141:694. doi: 10.1016/j.surg.2007.04.001. [DOI] [PubMed] [Google Scholar]
- 7.Gill J, Booth MI, Stratford J, et al. The extended learning curve for laparoscopic fundoplication: a cohort analysis of 400 consecutive cases. J Gastrointest Surg. 2007;11:487. doi: 10.1007/s11605-007-0132-0. [DOI] [PMC free article] [PubMed] [Google Scholar]
- 8.Vickers AJ, Bianco FJ, Gonen M, et al. Effects of pathologic stage on the learning curve for radical prostatectomy: evidence that recurrence in organ-confined cancer is largely related to inadequate surgical technique. Eur Urol. 2008;53:960. doi: 10.1016/j.eururo.2008.01. [DOI] [PMC free article] [PubMed] [Google Scholar]
- 9.Begg CB, Riedel ER, Bach PB, et al. Variations in morbidity after radical prostatectomy. N Engl J Med. 2002;346:1138. doi: 10.1056/NEJMsa011788. [DOI] [PubMed] [Google Scholar]
- 10.Birkmeyer JD, Stukel TA, Siewers AE, et al. Surgeon volume and operative mortality in the United States. N Engl J Med. 2003;349:2117. doi: 10.1056/NEJMsa035205. [DOI] [PubMed] [Google Scholar]
- 11.Srougi M, Paranhos M, Leite KM, et al. The influence of bladder neck mucosal eversion and early urinary extravasation on patient outcome after radical retropubic prostatectomy: a prospective controlled trial. BJU Int. 2005;95:757. doi: 10.1111/j.1464-410X.2005.05395.x. [DOI] [PubMed] [Google Scholar]
- 12.Salonia A, Suardi N, Crescenti A, et al. Pfannenstiel versus vertical laparotomy in patients undergoing radical retropubic prostatectomy with spinal anesthesia: results of a prospective, randomized trial. Eur Urol. 2005;47:202. doi: 10.1016/j.eururo.2004.07.025. [DOI] [PubMed] [Google Scholar]
- 13.Wagner AA, Varkarakis IM, Link RE, et al. Comparison of surgical performance during laparoscopic radical prostatectomy of two robotic camera holders, EndoAssist and AESOP: a pilot study. Urology. 2006;68:70. doi: 10.1016/j.urology.2006.02.003. [DOI] [PubMed] [Google Scholar]


