

Abstract
Stromal derived factor-1α (SDF-1α) is an important chemokine in stem cell trafficking and plays a critical role in the homing of bone marrow stromal (BMS) cells. However, its use in tissue regeneration is limited by its relatively short half-life and the time-dependent nature of cell homing to the site of injury. The objective of this work was to investigate the release characteristics of SDF-1α from degradable poly (lactide ethylene oxide fumarate) (PLEOF) hydrogels and to determine the effect of sustained release of SDF-1α on migration of BMS cells. Three PLEOF hydrogels with poly(L-lactide) (PLA) fractions of 6, 9, and 24% by weight were synthesized. After the addition of chemokine, the polymerizing mixture was crosslinked to produce SDF-1α loaded PLEOF hydrogels. The hydrogels were characterized with respect to sol fraction, water uptake, degradation, SDF-1α loading efficiency and release kinetics, and migration rate of bone marrow stromal (BMS) cells. The more hydrophilic hydrogels with 6 and 9% PLA fraction had a pronounced burst release followed by a period of sustained release by diffusion for 21 days. The more hydrophobic hydrogel with 24% PLA fraction had a less pronounced burst release and displayed a slow but constant release by diffusion between days 1–9 followed by a fast release by diffusion-degradation from days 9 to 18. The fraction of active SDF-1α released from 6, 9, and 24% hydrogels after 21 days was 34.3, 32.3, and 35.8%, respectively. The migration of BMS cells in response to time-released SDF-1α closely followed the protein release kinetics from the hydrogels. The biodegradable PLEOF hydrogel may potentially be useful as a delivery matrix for sustained release of SDF-1α in the proliferative phase of healing for recruitment of progenitor cells in tissue engineering applications.
Keywords: Biodegradable hydrogel, Stromal derived factor-1α, Release kinetics, Marrow stromal cells, Cell migration
1. Introduction
Stromal derived factor–1α (SDF-1α) is a member of the CXC chemokines, constitutively secreted from the marrow stromal cells and binds to cell surface CXCR4 receptors for its biological function (Zhong, Law et al. 2004). It is an important chemokine in stem cell trafficking (Aiuti, Webb et al. 1997) and plays a critical role in the biology and physiologic functions of bone marrow stromal (BMS) cells (Dar, Goichberg et al. 2005). For example, SDF-1α stimulates retention and maintenance of hematopoietic progenitor cells in bone marrow cell cultures, and pre-osteogenic cells express higher levels of SDF-1α compared to osteoblasts or osteocytes (Van Overstraeten-Schlogel, Beguin et al. 2006). Furthermore, labeled BMS cells transplanted intravenously in mice with a segmental bone graft are detected in the developing callus, demonstrating that circulating BMS cells play a role in cell recruitment in the early phase of bone repair (Kitaori, Ito et al. 2009). It has been shown that a gradient in SDF-1α can improve the penetration depth of BMS cells to the central part of tissue engineered scaffolds (Schantz, Chim et al. 2007). For example, CXCR4-overexpressed BMS cells invaded a collagen scaffold impregnated with 200 ng/mL SDF-1α to a depth of 500 µm, 5 days after subcutaneous implantation in mice (Thieme, Ryser et al. 2009). SDF-1α also modulates, via intracellular Smads and MAPK activation, osteogenic differentiation of BMS cells by bone morphogenetic protein-2 (Zhu, Boachie-Adjei et al. 2007). These results clearly demonstrate the important role of SDF-1α in the homing, osteogenesis as well angiogenesis of BMS cells.
Despite its vital role, the use of SDF-1α chemokine in tissue regeneration is limited by its relatively short half-life and the highly time-dependent nature of the homing of progenitor cells to the site of injury (Murphy, Cho et al. 2007). For example, the mRNA expression levels of SDF-1α peaked 2 weeks after a ligament injury and returned to the baseline level after 3 weeks (Shimode, Iwasaki et al. 2009). The delivery of SDF-1α is further complicated by rapid diffusion of the chemokine away from the intended site and enzymatic degradation. SDF-1α is degraded by Dipeptidyl Peptidase IV, a serine exopeptidase (Sierra, Yang et al. 2004; Segers, Tokunou et al. 2007) and matrix metalloproteinase-2 (MMP-2) (McQuibban, Gong et al. 2000; McQuibban, Butler et al. 2001) that are activated in the injured site. Thus, delivery systems that can gradually release SDF-1α in the proliferative phase of healing (first 2–3 weeks) for recruitment of stem/progenitor cells can significantly improve the efficacy of SDF-1α in tissue engineering applications.
Hydrogels are crosslinked polymeric structures which are able to swell in aqueous physiological solutions and retain a significant fraction of water in their structure without dissolving (Peppas and Bar-Howell 1986). Diffusivity of proteins in hydrogels is 4 to 5 orders of magnitude higher compared to hydrophobic polymers (Liang, Xu et al. 2006). Due to their high water content, hydrogels are an ideal carrier for sustained delivery of proteins (Yamamoto, Tabata et al. 2000; Pitarresi, Palumbo et al. 2003; Benoit, Collins et al. 2007; Huynh, Nguyen et al. 2008; Van Tomme, Storm et al. 2008) because they exhibit excellent biocompatibility and interact less strongly with immobilized biomolecules than hydrophobic materials. Thus, proteins immobilized within hydrogels are more likely to retain their biological activity (Shingel and Faure 2005). Natural hydrogels like heparinized collagen and PEGylated fibrin have been used for immobilization and slow release of SDF-1α chemokine (Zhang, Nakamura et al. 2007; Bladergroen, Siebum et al. 2009). Nearly half of the SDF-1α, immobilized in a heparinized collagen gel, was released in the first 24 h, followed by a much slower release of an additional 10% in the weeks thereafter (Bladergroen, Siebum et al. 2009). SDF-1α bound to a PEGylated fibrin patch was released at a constant rate for up to 10 days in-vitro and induced higher recruitment of cells within the infracted area 2 weeks after implantation (Zhang, Nakamura et al. 2007).
Recently, our laboratory has developed a novel amphiphilic macromer, poly(lactide ethylene oxide fumarate) (PLEOF), that can be crosslinked in the aqueous environment with redox or ultraviolet initiators to produce biodegradable hydrogels (He and Jabbari 2007). The lactide units are FDA-approved for certain clinical applications, ethylene oxide units can be excreted through the kidneys, and fumaric acid occurs naturally in the Kreb’s cycle (He, Timmer et al. 2001). The hydrogel crosslink density can be adjusted by the density of fumarate groups in PLEOF macromer. The water content and degradability can be tailored to a particular application by varying the molecular weight of the poly(L-lactide) (PLA) or the ratio of PLA to poly(ethylene glycol) (PEG) in the macromer (Sarvestani, He et al. 2007; Sarvestani, Xu et al. 2007). The degradation rate can be increased by crosslinking PLEOF with an enzymatic degradable crosslinker (He and Jabbari 2007).
The objective of this work was to investigate the release characteristics of SDF-1α from PLEOF hydrogels and to determine the effect of sustained release of SDF-1α on migration of BMS cells. PLEOF macromers with different PLA to PEG ratios were synthesized by condensation polymerization with fumaryl chloride with PLA and PEG. After the addition of chemokine, the PLEOF polymerizing mixture was crosslinked with a redox initiation system to produce the SDF-1α loaded hydrogel. The hydrogels were characterized with respect to sol fraction, water uptake, shear modulus, degradation in aqueous solution, loading efficiency, and the release kinetics of SDF1-α. Bioactivity were assessed by measuring the rate of migration of calcein acetxymethyl ester (calcein AM) labeled BMS cells in response to the released SDF-1α from the hydrogels using 8-µm pore size transwell plates.
2. Materials and methods
2.1. Materials
L-lactide monomer (LA; >99.5% purity by GC) was purchased from Ortec (Easley, SC). Fumaryl chloride (FuCl; Sigma-Aldrich; St. Louis, MO) was purified by distillation, and PEG (Sigma-Aldrich; nominal molecular weight of 3.4 kDa) was dried by azeotropic distillation from toluene. N, N-dimethylformamide (DMF) and diethylene glycol (DEG) were purchased from Acros Organics (Pittsburgh, PA). Precipitation solvents diethyl ether and hexane (anhydrous grade) were purchased from VWR (Bristol, CT). Deuterated chloroform (CDCl3), triethylamine (TEA), ammonium persulfate (APS, electrophoresis grade), N, N'-methylenebis(acrylamide) (BISAM), triethylamine (TEA), N,N,N',N'-tetramethylethylenediamine (TMEDA), anhydrous acetone (HPLC grade), calcium hydride, and tin (II) 2-ethylhexanoate (TOC) were obtained from Sigma-Aldrich. Dichloromethane (DCM; Acros Organics) was dried by distillation over calcium hydride (Sigma-Aldrich). All other solvents and chemicals were used as received. Ethylenediaminetetraacetic acid disodium salt (EDTA), penicillin and streptomycin were purchased from Sigma-Aldrich. Dulbecco's phosphate-buffer saline (PBS) and Dulbecco's Modified Eagle's Medium (DMEM; 4.5 g/L glucose with L-glutamine and without sodium pyruvate) were obtained from Cellgro (Herndon, VA). Trypsin and calcein AM were purchased from Invitrogen (Carlsbad, CA). Fetal bovine serum (FBS, screened for compatibility with rat bone marrow stromal cells) was purchased from Atlas Biologicals (Fort Collins, CO). SDF-1α and SDF-1α ELISA kit were obtained from R&D Systems (Minneapolis, MN). Millipore MultiScreen-MIC 96 well plates were purchased from Millipore (Billerica, MA).
2.2. Synthesis and characterization of PLEOF macromer
Ultra low molecular weight polylactide (ULMW PLA) was synthesized by ring opening polymerization of LA, as previously described (Jabbari and He 2008). DEG and TOC were used as the polymerization initiator and catalyst, respectively. LA monomer was dried under vacuum at 40°C for at least 12 h before the reaction. Briefly, 90 g of LA was heated gradually to 130°C in a three-neck reaction flask under dry nitrogen atmosphere in an oil bath. After melting, 4.5 ml DEG and 5 ml TOC were added to the flask with stirring. The polymerization reaction was continued for 12 h at 140°C with stirring. The resulting polymer mixture was dissolved in DCM and precipitated in ice-cold ether to remove the high molecular weight fraction. Next, the ether was removed by rotary evaporation; the polymer was re-dissolved in DCM and precipitated twice in hexane. The precipitate was dried in a vacuum (<5 mmHg) at 40°C for at least 12 h before use.
PLEOF was synthesized by condensation polymerization of ULMW PLA and PEG with FuCl, as previously described (He and Jabbari 2007). TEA was used to neutralize the hydrochloric acid by-product. FuCl was distilled at 161°C. The weight ratio of PEG to ULMW PLA was 70:30. The molar ratio of FuCl:(PEG+PLA) and TEA:(PEG+PLA) was 0.9:1.0 and 1.8:1.0, respectively. In a typical reaction, 18 g PEG and 2.0 g ULMW PLA were dried by azeotropic distillation with toluene. The dried polymers were dissolved in 150 ml DCM in a three-neck reaction flask under dry nitrogen atmosphere. After cooling to 5°C in an ice bath, 0.61 ml FuCl and 1.55 ml TEA, each dissolved in 30 ml of DCM, were added drop-wise to the reaction with stirring. The reaction was allowed to run for 6 h at 5°C and continued for an additional 12 h under ambient conditions. After completion of the reaction, solvent was removed by rotary evaporation, residue was dissolved in anhydrous ethyl acetate to precipitate the by-product triethylamine hydrochloride, and the salt was removed by filtration. Ethyl acetate was removed by rotary evaporation and the product was dissolved in DCM and precipitated twice in cold ether. The product was dried in vacuum at ambient temperature for at least 12 h before use.
The synthesized ULMW PLA and PLEOF macromers were characterized by 1H-NMR and GPC. The chemical structure of the PLEOF macromer was characterized by a Varian Mercury-300 1H NMR (Varian, Palo Alto, CA) at ambient conditions. The polymer sample was dissolved in CDCl3 at a concentration of 50 mg/mL, and 1% v/v tetramethylsilane (TMS) was used as the internal standard. The molecular weight distribution of the synthesized macromers was measured by gel permeation chromatography (GPC). Measurements were carried out with a Waters 717 Plus Autosampler GPC system (Waters, Milford, MA) connected to a model 616 HPLC pump, model 600S controller, and model 410 refractive index detector. The columns consisted of a styragel HT guard column (7.8 × 300 mm, Waters) in series with a styragel HR 4E column (7.8 × 300 mm, Waters) heated to 37°C in a column heater. The Empower software (Waters) was used for data analysis and determination of the number and weight average molecular weights and polydispersity index (PI). 50 µL of the sample (2 mg/mL in THF) was eluted with degassed THF at a flow rate of 1 mL/min. Monodisperse polystyrene standards (Waters) with peak molecular weights of 0.58–66.35 kDa and PI <1.1 were used to construct the calibration curve.
2.3. Preparation of PLEOF hydrogel and SDF-1α loading
For loading, SDF-1α was added to the polymerizing mixture consisting of PLEOF macromer, BISAM crosslinker, and the APS/TMEDA redox initiation system in PBS as described (He and Jabbari 2007; Sarvestani, Xu et al. 2007). The initiation system consisted of APS and TMEDA with equimolar concentrations of 0.02 M to maintain the pH of the polymerization mixture at 7.4 during polymerization. PLEOF macromer was sterilized by dissolving in anhydrous acetone, followed by filtering with a 0.2 µm filter (Whatman autovial syringeless filter with a PTFE membrane; Fisher), and removing the acetone by heating the solution to 50°C in a sterile hood. Solutions of BISAM crosslinker in PBS, 0.2 M APS in PBS, and 0.2 M TMEDA in PBS were sterilized by filtration. Briefly, 30 mg BISAM was dissolved in 0.825 mL PBS by heating the mixture to 50°C and sterilized with a syringe filter. Next, 315 mg of sterile PLEOF macromer was added and the mixture was heated and vortexed to aid dissolution. Then, 500 ng/mL SDF-1α was added to the mixture, followed by the addition of 105 µL APS and TMEDA (0.2 M) solutions to initiate polymerization. The mixture was mixed and degassed, transferred into a sterile Teflon mold (750 µm thick), covered with a sterile glass plate, and fastened with clips. The assembly was wrapped in an aluminum foil to minimize evaporation and allowed to crosslink at 37°C for 30 min. Under sterile conditions, the gel was cut into small disks with a sterile cork-borer and the disk-shaped samples were used for swelling, degradation, and protein release studies. A similar procedure was used for the synthesis of PLEOF hydrogels without SDF-1α.
2.4. Hydrogel swelling and sol fraction
Equilibrium water content and sol fraction of the hydrogels were determined from swelling measurements (He and Jabbari 2007). For swelling experiments, disk-shaped samples (12 mm diameter × 750 µm thick) were incubated in 5 mL PBS at 37°C for 48 h, the swelling medium was changed every 12 h, and the swollen weight was measured (Was). The equilibrium weight swelling ratio of the hydrogel, Q, was determined by Q = (Was − Wasd)/Wasd, where Wasd was the dry weight after swelling. To measure Wasd, the swollen disks were placed in distilled deionized (DDI) water for 12 h to remove excess electrolytes, dried at ambient conditions for 12 h, and further dried in vacuum at 40°C for 4 h. The sol fraction, S, was determined by S = (0.25Wac − Wasd)/0.25Wac, where Wac represents the weight of the disks immediately after crosslinking and the factor 0.25 stands for the initial solid fraction of the sample based on 30 mg BISAM crosslinker and 315 mg PLEOF macromer.
2.5. Gelation kinetics
Rheological measurements were performed at 37°C on an AR-2000 rheometer (TA Instruments, New Castle, DE) equipped with a parallel plate geometry (acrylic plate with >95% transparency to UV light; 20 mm diameter; TA Instruments) as described (He and Jabbari 2007; Sarvestani, He et al. 2007; Sarvestani, Xu et al. 2007). A sinusoidal shear strain profile was exerted on the sample via the upper geometry at constant frequency of 1 Hz. The polymerizing mixture was injected on the Peltier plate and the upper geometry was lowered to a gap of 300 µm. The storage modulus (G′) during the gelation process was monitored by the rheometer. The measured G′ and Q (equilibrium swelling ratio) values were used to determine the molecular weight between crosslinks in the hydrogel (M̅c) and the network mesh-size (ξ).
2.6. Hydrogel degradation
The hydrogel mass loss was measured as a function of incubation time in DMEM medium at 37°C (Suggs, Krishnan et al. 1998). After washing with excess DDI water, the initial dry weight, Wd0, was recorded after drying the samples at ambient conditions for 12 h, followed by drying in vacuum at 40°C for 4 h. The incubation medium was changed every 3 days. At each time point, samples were removed, washed with DDI water to remove excess electrolytes, and the weight at time t was recorded after drying (Wd). The fraction of mass remaining at time t was calculated from the ratio of Wd to Wd0.
2.7. Bone marrow stromal cell isolation
BMS cells were isolated from the bone marrow of young adult male Wistar rats as described (He, Ma et al. 2008). After aseptically removing the femurs and tibias, the marrow was flushed out with 20 mL of cell isolation media (DMEM supplemented with 100 units/mL penicillin, 100 µg/mL streptomycin, 20 µg/mL fungizone and 50 µg/mL gentamicin sulfate). The cell suspensions were centrifuged at 200×g for 5 min, cell pellets were re-suspended in 12 mL of primary media (DMEM supplemented with 10% FBS, 100 units/mL penicillin, 100 µg/mL streptomycin, 50 µg/mL gentamicin sulfate and 250 ng/mL fungizone), and aliquoted into T-75 flasks. The flasks were subsequently maintained in a humidified 5% CO2 incubator at 37°C. Cultures were replaced with fresh media at 3 and 7 days to remove haematopoietic and other unattached cells. After 10 days, cells were detached from the flasks with 0.05% trypsin-0.53 mM EDTA and used for cell migration experiments.
2.8. Loading efficiency and release characteristics of SDF-1α
The SDF-1α loaded hydrogels were washed with PBS twice, crushed into small fragments, and extracted with DMSO. The extracts were analyzed by HPLC for determination of encapsulated fraction of SDF-1α. The HPLC analysis was carried on a 250×10 mm, 10 µm Xterra® Prep RP18 column (Waters, Milford, MA), flow rate of 2 ml/min using a gradient 5–95% MeCN in 0.1% aqueous TFA. A photodiode array detector (model 996, Waters) was used for detection at a wavelength of 214 nm. Loading efficiency was determined by dividing the measured amount by the initial SDF-1α loading. The release kinetics of SDF-1α was carried out by incubating hydrogel samples in 2 mL of serum-free cell culture media (pH 7.4) at 37°C with orbital shaking. At each time point (0, 0.5, 1, 4, 6, 9, 12, 15, 18, and 21 days), the incubation medium was collected and the total (enzymatically active and inactive) amount of the released SDF-1α was measured by HPLC as described above, and the enzymatically-active amount was measured by enzyme-linked immunosorbent assay (ELISA) according to the manufacturer’s instructions (R&D Systems, Minneapolis, MN) (Abbott, Huang et al. 2004; Ji, He et al. 2004). Briefly, 100 µl of the sample was incubated in the dilution buffer (0.1% BSA and 0.05% Tween-20 in Tris-buffered saline) at dilution ratios of 1/100, 1/10, and 1/2 for 2 h at ambient conditions. Next, after washing, 100 µL of polyclonal biotinylated anti-human SDF-1α (R&D Systems; 250 ng/mL) was added to the sample solution and incubated for 2 h. Then after three washes, 100 µL of 1 µl/mL horseradish peroxidase-streptavidin was added to the sample, and the plate was incubated for 20 min, followed by the addition of 100 µL of TMB substrate solution. After incubation for 20 min, the reaction was stopped by the addition of 50 µL of 1M H2SO4 to the sample solution. The absorbance was measured with a plate reader (Synergy HT, Bio-Tek) at two wavelengths of 450 and 570 nm. The values at 570 were subtracted from those at 450 nm to correct for background absorbance. The measured intensities were correlated to equivalent amounts of SDF-1α using a calibration curve constructed from solutions with known concentration.
2.9. Migration of BMS cells and SDF-1α bioactivity
Bioactivity was assessed by measuring the rate of migration of BMS cells in response to the released SDF-1α from the hydrogels using 8-µm pore size Millipore MultiScreen-MIC 96-transwell plates (Mori, Doi et al. 2004; Ji, Dheen et al. 2005), as shown in Fig. 1. For quantification of the extent of cell migration, BMS cells (Fig. 1a) were labeled with calcein AM (live cell stain) by incubating BMS cells (4× 10⁴ cells/cm2 seeding density) in PBS containing 2 µM calcein AM dye for 30 min (He and Jabbari 2007). To determine the effect of fluorescent labeling on proliferation of BMS cells, labeled and non-labeled cells were seeded in a 24-well culture plate (5×10⁴ cells/well) and a hemocytometer was used to count the number of cells after 1, 2, and 3 days. For migration experiments, 75 µL BMS cell suspension (5×10⁵ cells/mL; Fig. 1b) in serum-free Dulbecco’s culture medium containing 0.1% BSA were seeded on the membrane in the upper well (Fig. 1c). Next, at each time point, 150 µL of the solution containing the released SDF-1α, collected from the protein-loaded PLEOF hydrogels incubated in 2 mL of serum-free cell culture media (Fig. 1g), was added to the lower receiver well of the transwell. Then, the 96-transwell plate was assembled and maintained in a humidified 5% CO2 incubator at 37°C for 12 h (Fig. 1d). After incubation, the upper surface of the membrane was scraped twice with cotton swabs to remove those cells that did not migrate to the lower side of the membrane (Fig. 1e). The BSM cells that migrated to the lower side under the influence of SDF-1α gradient were washed with PBS and detached from the membrane with 0.05% trypsin-0.53 mM EDTA. The number of migrated cells (labeled with calcein AM) was quantified by measuring the absorbance of each well with a plate reader at two wavelengths of 450 and 570 nm, as described above. Migration experiments performed without the addition of SDF-1α were used as the control and experiments were done in quadruplicate. The fraction of migrated BMS cells was calculated by dividing the number of migrated cells to the initial number of seeded cells.
Figure 1.

Schematic diagram to demonstrate the procedure for measuring the rate of migration of BMS cells in response to the released SDF-1α from the hydrogels using an 8-µm pore size Millipore MultiScreen-MIC 96-transwell plate.
2.10. Statistical analysis
Data are expressed as means ± standard deviation. Significant differences between two groups were evaluated using a two-tailed student t-test. A value of p<0.05 was considered statistically significant.
3. Results
3.1. Characterization of PLEOF macromer
Three PLEOF copolymers were synthesized by condensation polymerization of ULMW PLA, PEG, and FuCl with PLA/PEG weight ratios of 10/90, 30/70, and 50/50. PLEOF macromers with different degrees of hydrophilicity were produced by changing the ratio of PLA to PEG in the macromer. The chemical structure and molecular weight distribution of the synthesized macromers were characterized by 1H-NMR and GPC, respectively. The and PI of the synthesized ULMW PLA were 1.2 kDa and 1.4, respectively, and those of PEG were 3.4 kDa and 1.1. In the NMR spectrum of PLEOF macromers, two doublet chemical shifts with peak positions at 1.51 and 1.59 (methylene hydrogens of PLA), one doublet with peak position at 6.97 ppm (hydrogens of fumarate), two triplets with peak positions at 3.67 (methylene hydrogens of PEG) and 4.36 ppm (methylene hydrogens of DEG initiator), and one multiplet with peak position at 5.20 ppm (methine hydrogen of PLA) were observed. The ratio of the peak in the NMR spectrum due to the chemical shift centered at 5.20 ppm (methine hydrogen of PLA) to that at 3.67 ppm (methylene hydrogens of PEG) was directly related to the molar ratio of PLA to PEG in the copolymer. Based on the analysis of NMR chemical shifts, the molar percent of PLA in the copolymer for samples with 10, 30, and 50% by weight PLA in the feed was 3.7, 5.6, and 16.2%, respectively, corresponding to 6, 9, and 24% by weight in the copolymer (see Table 1). M̅n and PI of the 6% PLEOF macromer were 10.6 kDa and 1.8, respectively; those of the 9% PLEOF were 8.9 kDa and 1.7; those of the 24% PLEOF were 8.4 kDa and 1.9, as shown in Table 1. There was a slight decrease in PLEOF molecular weight as the PLA fraction in the copolymer was increased.
Table 1.
Molecular weight and composition of PLEOF macromer as a function of PLA to PEG ratio in the polymerization reaction.
| PLA to PEG ratio in PLEOF |
PLA in feed (wt %) |
M̄n (kDa) | PI | PLA in macromer (mol % / wt %) |
|---|---|---|---|---|
| 10/90 | 10 | 10600 | 1.8 | 3.7 / 6 |
| 30/70 | 30 | 8900 | 1.7 | 5.6 / 9 |
| 50/50 | 50 | 8400 | 1.9 | 16.2 / 24 |
3.2. Characterization of PLEOF Hydrogels
The effect of PLA fraction on equilibrium weight swelling ratio and sol fraction of the PLEOF hydrogels is shown in Fig. 2. As the PLA fraction was increased from 6 to 9 and 24%, the swelling ratio decreased from 6.0±0.5 to 4.5±0.4 and 3.1±0.7, respectively, which corresponded to 86±2, 82±2, and 75±5% water content. There was a statistically significant decrease in water uptake (swelling ratio) with the increase in PLA fraction in PLEOF macromer. As the PLA fraction was increased from 6 to 9 and 24%, sol fraction increased from 16±3 to 21±4 and 23±4%, respectively, but the increase was not statistically significant. The shear modulus of the PLEOF hydrogels, measured by rheometry, is presented in Table 2. The intersection of shear storage and loss moduli was used to determine the gelation time of the hydrogels. The gelation time of 6, 9, and 24% PLEOF was 250, 310, and 380 sec, respectively. As the PLA fraction was increased from 6 to 9 and 24%, the shear storage modulus increased from 12.1 to 13.0 and 18.2 kPa, respectively. The modulus values along with swelling ratios of the hydrogels were used to calculate mesh size of the hydrogel networks. The mass loss of the hydrogels with incubation time in DMEM media is shown in Fig. 3. The 6 and 9% PLEOF hydrogels lost 8±3 and 13±3% mass after 21 days, respectively, while the 24% hydrogel lost 37±4% mass. As the PLA fraction was increased, the fraction of degradable monomer in the network increased which resulted in higher mass loss.
Figure 2.
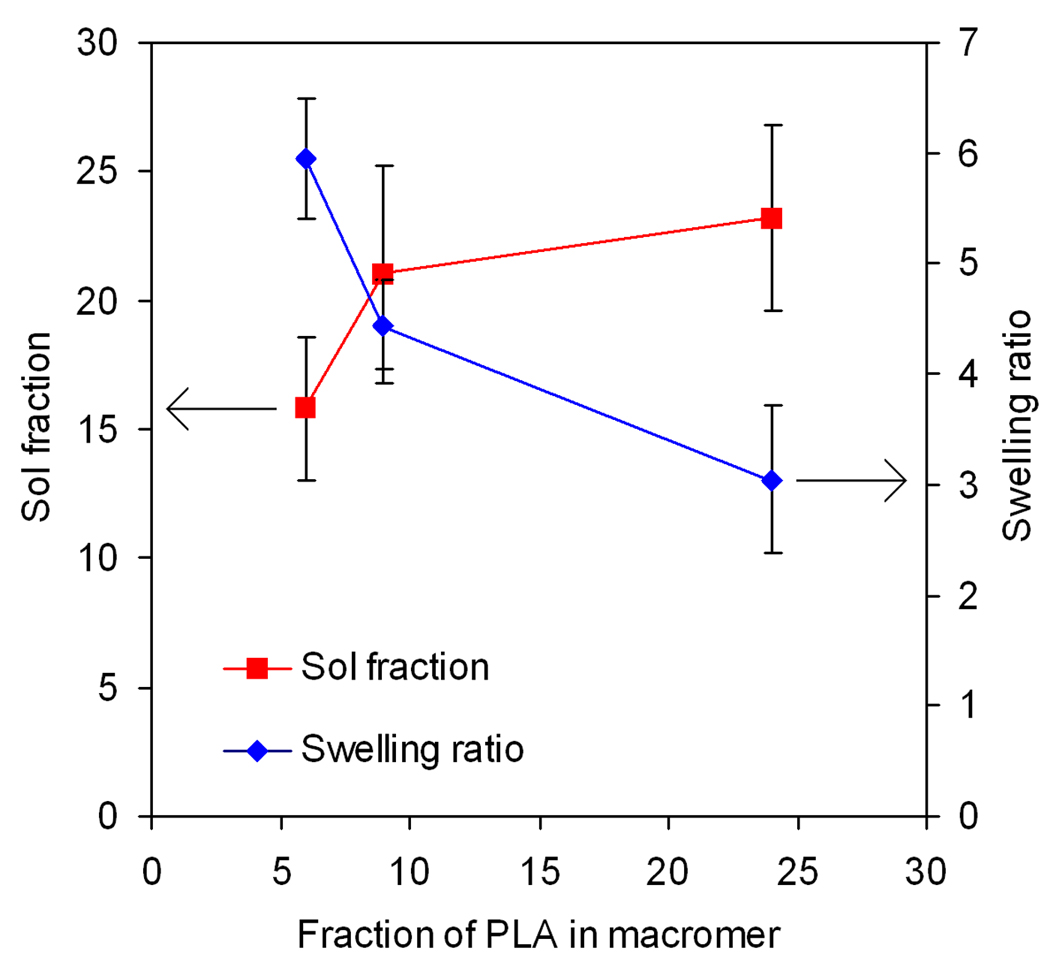
Effect of PLA fraction on swelling ratio and sol fraction of PLEOF hydrogel. Error bars correspond to means ± SD (n=4).
Table 2.
Storage modulus, molecular weight between crosslinks, polymer volume fraction in the swollen state, and network mesh size of the hydrogel as a function of PLA fraction in PLEOF macromer.
| PLA in PLEOF macromer (wt %) |
G′(kPa) | M̄c (kDa) | υp,s | ξ (nm) |
|---|---|---|---|---|
| 6 | 12.1 ±1.0 | 43 ±5 | 0.13 ±0.01 | 18.0 ±1.5 |
| 9 | 13.0 ±2.2 | 37 ±8 | 0.17 ±0.01 | 15.3 ±2.1 |
| 24 | 18.2 ±1.9 | 26 ±4 | 0.22 ±0.04 | 11.5 ±1.6 |
Figure 3.
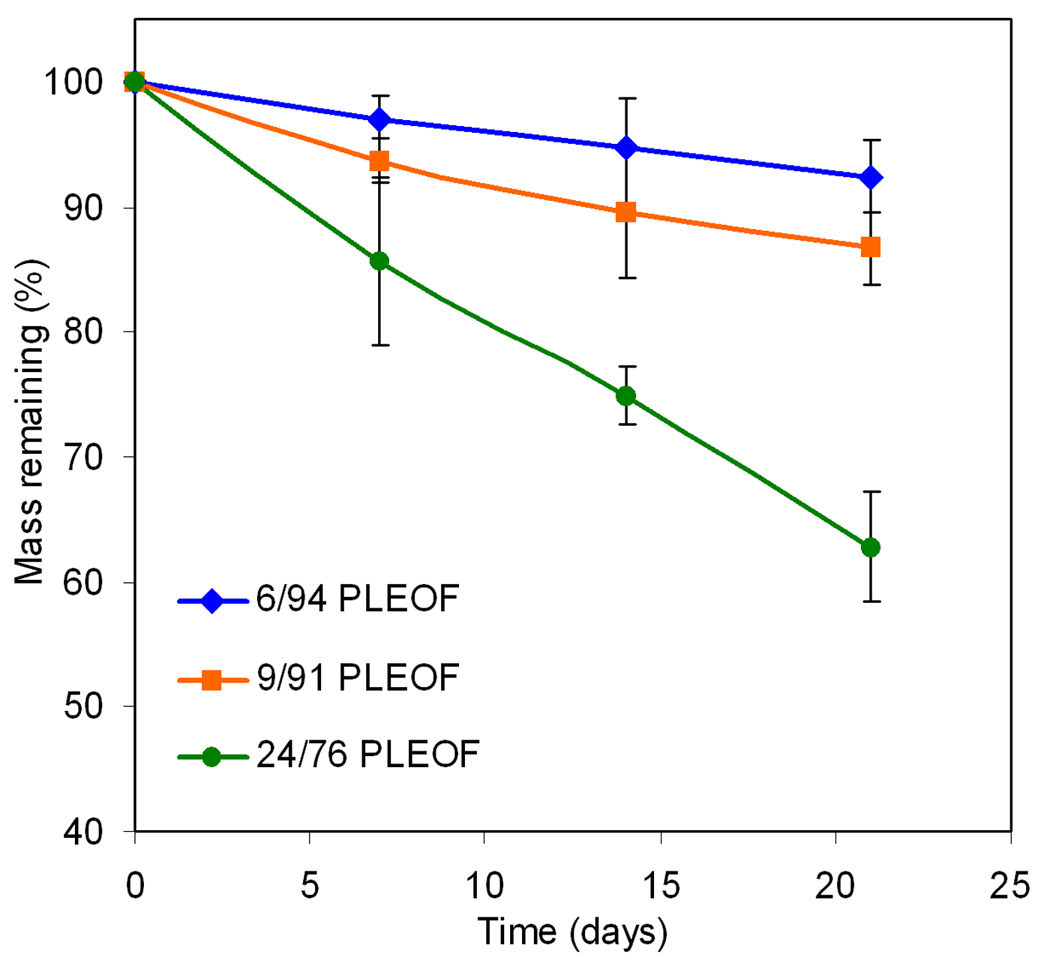
Effect of PLA fraction on degradation kinetics of PLEOF hydrogel in serum free DMEM media at Hydrolytic at 37°C. Error bars correspond to means ± SD (n=4).
3.3. SDF-1α loading efficiency and release kinetics
The loading efficiency of SDF-1α in PLEOF hydrogels is shown in Fig. 4. The loading efficiency statistically increased from 72.5±1.6% to 75.9±1.2 and 82.1±1.5 as the fraction of hydrophobic segments (PLA) in PLEOF macromer was increased from 6 to 9 and 24 wt%. These results demonstrated that the extent of hydrophilicity/hydrophobicity of the matrix affected loading efficiency of SDF-1α in the hydrogels. The lower loading efficiencies obtained with 6% PLEOF could be explained by the lower affinity of SDF-1α for the 6% PLEOF hydrogel compared to the 24% hydrogel. The release kinetics of enzymatically-active (measured by ELISA) and total (measured by HPLC) SDF-1α from PLEOF hydrogels is shown in Fig. 5a and 5b, respectively. The total SDF-1α released was approximately 10–12% higher than the enzymatically-active amount released. The release of SDF-1α from 6, 9, and 24% PLEOF hydrogels consisted of a burst release of 18, 16, and 5% (see Figure 5b) in the first 24 h, respectively. For the more hydrophilic 6 and 9% PLEOF hydrogels, the release profiles consisted of a pronounced burst release in the first 24 h followed by a period of relatively sustained release by diffusion in 21 days [see the shape of the release profile for 6 and 9% hydrogels in Figure 5b; (Siepmann, Lecomte et al. 1999)]. In contrast, the hydrophobic 24% PLEOF hydrogel had a relatively less pronounced burst release and displayed a slow but constant release between days 1–9 (mainly by diffusion) followed by a fast release between days 9 and 18 (mainly by matrix degradation; see shape of the release profile for 24% hydrogel in Figure 5b).
Figure 4.
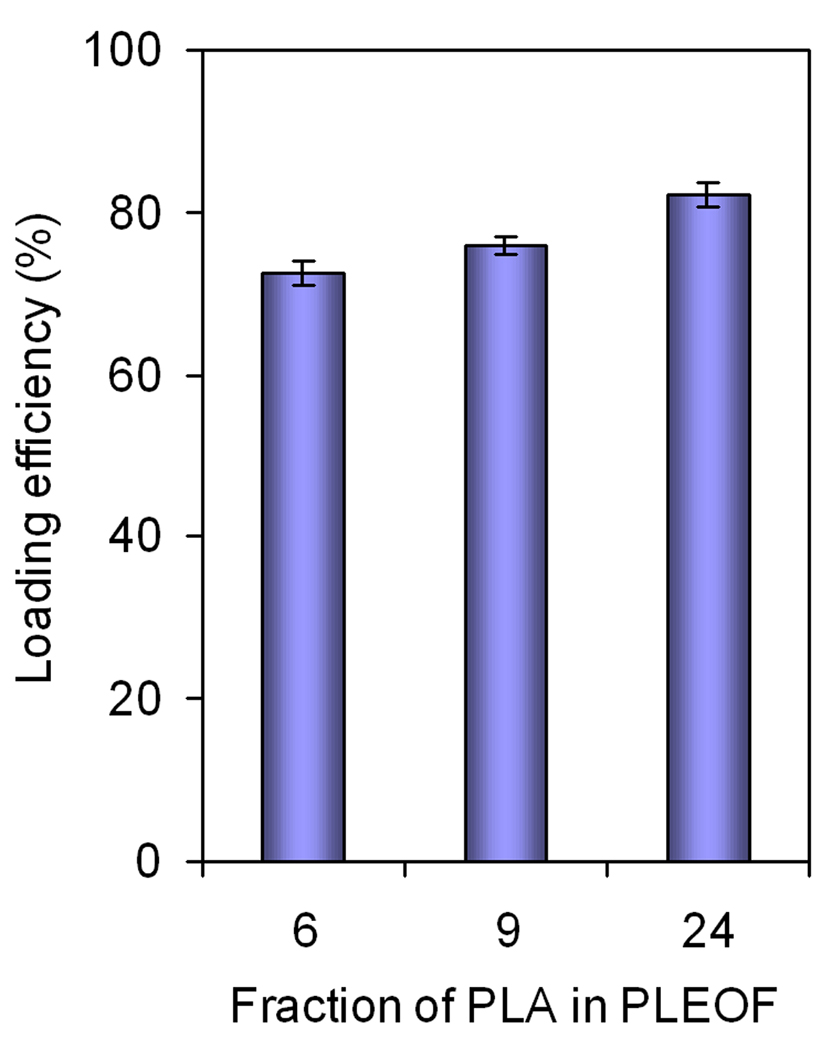
Effect of PLA fraction on SDF-1α loading efficiency in PLEOF hydrogel. Error bars correspond to means ± SD (n=4).
Figure 5.
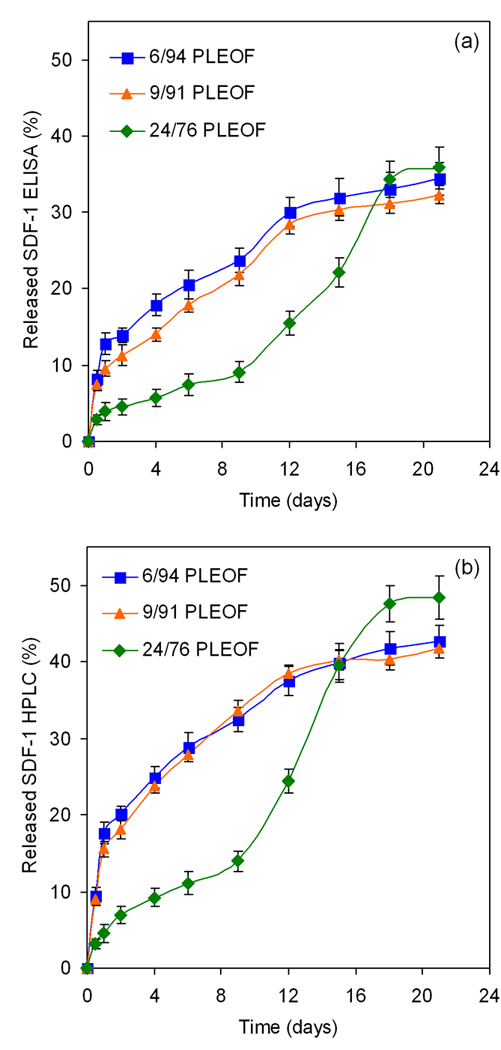
Effect of PLA fraction on release kinetics of SDF-1α from PLEOF hydrogels. Error bars correspond to means ± SD (n=4).
The cumulative amount of active and inactive SDF-1α released, the amount recovered by extraction, and the total amount (released and recovered by extraction) after 21 days is shown in Table 3. The fraction of active SDF-1α released from 6, 9, and 24% hydrogels was 34.3, 32.3, and 35.8%, respectively; the fraction of inactive (HPLC minus ELISA) was 8.3, 9.5, and 12.6%; the fraction recovered by extraction with DMSO was 9.3, 8.5, and 12.7%; and the fraction of SDF-1α released and recovered was 51.9, 50.3, and 61.1%. Considering that the unloaded fraction (100 minus the loading efficiency) of SDF-1α for 6, 9, and 24% hydrogels was 27.5, 24.1, and 17.9%, respectively, the fraction of SDF-1 degraded or trapped in the hydrogel was 20.6, 25.6, and 21%. It should be mentioned that additional peaks in the HPLC chromatograph were observed with incubation (data not shown) which could be due to degradation of a fraction of the released SDF-1α. In addition, the loaded SDF-1α may be covalently linked and trapped in the hydrogel matrix by Michael’s addition reaction (Lutolf, Tirelli et al. 2001) between the unreacted fumarate groups of PLEOF and the thiol (SH) group of cystine in the protein.
Table 3.
Released and retained SDF-1α from PLEOF hydrogels after 21 day incubation as a function of PLA fraction in PLEOF macromer.
| PLA in PLEOF macromer (wt %) |
SDF-1α released (active) (wt%) |
SDF-1α released (inactive) (wt%) |
SDF-1α recovered by extraction (wt %) |
Total SDF-1α released and recovered (wt %) |
|---|---|---|---|---|
| 6 | 34.3 ±2.1 | 8.3 ±1.2 | 9.3±1.4 | 51.9 ±4.7 |
| 9 | 32.3 ±1.2 | 9.5 ±2.0 | 8.5±0.9 | 50.3 ±4.1 |
| 24 | 35.8 ±2.8 | 12.6 ±0.2 | 12.7±2.5 | 61.1 ±5.5 |
3.4. Effect of SDF-1α concentration on migration of labeled BMS cells
BMS cells were labeled with cell-permeable dye calcein AM for quantification of the extent of cell migration (He and Jabbari 2007). After permeating through the cell membrane, the non-fluorescent calcein AM is hydrolyzed by endogenous esterases to form the highly stable negatively charged green fluorescent calcein dye that is retained in the cell cytoplasm. Consequently, calcein AM is used extensively as a stain for evaluation of cell viability and migration (Bussolati, Belletti et al. 1995; Gatti, Belletti et al. 1998; Parish 1999; Uggeri, Gatti et al. 2004). Although calcein AM is considered to have low toxicity (Uggeri, Gatti et al. 2004), its effect on BMS cell viability and proliferation needs to be investigated. Fig. 6 compares the proliferation of calcein AM labeled and unlabeled BMS cells after 1, 2, and 3 days incubation in basal media. There was no statistically significant difference in the proliferation rate of the labeled and unlabeled BMS cells after three days. For example, the number of unlabeled (control) and labeled BMS cells after 3 days was 3.24±0.13 ×10⁴ and 3.11±0.15 ×10⁴, respectively. The effect of SDF-1α concentration in the range of 0–750 ng/mL, directly added to the cell culture media, on migration of BMS cells is shown in Fig. 7. There was not a statistically significant difference between migration rate of the groups with zero and 10 ng/mL SDF-1α concentration. This indicated that SDF-1α concentrations <10 ng/mL do not stimulate migration of BMS cells. Interestingly, there was a slight but significant decrease in cell migration with SDF-1α concentrations >500 ng/mL compared to that at 250 ng/mL. This is consistent with the results of Poznansky et al. that the recruitment of subpopulations of T-cells into the peritoneal cavity is reversed by high concentrations of SDF-1α (Poznansky, Olszak et al. 2000). The extent of cell migration was significantly higher for 50 ng/mL SDF-1α concentration (compared to the cultures without the addition of chemokine) and the SDF-1α-induced migration of BMS cells was dose-dependent in the concentration range of 50 to 250 ng/mL. According to Fig. 7, the extent of migration of BMS cells was highest for SDF-1α concentration of 250 ng/mL.
Figure 6.
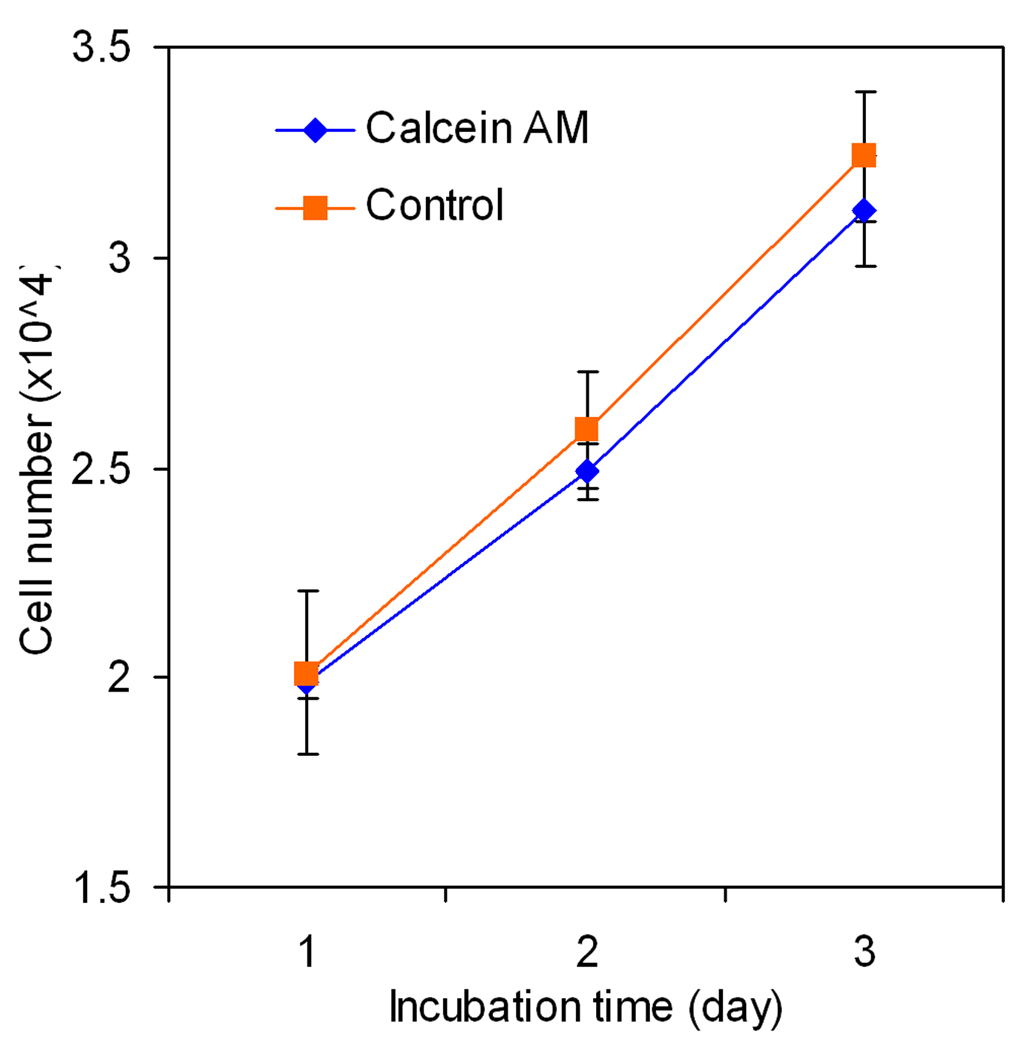
Effect of calcein AM labeling on viability and proliferation of BMS cells. Error bars correspond to means ± SD (n=4).
Figure 7.

Effect of SDF-1α concentration on migration of BMS cells. Error bars correspond to means ± SD (n=4).
3.5. Effect of released SDF-1α from hydrogels on migration of BMS cells
The effect of the SDF-1α released from the hydrogels on migration of BMS cells was measured in 96-well transwell plates and the results are shown in Fig. 8. The cell migrations in Fig. 8 in response to time-release of SDF-1α from PLEOF hydrogels closely followed the release kinetics of SDF-1α shown in Fig. 5a. Comparison of those two figures demonstrates that the released SDF-1α was biologically active and induced the migration of BMS cells. The 6% PLEOF hydrogel, due to higher swelling ratio (see Fig. 2), initially had the highest extent of cell migration compared to 9 and 24% hydrogels but finished with the lowest extent of cell migration after 21 days by having the slowest degradation rate (see Fig. 3). Conversely, the 24% PLEOF hydrogel, due to lower swelling ratio (see Fig. 2), initially had the lowest extent of cell migration compared to 6 and 9% PLEOF, but finished with the highest extent of cell migration after 21 days by having the highest swelling ratio (see Fig. 3).
Figure 8.
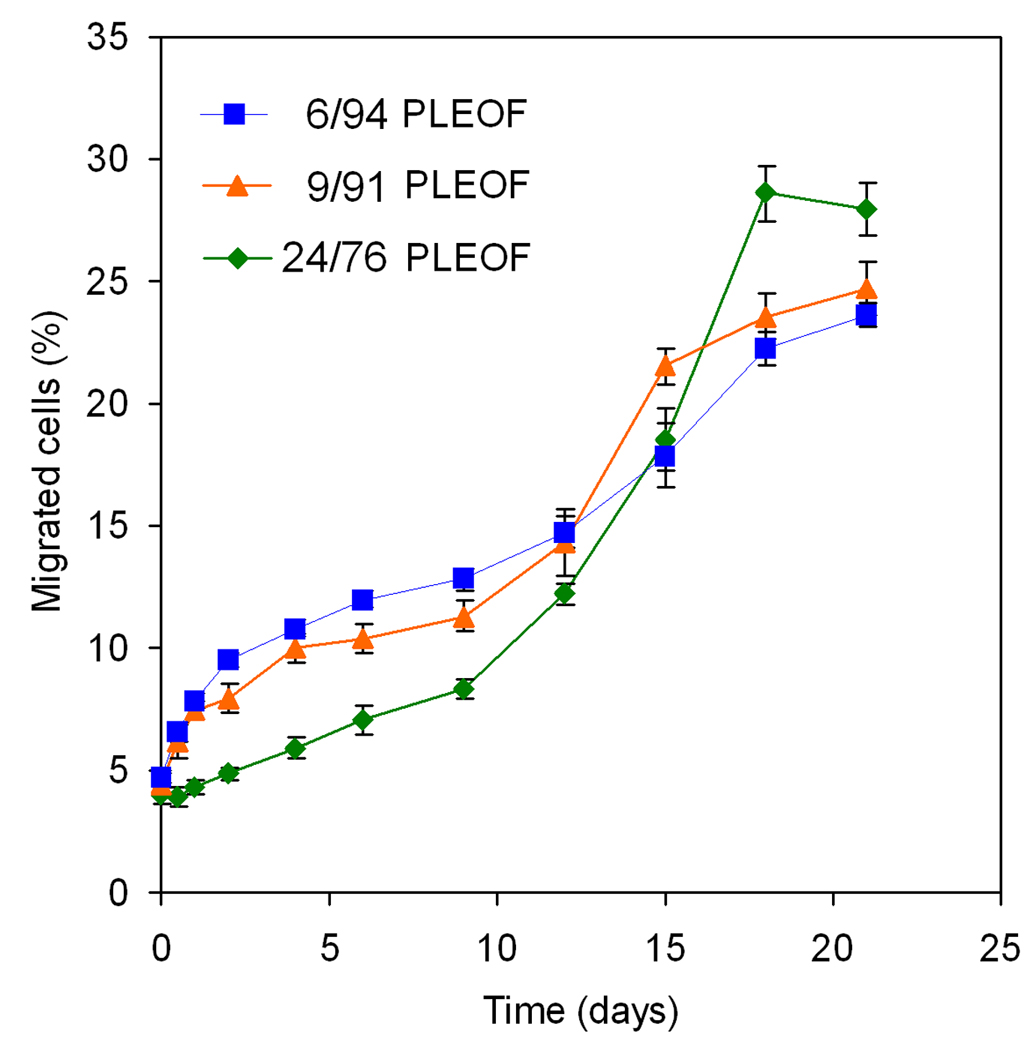
The extent of migration of BMS cells in response to the released SDF-1α from PLEOF hydrogels with different PLA to PEG ratios. Error bars correspond to means ± SD (n=4).
4. Discussion
The release kinetics of SDF-1α depends on the mesh size (ξ) of the PLEOF hydrogel. The network mesh size can be determined from the average molecular weight between crosslinks (M̅c) and the equilibrium swelling ratio (Q) of the hydrogel. Assuming Gaussian distribution of chain lengths between crosslinks, M̅c can be obtained by (Flory and Rehner 1943):
| (1) |
where ρ is the density of PLEOF macromer in the polymerizing solution (240 kg/m3), G′ is shear modulus (Pa), R is gas constant (8.31 J/mol K), T is absolute temperature (310 K), and S is sol fraction. The sol fractions of 6, 9, and 24% PLEOF hydrogels were 15.8±2.8, 21.0±4.2, 23.2±3.6, respectively, as shown in Fig. 1. The storage moduli of 6, 9, and 24% PLEOF hydrogels were 12.1±1.0, 13.0±2.2, and 18.2±1.9, respectively (see Table 2). Using Eq. 1, M̅c values of 43±5, 37±8, and 26±4 kDa for 6, 9, and 24% PLEOF was obtained. The mesh size of the network, ξ, was determined from M̅c and the weight swelling ratio Q by the following equation (Peppas and Bar-Howell 1986):
| (2) |
In the above equation, C̄n , M̅r, and l̄ are the average characteristic ratio, molecular weight of the repeat unit, and the average bond length of the PLEOF macromer. Averages were calculated based on the weight percent of PEG and PLA segments in the macromer (see Table 1). Accordingly, M̅r values of 54, 74, and 94 g/mol were used for 6, 9, and 24% PLEOF, respectively. The average l̄ of 1.5 Å was used for all PLEOF gels (Joziasse, Veenstra et al. 1996; Ju, McCloskey et al. 2009). The characteristic ratio of PEG and PLA was 3.8 and 11.7, respectively (Grijpma, Penning et al. 1994; Ju, McCloskey et al. 2009). Therefore, C̄n values of 4.6, 6.2, and 7.8 were used for 6, 9, and 24% PLEOF, respectively. The polymer volume fraction in the swollen hydrogel, νp,s, was determined from the equilibrium swelling ratio Q by νp,s = 1/[1 + Q (ρp/ρw)] (Jabbari and Nozari 2000), where ρp and ρw are the densities of polymer (1105, 1107, and 1122 kg/m3 for 6, 9, and 24% PLEOF) and water (990 kg/m3 at 37°C), respectively. Using the above relations, the mesh sizes of the 6, 9, and 24% PLEOF hydrogels were 18.0±1.5, 15.3±2.1, and 11.5±1.6 nm, respectively. The calculated mesh sizes are of the same order of magnitude as the reported diameter of SDF-1α protein [4.4 nm (Huang, Shen et al. 2003)]. Aside from the mesh size imposed on SDF-1α diffusion, hydrophilic and hydrophobic interactions with PEG and PLA domains, respectively, phase separation of the PLA and PEG domains (Yu, M. et al. 2009), and inhomogeneity in the crosslinked network [i.e., microgel formation (Chi, Cai et al. 2009)] can affect the release kinetics of SDF-1α from the PLEOF hydrogels.
The enzymatically-active and total amount of SDF-1α are shown in Figures 5a and 5b, respectively. The differences in release profile between the three hydrogels could be explained by their extent of swelling (water uptake) and degradation. The more hydrophilic 6 and 9% PLEOF hydrogels had higher swelling ratios (5.9 and 4.5, respectively; see Figure 2) and relatively slow degradation (6 and 9% PLEOF hydrogels lost 7.7 and 13.3% mass in 21 days, respectively; see Figure 3). Furthermore, the release of SDF-1α from those two hydrogels was mainly by diffusion through a porous hydrogel network. For the 24% PLEOF hydrogel, due to faster degradation (lost 37% mass in 21 days; see Figure 3), the release profile of SDF-1α had two regimes: a diffusion-dominated regime between days 1 and 9 and a diffusion-degradation regime from day 9 to 21. The release profiles of the three PLEOF hydrogels are consistent with their degradation kinetics, shown in Fig. 3. The 6 and 9% PLEOF with high PEG content had relatively higher water uptake, but significantly lower density of degradable PLA segments, which decreased the degradation rate of the matrix (see Figure 3). The 24% PLEOF with relatively higher PLA content had lower water uptake, but significantly higher density of degradable PLA segments, which increased the degradation of the matrix.
Zhang et al. (Zhang, Nakamura et al. 2007) observed a near zero-order release profile, similar to that of 6 and 9% PLEOF hydrogels (see Figure 5a), for SDF-1α encapsulated in PEGylated fibrin gels for up to 10 days. Bladergroen et al. (Bladergroen, Siebum et al. 2009) reported a diffusion-degradation release profile, similar to that of 24% PLEOF hydrogel, for SDF-1α bound to heparinized 3D collagen gels. However, in the latter study, >40% of the loaded SDF-1α remained bound to the collagen gel after 2 weeks. Natural matrices like collagen or fibrin gel are known to stabilize proteins and protect them from denaturation. Our results demonstrate that a significant fraction of SDF-1α, loaded in a synthetic biodegradable hydrogel, was enzymatically active after hydrogel crosslinking and the loaded protein was released in a sustained manner for 21 days. For example, 34, 32, and 36% of the SDF-1α loaded in 6, 9, and 24% PLEOF hydrogels, respectively, was released in the active conformation after 21 days, while only 20, 25, and 21% were degraded or trapped in the hydrogel after 21 days. Furthermore, the flexibility in the design of PLEOF macromer allows the synthesis of a wide range of hydrogels with varying diffusive, biologic and degradation properties to suit various applications in protein delivery. For example, the hydrogel crosslink density, hence diffusivity can be adjusted by the density of fumarate groups in PLEOF macromer. The water content and degradability can be tailored to a particular application by varying the molecular weight of the PLA or the ratio of PLA to PEG in PLEOF macromer (Sarvestani, He et al. 2007; Sarvestani, Xu et al. 2007).
The migration of BMS cells (after 12 h) in response to the time-released SDF-1α (see Fig. 8) closely followed the SDF-1α release kinetics from the hydrogels (see Fig. 5). Results in Fig. 8 demonstrate that sustained release of SDF-1α from PLEOF hydrogels significantly affected the migration of BMS cells. However, a significant fraction of the loaded SDF-1α was denatured in the process hydrogel formation or by energetic interactions with PLA/PEG segments of the matrix. For example, molecular dynamic simulations predict that protein denaturation/unfolding on a substrate has enthalpic as well as entropic contributions (Friedel, Baumketner et al. 2007; Knotts, Rathore et al. 2008). While the change in entropy of unfolding on a substrate has a stabilizing effect, the energetic interactions of the protein with the substrate can adversely affect stability.
A gradient in SDF-1α concentration has been shown to improve penetration depth of the BMS cells to the central part of engineered scaffolds in regeneration of skeletal tissues (Schantz, Chim et al. 2007). However, short half-life and time-dependent migration of progenitor cells has limited its application in tissue engineering (Murphy, Cho et al. 2007). In a practical application like regeneration of long bone defects, a porous scaffold with long-term degradation characteristics to provide structural support to the regenerating defect (Jabbari, He et al. 2009) will be dipped in the SDF-1α loaded PLEOF precursor solution, and allowed to crosslink to suspend the protein in the pore volume of the scaffold. The PLEOF hydrogel, occupying the scaffold pore volume, immobilizes the protein and releases a sustained dose with time for recruitment and homing of progenitor cells to the defect site for regeneration. The 24% PLEOF hydrogel may be especially useful for bone regeneration where the SDF-1α needs to be protected from the action of antibiotics in the first week after implantation, followed by sustained release of the protein in the next two weeks to form a gradient for cell recruitment to the central part of the scaffold concurrent with hydrogel degradation. Results demonstrate that the PLEOF hydrogel might be potentially useful as a delivery matrix for sustained release of SDF-1α in the proliferative phase of healing for recruitment of progenitor marrow stromal cells in tissue engineering applications.
5. Conclusions
The release characteristics of SDF-1α from degradable PLEOF hydrogels and the effect of sustained release of SDF-1α on migration of BMS cells were investigated as a function of PLA to PEG ratio in the PLEOF macromer. The hydrogel mesh size decreased with increasing PLA fraction in the PLEOF hydrogel while hydrogel mass loss with incubation time and loading efficiency of SDF-1α increased. The more hydrophilic 6 and 9% PLEOF hydrogels had a pronounced burst release followed by a period of sustained release for 21 days. In contrast, the more hydrophobic 24% PLEOF hydrogel had a less pronounced burst release and displayed a slow but constant release between days 1–9 followed by a fast release from days 9 to 18. The fraction of active SDF-1α released from 6, 9, and 24% hydrogels after 21 days was 34.3, 32.3, and 35.8%, respectively. The migration of BMS cells in response to time-released SDF-1α closely followed the SDF-1α release kinetics from the hydrogels. Our results demonstrate that a significant fraction of the SDF-1α encapsulated in PLEOF hydrogels was enzymatically-active and the loaded protein was released in a sustained manner for 21 days which significantly enhanced migration of BMS cells.
Acknowledgements
This work was supported by research grants to E. Jabbari from the National Science Foundation (under Grant No. CBET-0756394 and Grant No. CBET-0931998), the National Institutes of Health (under grant number R03-DE19180), and the National Football League Charities.
Footnotes
Publisher's Disclaimer: This is a PDF file of an unedited manuscript that has been accepted for publication. As a service to our customers we are providing this early version of the manuscript. The manuscript will undergo copyediting, typesetting, and review of the resulting proof before it is published in its final citable form. Please note that during the production process errors may be discovered which could affect the content, and all legal disclaimers that apply to the journal pertain.
References
- Abbott JD, Huang Y, et al. Stromal cell-derived factor-1 alpha plays a critical role in stem cell recruitment to the heart after myocardial infarction but is not sufficient to induce homing in the absence of injury. Circulation. 2004;110(21):3300–3305. doi: 10.1161/01.CIR.0000147780.30124.CF. [DOI] [PubMed] [Google Scholar]
- Aiuti A, Webb IJ, et al. The chemokine SDF-1 is a chemoattractant for human CD34(+) hematopoietic progenitor cells and provides a new mechanism to explain the mobilization of CD34(+) progenitors to peripheral blood. J. Exp. Med. 1997;185(1):111–120. doi: 10.1084/jem.185.1.111. [DOI] [PMC free article] [PubMed] [Google Scholar]
- Benoit DSW, Collins SD, et al. Multifunctional hydrogels that promote osteogenic human mesenchymal stem cell differentiation through stimulation and sequestering of bone morphogenic protein 2. Adv. Funct. Mater. 2007;17(13):2085–2093. doi: 10.1002/adfm.200700012. [DOI] [PMC free article] [PubMed] [Google Scholar]
- Bladergroen BA, Siebum B, et al. In vivo recruitment of hematopoietic cells using stromal cell-derived factor 1 alpha-loaded heparinized three-dimensional collagen scaffolds. Tissue Eng. 2009;15(7):1591–1599. doi: 10.1089/ten.tea.2008.0348. [DOI] [PubMed] [Google Scholar]
- Bussolati O, Belletti S, et al. Characterization of apoptotic phenomena induced by treatment with l-asparaginase in NIH3T3 cells. Exp. Cell Res. 1995;220(2):283–291. doi: 10.1006/excr.1995.1317. [DOI] [PubMed] [Google Scholar]
- Chi C, Cai T, et al. Oligo(ethylene glycol)-based thermoresponsive core-shell microgels. Langmuir. 2009;25(6):3814–3819. doi: 10.1021/la803866z. [DOI] [PubMed] [Google Scholar]
- Dar A, Goichberg P, et al. Chemokine receptor CXCR4-dependent internalization and resecretion of functional chemokine SDF-1 by bone marrow endothelial and stromal cells. Nat. Immunol. 2005;6(10):1038–1046. doi: 10.1038/ni1251. [DOI] [PubMed] [Google Scholar]
- Flory JP, Rehner J. Statistical mechanics of swelling of crosslinked polymer networks. J. Chem. Phys. 1943;11:521–526. [Google Scholar]
- Friedel M, Baumketner A, et al. Stability of a protein tethered to a surface. J. Chem. Phys. 2007;126(9):95101–95112. doi: 10.1063/1.2464114. [DOI] [PubMed] [Google Scholar]
- Gatti R, Belletti S, et al. Comparison of annexin V and Calcein-AM as early vital markers of apoptosis in adherent cells by confocal laser microscopy. J. Histochem. Cytochem. 1998;46(8):895–900. doi: 10.1177/002215549804600804. [DOI] [PubMed] [Google Scholar]
- Grijpma DW, Penning JP, et al. Chain entanglement, mechanical-properties and drawability of poly(lactide) Coll. Polym. Sci. 1994;272(9):1068–1081. [Google Scholar]
- He S, Timmer MD, et al. Synthesis of biodegradable poly(propylene fumarate) networks with poly(propylene fumarate)-diacrylate macromers as crosslinking agents and characterization of their degradation products. Polymer. 2001;42(3):1251–1260. [Google Scholar]
- He X, Jabbari E. Material properties and cytocompatibility of injectable MMP degradable poly(lactide ethylene oxide fumarate) hydrogel as a carrier for marrow stromal cells. Biomacromolecules. 2007;8(3):780–792. doi: 10.1021/bm060671a. [DOI] [PubMed] [Google Scholar]
- He X, Ma J, et al. Effect of grafting RGD and BMP-2 protein-derived peptides to a hydrogel substrate on osteogenic differentiation of marrow stromal cells. Langmuir. 2008;24(21):12508–12516. doi: 10.1021/la802447v. [DOI] [PubMed] [Google Scholar]
- Huang XQ, Shen JH, et al. Molecular dynamics simulations on SDF-1 alpha: Binding with CXCR4 receptor. Biophys. J. 2003;84(1):171–184. doi: 10.1016/S0006-3495(03)74840-1. [DOI] [PMC free article] [PubMed] [Google Scholar]
- Huynh DP, Nguyen MK, et al. Functionalized injectable hydrogels for controlled insulin delivery. Biomaterials. 2008;29(16):2527–2534. doi: 10.1016/j.biomaterials.2008.02.016. [DOI] [PubMed] [Google Scholar]
- Jabbari E, He X. Synthesis and characterization of bioresorbable in situ crosslinkable ultra low molecular weight poly(lactide) macromer. J. Mater. Sci. Mater. Med. 2008;19(1):311–318. doi: 10.1007/s10856-006-0020-2. [DOI] [PubMed] [Google Scholar]
- Jabbari E, He X, et al. Material properties and bone marrow stromal cells response to In situ crosslinkable RGD-functionlized lactide-co-glycolide scaffolds. J. Biomed. Mater. Res. 2009;89A(1):124–137. doi: 10.1002/jbm.a.31936. [DOI] [PubMed] [Google Scholar]
- Jabbari E, Nozari S. Swelling behavior of acrylic acid hydrogels prepared by gamma-radiation crosslinking of polyacrylic acid in aqueous solution. Eur. Polym. J. 2000;36:2685–2692. [Google Scholar]
- Ji JF, Dheen ST, et al. Expressions of cytokines and chemokines in the dorsal motor nucleus of the vagus nerve after right vagotomy. Mol. Brain Res. 2005;142(1):47–57. doi: 10.1016/j.molbrainres.2005.09.017. [DOI] [PubMed] [Google Scholar]
- Ji JF, He BP, et al. Interactions of chemokines and chemokine receptors mediate the migration of mesenchymal stem cells to the impaired site in the brain after hypoglossal nerve injury. Stem Cells. 2004;22(3):415–427. doi: 10.1634/stemcells.22-3-415. [DOI] [PubMed] [Google Scholar]
- Joziasse CAP, Veenstra H, et al. On the chain stiffness of poly(lactide)s. Macromol. Chem. Phys. 1996;197(7):2219–2229. [Google Scholar]
- Ju H, McCloskey BD, et al. Preparation and characterization of crosslinked poly(ethylene glycol) diacrylate hydrogels as fouling-resistant membrane coating materials. J. Mem. Sci. 2009;330(1–2):180–188. [Google Scholar]
- Kitaori T, Ito H, et al. Stromal cell-derived factor 1/CXCR4 signaling is critical for the recruitment of mesenchymal stem cells to the fracture site during skeletal repair in a mouse model. Arthritis Rheum. 2009;60(3):813–823. doi: 10.1002/art.24330. [DOI] [PubMed] [Google Scholar]
- Knotts TA, Rathore N, et al. An entropic perspective of protein stability on surfaces. Biophys. J. 2008;94(11):4473–4483. doi: 10.1529/biophysj.107.123158. [DOI] [PMC free article] [PubMed] [Google Scholar]
- Liang S, Xu J, et al. Protein diffusion in agarose hydrogel in situ measured by improved refractive index method. J. Contr. Rel. 2006;115(2):189–196. doi: 10.1016/j.jconrel.2006.08.006. [DOI] [PubMed] [Google Scholar]
- Lutolf MP, Tirelli N, et al. Systematic modulation of Michael-type reactivity of thiols through the Use of charged amino acids. Bioconj. Chem. 2001;12(6):1051–1056. doi: 10.1021/bc015519e. [DOI] [PubMed] [Google Scholar]
- McQuibban GA, Butler GS, et al. Matrix metalloproteinase activity inactivates the CXC chemokine stromal cell-derived factor-1. J. Biol. Chem. 2001;276(47):43503–43508. doi: 10.1074/jbc.M107736200. [DOI] [PubMed] [Google Scholar]
- McQuibban GA, Gong JH, et al. Inflammation dampened by gelatinase A cleavage of monocyte chemoattractant protein-3. Science. 2000;289(5482):1202–1206. doi: 10.1126/science.289.5482.1202. [DOI] [PubMed] [Google Scholar]
- Mori T, Doi R, et al. CXCR4 antagonist inhibits stromal cell-derived factor 1-induced migration and invasion of human pancreatic cancer. Mol. Cancer Therapeut. 2004;3(1):29–37. [PubMed] [Google Scholar]
- Murphy JW, Cho Y, et al. Structural and functional basis of CXCL12 (stromal cellderived factor-1 alpha) binding to heparin. J. Biol. Chem. 2007;282(13):10018–10027. doi: 10.1074/jbc.M608796200. [DOI] [PMC free article] [PubMed] [Google Scholar]
- Parish CR. Fluorescent dyes for lymphocyte migration and proliferation studies. Immunol. Cell Biol. 1999;77:499–508. doi: 10.1046/j.1440-1711.1999.00877.x. [DOI] [PubMed] [Google Scholar]
- Peppas NA, Bar-Howell BD. Characterization of the crosslinked structure of hydrogels. In: Peppas NA, editor. Hydrogels in Medicine and Pharmacy. Boca Raton: CRC Press; 1986. pp. 27–56. [Google Scholar]
- Pitarresi G, Palumbo FS, et al. Biodegradable hydrogels obtained by photocrosslinking of dextran and polyaspartamide derivatives. Biomaterials. 2003;24(23):4301–4313. doi: 10.1016/s0142-9612(03)00332-6. [DOI] [PubMed] [Google Scholar]
- Poznansky MC, Olszak IT, et al. Active movement of T cells away from a chemokine. Nature Med. 2000;6(5):543–548. doi: 10.1038/75022. [DOI] [PubMed] [Google Scholar]
- Sarvestani AS, He X, et al. Effect of osteonectin-derived peptide on the viscoelasticity of hydrogel/apatite nanocomposite scaffolds. Biopolymers. 2007;85(4):370–378. doi: 10.1002/bip.20659. [DOI] [PubMed] [Google Scholar]
- Sarvestani AS, Xu WJ, et al. Gelation and degradation characteristics of in situ photo-crosslinked poly(L-lactid-co-ethylene oxide-co-fumarate) hydrogels. Polymer. 2007;48(24):7113–7120. [Google Scholar]
- Schantz JT, Chim H, et al. Cell guidance in tissue engineering: SDF-1 mediates sitedirected homing of mesenchymal stem cells within three-dimensional polycaprolactone scaffolds. Tissue Eng. 2007;13(11):2615–2624. doi: 10.1089/ten.2006.0438. [DOI] [PubMed] [Google Scholar]
- Segers VF, Tokunou T, et al. Local delivery of protease-resistant stromal cell derived factor-1 for stem cell recruitment after myocardial infarction. Circulation. 2007;116(15):1683–1692. doi: 10.1161/CIRCULATIONAHA.107.718718. [DOI] [PubMed] [Google Scholar]
- Shimode K, Iwasaki N, et al. Local upregulation of stromal cell-derived factor-1 after ligament injuries enhances homing rate of bone marrow stromal cells in rats. Tissue Eng. 2009;15(8):2277–2284. doi: 10.1089/ten.tea.2008.0224. [DOI] [PubMed] [Google Scholar]
- Shingel KI, Faure MP. Structure-property relationships in poly(ethylene glycol)-protein hydrogel systems made from various proteins. Biomacromolecules. 2005;6(3):1635–1641. doi: 10.1021/bm0492475. [DOI] [PubMed] [Google Scholar]
- Siepmann J, Lecomte F, et al. Diffusion-controlled drug delivery systems: calculation of the required composition to achieve desired release profiles. J. Contr. Rel. 1999;60:379–389. doi: 10.1016/s0168-3659(99)00093-0. [DOI] [PubMed] [Google Scholar]
- Sierra MD, Yang FQ, et al. Differential processing of strornal-derived factor-1 alpha and strornal-derived factor-1 beta explains functional diversity. Blood. 2004;103(7):2452–2459. doi: 10.1182/blood-2003-08-2857. [DOI] [PubMed] [Google Scholar]
- Suggs LJ, Krishnan RS, et al. In vitro and in vivo degradation of poly(propylene fumarate-co-ethylene glycol) hydrogels. J. Biomed. Mater. Res. 1998;42(2):312–320. doi: 10.1002/(sici)1097-4636(199811)42:2<312::aid-jbm17>3.0.co;2-k. [DOI] [PubMed] [Google Scholar]
- Thieme S, Ryser MF, et al. Stromal cell derived factor-1 alpha directed chemoattraction of transiently CXCR4 overexpressing bone marrow stromal cells into functionalized three-dimensional biomimetic scaffolds. Tissue Eng. Methods. 2009 March 4; doi: 10.1089/ten.TEC.2008.0556. PMID: 19260802. [DOI] [PubMed] [Google Scholar]
- Uggeri J, Gatti R, et al. Calcein-AM is a detector of intracellular oxidative activity. Histochem. Cell Biol. 2004;122(5):499–505. doi: 10.1007/s00418-004-0712-y. [DOI] [PubMed] [Google Scholar]
- Van Overstraeten-Schlogel N, Beguin Y, et al. Role of stromal-derived factor-1 in the hematopoietic-supporting activity of human mesenchymal stem cells. Eur. J. Haematol. 2006;76(6):488–493. doi: 10.1111/j.1600-0609.2006.00633.x. [DOI] [PubMed] [Google Scholar]
- Van Tomme SR, Storm G, et al. In situ gelling hydrogels for pharmaceutical and biomedical applications. Int. J. Pharmaceut. 2008;355(1–2):1–18. doi: 10.1016/j.ijpharm.2008.01.057. [DOI] [PubMed] [Google Scholar]
- Yamamoto M, Tabata Y, et al. Bone regeneration by transforming growth factor beta 1 released from a biodegradable hydrogel. J. Contr. Rel. 2000;64(1–3):133–142. doi: 10.1016/s0168-3659(99)00129-7. [DOI] [PubMed] [Google Scholar]
- Yu J, M MC, et al. Phase separation at the surface of poly(ethylene oxide)-containing biodegradable poly(l-lactic acid) blends. Langmuir. 2009;25(19):11467–11471. doi: 10.1021/la901239v. [DOI] [PMC free article] [PubMed] [Google Scholar]
- Zhang G, Nakamura Y, et al. Controlled release of stromal cell-derived factor-1 alpha in situ increases c-kit+ cell homing to the infarcted heart. Tissue Eng. 2007;13(8):2063–2071. doi: 10.1089/ten.2006.0013. [DOI] [PubMed] [Google Scholar]
- Zhong RK, Law P, et al. Small peptide analogs to stromal derived factor-1 enhance chemotactic migration of human and mouse hematopoietic cells. Exp. Hematol. 2004;32(5):470–475. doi: 10.1016/j.exphem.2004.01.011. [DOI] [PubMed] [Google Scholar]
- Zhu W, Boachie-Adjei O, et al. A novel regulatory role for stromal-derived factor-1 signaling in bone morphogenic protein-2 osteogenic differentiation of mesenchymal C2C12 cells. J. Biol. Chem. 2007;282(26):18676–18685. doi: 10.1074/jbc.M610232200. [DOI] [PubMed] [Google Scholar]