Abstract
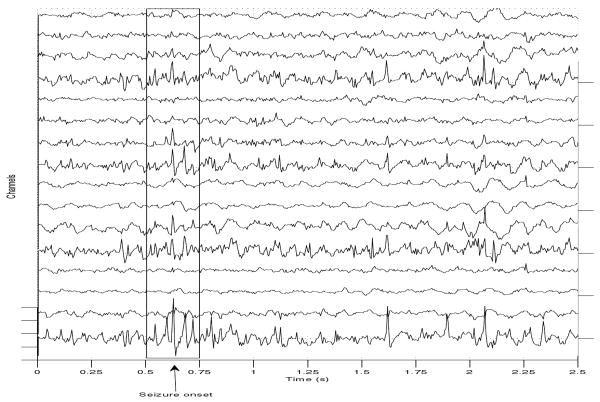
Developmental brain malformations often cause intractable and in many cases generalized and/or multifocal seizures. Surgical intervention is not possible in these cases as it is difficult to isolate the epileptogenic foci. Scalp EEG signals recorded during such seizures include coupled contributions from different sources. If it was possible to decouple these contributions based on differences in both their signatures and inter-arrival times at different electrodes, it would subsequently be possible to estimate the locations of the seizure foci. For this purpose, we applied matched filtering to scalp EEG data from 3 patients with multifocal seizures, using patient-specific source-related short EEG segments as the template waveforms. These segments were assumed to be seizure-related based on distinct sets of inter-arrival times at different channels and alternating signal polarities. We present preliminary results and demonstrate that matched filtering can be successfully applied to extract decoupled signal components from the EEG, generated by potentially distinct sources, and thus with distinct inter-arrival times but partially overlapping spectra.
I. Introduction
Abnormal cortical development often results in structural brain malformations and associated functional and cognitive impairment. Brain malformations, including cortical heterotopia, polymicrogyria, and lissencephaly are often also the cause of intractable epilepsy, usually characterized by generalized and/or multifocal seizures [5] [3] [10]. Epileptogenesis associated with these malformations is poorly understood, given the heterogeneity of associated seizures. In addition, multifocal seizures are difficult to localize and ictal EEG patterns are difficult to characterize due to the complexity of the EEG time series resulting from coupled signal contributions associated with multiple foci. Yet, it is important to understand the complexity of these seizures and estimate their foci, particularly for therapeutic purposes such as surgical intervention, which may be possible only if distinct seizure foci can be accurately localized.
Accurate seizure focus localization from scalp EEG is often difficult, due to the ambiguity of the source of recorded potentials. In the case of multifocal seizures, localization is particularly challenging and requires more complex models than the often assumed equivalent dipole [7]. Ideally, to accurately localize the seizure foci, their distinct contributions to the EEG signal should be decoupled prior to time-delay estimation and spatial model assumptions. Simple filtering is not appropriate, given that these signals have similar power distributions in the same frequency bands. More complex methods have been proposed, such as blind source separation, independent component analysis and their variations [6] [4] [1]. However, several of these methods require statistical independence of signals which typically cannot be assumed. In theory, if the source waveforms were known and distinct, matched filtering could be applied to the original EEG to decouple these contributions. However, this is rarely the case, given the intra- and inter-patient heterogeneity of seizure signatures. Matched-filtering may also be used to eliminate EEG artifacts, due to eye blinking or muscle movement. The eye blinking waveform may be extracted from the data during quiescent periods of the recordings. The muscle artifact, particularly when coupled to the seizure signal, is more difficult to isolate, but is typically a high frequency signal. In this study, we applied matched filtering using short seizure-related and eye blinking-related EEG segments, directly extracted from EEG recordings from 3 patients with seizures. We also used the highest mode of the EEG signal (with modal frequency above 80 Hz) to eliminate at least the high-frequency component of the muscle artifact [14]. Our preliminary results indicate that it is possible to decouple separate processes even if their spectra overlap. In particular, in all patients we identified two different processes, a high frequency-dominant process (> 20 Hz) at seizure onset and lower frequency processes (< 15 Hz), dominant during the entire duration of the seizure. The latter were not solely associated with the typical low-frequency steady state brain oscillations but did share the same frequency band.
II. Materials and Methods
All data were recorded at Beth Israel Deaconess Medical Center, Boston MA. Scalp EEG recordings from 3 patients with seizures were analyzed in this study. The 16-channel data were sampled at 200 Hz. The 60 Hz noise typically seen in the EEG signal was filtered out using a 2nd order elliptical stopband filter with 1.5 Hz bandwidth. The data were filtered in both directions to eliminate potential phase shifts associated with the non-zero phase of the filter. The highest mode of the EEG signal corresponding to frequencies above 80 Hz was extracted using a mode decomposition technique [14].
III. Application of Matched Filtering to EEG
The match filter, also referred to as the coherent detector, is a quasi-optimum linear filter h(t) which maximizes the output signal-to-noise ratio (SNR) and thus improves the detection of a known signal. It is not frequency band-specific but is instead used to extract a particular waveform from a contaminated by noise signal. The SNR to be maximized is given by:
| (1) |
where σ2 is the variance of additive system noise to the observed signal. Thus, y(t) is convolved with the filter h(t) to obtain the matched-filtered signal yMF(t). The filtered signal yMF is given by:
| (2) |
The filter that maximizes the SNR in Equation 1 is the time-reversed signal y(−t). In this study we applied matched-filtering for two purposes: i) to eliminate artifacts, commonly seen in scalp EEG, by eliminating the matched-filtered signals from the original signals, and ii) to extract signal contributions from potentially different epileptic foci. Figure 1 shows the spectra of the original 16 channel EEG time series, recorded from one patient during a seizure. It is clear that there are several processes with overlapping frequency content that contribute to the EEG signal. In addition, there is significant spatio-temporal variation of the seizure-related signal power. Eye blinking-related artifacts are typically low-frequency events (<10 Hz), whereas the peak power of the muscle-related artifact is in the higher frequency range (>60Hz). Therefore, the frequency distribution of the EEG power prior to the seizure onset (estimated at 102 s), at least in some channels, e.g., Fp1-F3, Fp2-F4, cannot be attributed predominantly to these artifacts. Seizure-related processes may, therefore, give rise to such a distribution, and we address this in more detail in the following section.
Fig. 1.
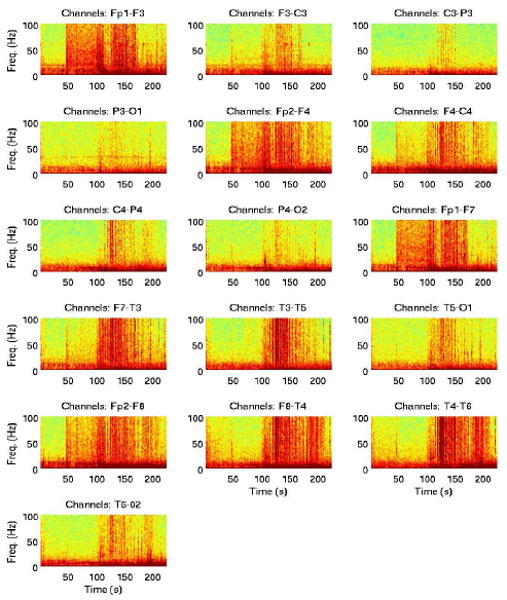
Spectrograms of 16 channel scalp EEG recordings during a seizure.
IV. Analysis
Raw EEG signals were first pre-processed using matched filtering to eliminate the eye blinking artifact. Several methods have been proposed for this purpose, from simple high-pass filtering to more sophisticated methods [13] [11] [16]. Here we isolated the eye blinking signature from a quiescent period during the recording, and used this signal as the template. Using a 1s sliding window, we match-filtered the entire recordings. The resulting signals were artifact-enhanced and otherwise suppressed signals, which we then eliminated from the original signals. The width of sliding window was based on 6 dB SNR threshold on the low-frequency power (<10 Hz). An example of an EEG segment and its spectrum, pre- and post-filtering, is shown in Figure 2.
Fig. 2.
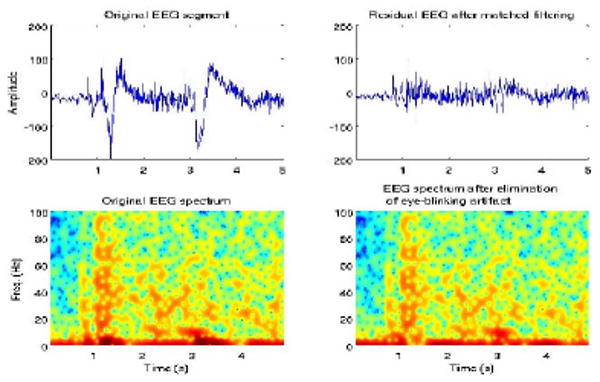
EEG signal and spectrum prior to matched-filtering (left); residual signal and spectrum once eye-blinking artifact has been eliminated (right).
The EEG signal may also be contaminated by the muscle artifact. In these particular EEGs there are were no quiescent periods (high SNR), in which this artifact was present and could be extracted. Instead, the artifact was coupled to the seizure signal. To at least remove the high-frequency component contribution of this artifact, rather than simply applying a low-pass filter, we extracted the highest modes of the signal (with modal frequencies above 80 Hz) and used that as the template signal. The high-frequency enhanced matched-filter signal was subsequently eliminated from the original signal. An example is shown in Figure 3. Eliminating the high-frequency modes of the signal is essentially a form of low-pass filtering. However, instead of using an arbitrary cutoff frequency, the signal-specific highest modal-frequency was implicitly assumed as the cutoff frequency in matched filtering.
Fig. 3.
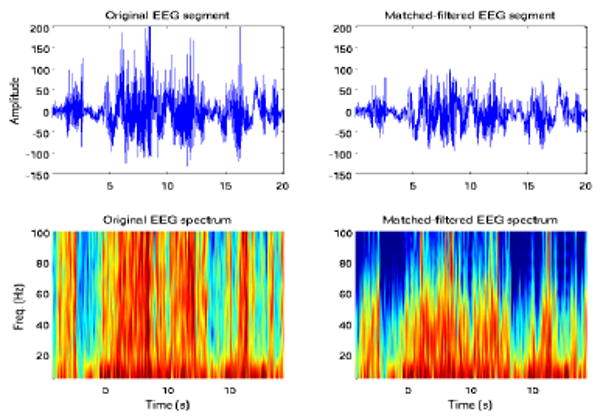
EEG signal and spectrum prior to matched-filtering (left); post-matched filtering residual signal and spectrum.
Seizure-specific waveforms, and the location and proximity of epileptic foci are unknown. Thus, the contribution of one source to the signal emanating from another is also unknown. We assumed that different processes contribute to the EEG waveform, possibly from distinct seizure foci. To identify corresponding waveforms, we used the arrival times of the primary (of highest power) seizure signal, and time-delays at different channels. We examined the EEG time series for waveforms in which the polarity of the signal changed at different channels, an indication of the possible presence of dipole sources. An example is shown in Figure 4.
Fig. 4.
EEG segment in which the arrival of a potentially source-induced signal may be seen.
For all recordings, it was possible to extract several related waveforms, the low-frequency component characteristic of the quiescent EEG, and two higher frequency segments, one periodic and the other burst-like during the seizure. Matched filtering with the low-frequency periodic signal is shown in Figure 5(a). Original and filtered spectra of channels at different scalp locations are shown in Figures 5(b) and (c). The application of the higher frequency matched-filter resulted in at least 5 dB average increase in the EEG power during the seizure in that frequency range, and at least 7-10 dB power decrease in frequency ranges outside that of the template signal. This SNR may be further improved by choosing a shorter window centered at the high-frequency waveform, to reduce the inclusion of lower-frequency background oscillatory activity. Given that both matched-filtered signals have significant power in these bands, simple high-pass filtering would have eliminated these components. Matched-filtering using the lower frequency waveform resulted in a 15-20 dB decrease in the EEG power during the seizure in frequencies above 15 Hz and an average 5 dB increase below 15 Hz. This filter behaved more as a typical low-pass filter.
Fig. 5.
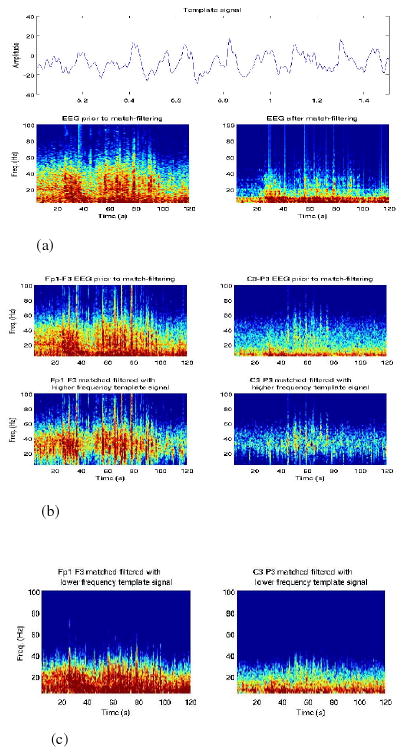
(a) Template, original and filtered spectra (Fp1-F3)
(b) Original and filtered spectra (Fp1-F3, F3-C3).
(c) Low-frequency matched-filtered spectra (Fp1-F3, F3-C3).
We followed the same procedure for the other 2 patients analyzed in the study and obtained similar results. Figure 6 shows an example of EEG recordings from a second patient with multifocal seizures, at two channels and corresponding matched-filtered signals.
Fig. 6.
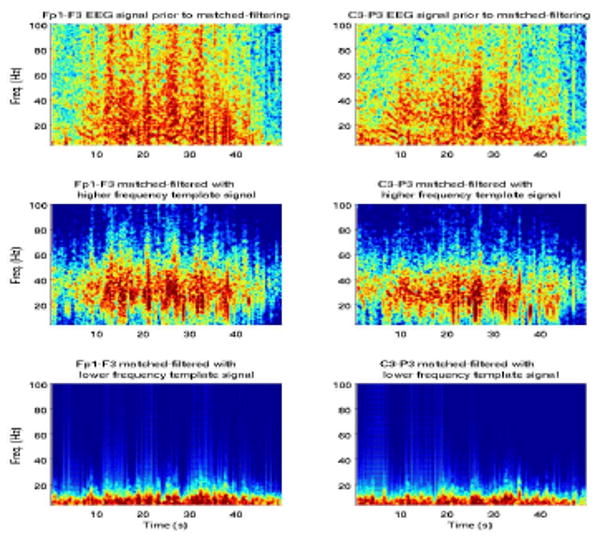
Original EEG recordings (top) and matched-filtered signals for two channels.
Similarly to the first patient, the low-frequency template acted as a low-pass filter on the signal. In all patients both low- and mid-frequency processes were detected with distinct inter-arrival times at different channels. Such processes have been reported before and have been distinguished based on their waveforms, not time-delays, and thus their simultaneous presence in the EEG has not been specifically attributed to different seizure foci [7].
V. Discussion
We have presented preliminary results from the application of matched filtering to seizures to eliminate artifacts, extract seizure-related EEG features and decouple signal contributions possibly from distinct seizure foci. Matched filtering has been used in several studies for seizure detection purposes [12] [8] [7] [9]. The limitation of the method is that it requires a priori knowledge of the seizure waveform to be used as the template filter signal. However, these waveforms are highly heterogeneous even for a single patient and thus the template must be carefully extracted on a patient- and seizure-specific basis. The eye blinking artifact was extracted from the EEG and the normalized, artifact-enhanced matched-filtered signal was eliminated from the original signal. The highest mode of the residual signal was also used as a ‘negative’ match-filter to eliminate the high-frequency component of EEG segments contaminated by the muscle artifact. We subsequently extracted both higher frequency (> 15 Hz) and lower frequency waveforms from the EEG during seizures. These were identified based on the variation of the waveform polarity at different channels, indicating the possible presence of at least one dipole source, and their distinct inter-arrival times, indicating the presence of sources at different locations. We were thus able to extract different signal components from the EEG preserving their common frequency content. The results presented here are only preliminary. It is important to choose the match-filter template appropriately, given that it is a data segment itself, and thus possibly contaminated by unrelated to the seizure noise. One way to overcome this problem is to seek similar signatures throughout the duration of the seizure (which is often characterized by synchronized repetitive spiking) and average over these signatures to obtain a less noisy template. Another way is to smooth the extracted template. Nevertheless, matched-filtering is a promising technique for identifying and decoupling EEG features from different seizure foci, as long as these have sufficiently distinct signatures. Validation of this method may be achieved through localization, assuming a particular source model, and solving the forward problem, i.e., estimating the resulting EEG signals and comparing them to the data.
Contributor Information
Catherine Stamoulis, Email: caterina@mit.edu, Harvard Medical School, Department of Neurology, Beth Israel Deaconess Medical Center, Boston, MA 02215.
Bernard S. Chang, Harvard Medical School, Department of Neurology, Beth Israel Deaconess Medical Center, Boston, MA 02215
References
- 1.Bell AJ, Sejnowski TJ. An information-maximization approach to blind separation and blind deconvolution. Neural Computation. 1995;7:1129–1159. doi: 10.1162/neco.1995.7.6.1129. [DOI] [PubMed] [Google Scholar]
- 2.Grant AC, Rho JM. Ictal Patterns in Band Heterotopia. Epilepsia. 2002;43(4):403–407. doi: 10.1046/j.1528-1157.2002.42601.x. [DOI] [PubMed] [Google Scholar]
- 3.Guerrini R. Genetic Malformations of the Cerebral Cortex and Epilepsy. Epilepsia. 2005;46(Suppl.1):32–37. doi: 10.1111/j.0013-9580.2005.461010.x. [DOI] [PubMed] [Google Scholar]
- 4.Kohler BU, Orglmeister R, Breihmeier-Flick B. Blind source separation of EEG data using matched filters. Proceedings of the 20th Annual International Conference of the IEEE Engineering in Medicine and Biology Society; 1998. pp. 2038–2041. [Google Scholar]
- 5.Larroche JC. Malformations of the Nervous System. In: Adams JH, Corsellis JAN, Duchen LW, editors. Greenfield's Neuropathology. 4th. John Wiley; New York: 1984. pp. 385–450. [Google Scholar]
- 6.De Clercq W, Vergult A, Vanrumste B, Van Paesschen W, Van Huffel S. Canonical Correlation Analysis Applied to Remove Muscle Artifacts from the Electroencephalogram. IEEE, Trans Biomed Eng. 2006;53(12):2583–2587. doi: 10.1109/TBME.2006.879459. [DOI] [PubMed] [Google Scholar]
- 7.Niedermeyer E, Lopes da Silva FH, editors. Electroencephalography: Basic Principles, Clinical Applications and Related Fields. 5th. Lippincott, Williams & Wilkins; 2004. [Google Scholar]
- 8.Lopes da Silva FH, ten Brocke W, van Hulten K. EEG non-stationarities detected by inverse filtering in scalp and cortical recordings of epileptics statistical analysis. In: Kel-layway P, Petersen I, editors. Quantitative Analytic Studies in Epilepsy. Raven Press; New York: 1976. pp. 375–387. [Google Scholar]
- 9.O Toole JM, Mesbah M, Boashash B, Colditz P. A new neonatal seizure detection technique based on the Time-Frequency Characteristics Of The EEG. Proceedings of the IEEE 9th International Symposium on Signal Processing and its Applications; 2007. pp. 1–4. [Google Scholar]
- 10.Palmini A, Gambardella P, Andermann F, Dubeau F, Costa JC, Olivier A, Tampieri D, Gloor P, Quesney F, Andermann E. Intrinsic epileptogenicity of human dysplastic cortex as suggested by corticography and surgical results. Ann Neurol. 1995;37:476–487. doi: 10.1002/ana.410370410. [DOI] [PubMed] [Google Scholar]
- 11.Ping T, Makeig S, Humphries C, Lee TW, McKeown M, Iragni V, Sejnowski T. Removing encephalographic artifacts by blind source separation. Phychophysiology. 2000;37:163–178. [PubMed] [Google Scholar]
- 12.Saltzberg B, Lustick H, Heath RG. Detection of Focal Depth Spiking in the Scalp EEG of Monkeys. Electroencephalog Clin Neurophysiol. 1971;31:327–333. doi: 10.1016/0013-4694(71)90228-8. [DOI] [PubMed] [Google Scholar]
- 13.Shoker L, Sanei S, Chambers J. A hybrid algorithm for removal of eye blinking artifacts from EEG. 13th Workshop on Statistical Signal Processing. 2005:1014–1017. [Google Scholar]
- 14.Stamoulis C. Estimation of fundamental modes of brain oscillations. IEEE Transactions in Signal Processing. submitted. [Google Scholar]
- 15.Tyvaert L, Hawco C, Kobayashi E, LeVan P, Dubeau F, Gotman J. Different structures involved during ictal and inter-ictal epileptic activity in malformations of cortical development: an EEG-fMRI study. Brain. 2008;131:2042–2060. doi: 10.1093/brain/awn145. [DOI] [PMC free article] [PubMed] [Google Scholar]
- 16.Zhou W, Gotman J. Removing eye-movement artifacts from EEG during the intracarotid amobarbital procedure. Epilepsia. 2005;46(3):409–414. doi: 10.1111/j.0013-9580.2005.50704.x. [DOI] [PubMed] [Google Scholar]


