

Abstract
We have produced an evolutionary model for promoters, analogous to the commonly used synonymous/nonsynonymous mutation models for protein-coding sequences. Although our model, called Sunflower, relies on some simple assumptions, it captures enough of the biology of transcription factor action to show clear correlation with other biological features. Sunflower predicts a binding profile of transcription factors to DNA sequences, in which different factors compete for the same potential binding sites. The parametrized model simultaneously estimates a continuous measurement of binding occupancy across the genomic sequence for each factor. We can then introduce a localized mutation, rerun the binding model, and record the difference in binding profiles. A single mutation can alter interactions both upstream and downstream of its position due to potential overlapping binding sites, and our statistic captures this domino effect. Over evolutionary time, we observe a clear excess of low-scoring mutations fixed in promoters, consistent with most changes being neutral. However, this is not consistent across all promoters, and some promoters show more rapid divergence. This divergence often occurs in the presence of relatively constant protein-coding divergence. Interestingly, different classes of promoters show different sensitivity to mutations, with phosphorylation-related genes having promoters inherently more sensitive to mutations than immune genes. Although there have previously been a number of models attempting to handle transcription factor binding, Sunflower provides a richer biological model, incorporating weak binding sites and the possibility of competition. The results show the first clear correlations between such a model and evolutionary processes.
Evolution is a fundamental force that has shaped all living organisms. By comparing the genomes of different species, and considering their similarities and differences through the lens of evolutionary theory, we can discover interesting aspects of biology and better understand their past development (C. elegans Sequencing Consortium 1998; Adams et al. 2000; Lander et al. 2001; Mouse Genome Sequencing Consortium 2002). To quantify selective pressure in protein-coding genes, many researchers have estimated the number of nonsynonymous substitutions (called dN or Ka) and synonymous substitutions (called dS or Ks), and then taken their ratio, described as dN/dS, Ka/Ks, or ω (Nei and Kumar 2000). This has provided an invaluable model for characterizing the evolution of genes in relatively closely related species. Contrasting rates of evolution in classes of nucleotides with differing functional effects is also used in a variety of population genetics procedures, such as the McDonald–Kreitman test (McDonald and Kreitman 1991). Although this model crudely equates phenotypic change with amino acid sequence change, ignoring more complex effects, it has repeatedly shown its worth in classifying proteins and specific sites in proteins undergoing both positive (adaptive) selection and negative (purifying) selection (Nielsen 2001; Hurst 2002; Eyre-Walker 2006).
Due to its extensive use, methodology to assess relative nonsynonymous to synonymous rates has progressively improved over time. Salser et al. (1976) were the first to count synonymous and nonsynonymous differences between mammalian protein-coding nucleotide sequences, and others (Miyata and Yasunaga 1980; Perler et al. 1980; Li et al. 1985; Nei and Gojobori 1986) developed more robust methods to estimate the number of synonymous and nonsynonymous substitutions where multiple substitutions occurred in a single site. More recently, researchers increasingly use maximum likelihood methods to estimate these quantities, accounting for local variations in mutation rate according to various models of evolution (Goldman and Yang 1994). This framework has often been adapted by other researchers to investigate evolution of protein-coding sequence (Kosiol et al. 2007; Boyko et al. 2008). New extensions to the basic models, such as the sitewise likelihood ratio (Massingham and Goldman 2005), continue to expand the utility of this basic protein model.
In contrast, an analogous phenotypic change model has not existed for noncoding regions of the genome, including those regions that regulate transcription. Most researchers use straightforward measures to approximate change in these regions that lack a model of the variable susceptibility of different positions in transcription factor binding sites (TFBSs) to mutations (Wong and Nielsen 2004; Haygood et al. 2007). Although investigators have identified and commented on this variable susceptibility (Dermitzakis et al. 2003; Moses et al. 2003; Mustonen et al. 2008), a good model for the impact of variation on transcription factor binding that can be integrated into traditional dN/dS methods would be more useful. The lack of a more realistic phenotypic model is particularly frustrating as the protein-coding complement does not change significantly between mammalian species outside of olfaction and the immune system (and even less so between primates), leading many researchers to suggest that changes in regulation include many of the most important changes for positive selection in mammalian and primate evolution (King and Wilson 1975).
Here, we introduce a phenotypic model for the impact of change in promoter sequence. We were inspired by the success of transcription factor binding models that integrate over the complete range of binding affinities (Rajewsky et al. 2002; Granek and Clarke 2005; Foat et al. 2006; Sinha 2006; Roider et al. 2007; Manke et al. 2008) using a library of position weight matrices (PWMs). Additionally, Wasson and Hartemink (2009) published a similar model during the preparation of this manuscript. These models have shown their utility by providing robust models of Drosophila enhancers (Segal et al. 2008). This work differs from previous efforts to use multispecies conservation information to improve the identification of functional TFBSs (Moses et al. 2004; Ray et al. 2008), because we hold out evolutionary information from the TFBS identification process in order to avoid circularity in the subsequent estimation of evolutionary distances. The necessary modeling instead seeks to grade potential mutations for their impact on cis-regulation prior to analyzing information on the actual substitutions found in evolution, in a similar way to methods that determine potentially disruptive protein-coding substitutions, such as PolyPhen (Sunyaev et al. 2001).
Quantifying phenotypic change with such a model suggests a corresponding measurement dT (by analogy to dN and dS) to quantify the putative change in transcriptional function. Although itself a crude approximation of the biochemical process we wish to model, this measurement shows the expected suppression of larger changes over evolutionary time. To correct for the local neutral rate of evolution, we combine dT with the protein-coding dS using the ratio ψ = dT/dS, which can distinguish different functional categories of genes with varying degrees of selection on their promoter regions. The ratio shows strong purifying selection on developmental process genes, as expected, but also shows a potential positive or extensive relaxation of constraint in other functional classes, such as phospholipid biosynthetic process genes.
Results
We used a hidden Markov model (HMM) framework (Durbin et al. 1998) to provide a reasonable model of the competitive binding of an ensemble of transcription factors (TFs), assuming steric hindrance between factors competing for the same segment of DNA. The architecture of the model is shown in Figure 1, and because of its floral resemblance, we call the model Sunflower. Each TF forms a petal of nucleotide-emitting states, with each state parametrized from a column in a PWM, which may come from a public TF database such as JASPAR (Vlieghe et al. 2006) or TRANSFAC (Matys et al. 2006), or from high-throughput protein-binding microarray experiments (Mukherjee et al. 2004; Bulyk 2006). For the analysis presented here we used vertebrate JASPAR CORE PWMs, specifically those listed in Supplemental Table 1. A single unbound state represents parts of the DNA not bound by a factor, and it is parameterized using the base composition of the whole genome. The entry probability to the unbound state was arbitrarily set to 0.99, representing a postulated prior that the fraction of nucleotides bound to TFs is on the order of magnitude of 1%. The entry probability to each TF petal, roughly analogous to the cellular concentration of each factor, is set flat for all factors. This equally divides the remaining 0.01 probability for entry to a petal. Ideally, the model would summarize effects across all cell types, which precludes setting these values according to the concentrations of individual TFs under particular cellular conditions. Because we lack the knowledge necessary to integrate the expression levels of genes in every cell type over evolutionary history, we used this arbitrary flat prior.
Figure 1.

Toy example schematic of a Sunflower model for TFs. (Circle) Silent state, (squares) emitting states, (arcs) transitions between states with nonzero probability. The transition probability is either designated by a label, or is 1 in the case of unlabeled areas. (Squares with ellipses) Arbitrary number of sequential states. This toy example includes TFs A, B, C, and D, each one with a petal of emitting states, labeled such that D.0 corresponds to the first column of the D PWM, and D.n the last column. The arc from empty space indicates the initial state of the model.
The HMM forward–backward algorithm allows the efficient calculation of the marginal probability of each factor explaining each base, analogous to the base being bound by the factor. This means that for each base in the sequence, the algorithm calculates a vector of the marginal probabilities for each PWM column summarizing the combined behavior of the ensemble of TFs at that position. Although this model is admittedly simple, with no provision for different concentrations of factors or different potential cooperative modes between factors, it does maintain many useful known aspects of TF biology. In particular, it considers a continuous range of TF affinities for different genomic sites and steric effects between factors.
In this simulation it is possible for a single mutation to effect a longer chain of binding sites due to changes in steric overlap. An illustration of this domino effect is shown in Figure 2, where a single mutation changes the predicted binding not only at NR1H2-RXR, PPARG-RXRA, and T binding sites directly overlapping the mutation, but also at the predicted nearby NR3C1, REL, Roaz, SP1, and Spz1 binding sites, leading to a complete reorganization of the predicted binding occupancy on this promoter.
Figure 2.

Changes in predicted binding profile for a guanine-to-thymine mutation at position +29 of ENST00000373379, a transcript of UPRT, uracil phospho-ribosyltransferase. (Green lines) Probability of eight individual TFs binding to the reference sequence, or the probability that a region is unbound (upper right panel). The names above the TF binding panels refer to JASPAR PWM names, and the corresponding Human Genome Organization Nomenclature Committee (HGNC) symbols are contained in Supplemental Table 1. (Orange lines) Probability that a TF binds the mutated sequence. These displayed changes, when added to smaller changes for other TFs, represent a binding shift t of 124.8 (see Results and Methods).
In order to investigate the importance of the domino effect, we compared probabilities estimated with this joint model with probabilities estimated with 89 similar models where we included only one PWM at a time. We defined proximal promoter sequences as 1400 bp around 17,600 transcription start sites (TSSs) in the human genome. We took the probability distribution inferred using each single-motif model at each proximal promoter sequence position, and the probability distribution generated from the cognate portion of the joint model (see Methods). The median relative entropy per nucleotide calculated between these two distributions for each model is 0.6 bits, which means the joint model provides a large amount of additional information over a 1400-bp promoter.
To examine the impact of a potential mutation in the joint model, we introduce it into the sequence and recalculate the marginal probability vector for the mutated sequence at every position, not just the mutated position. We then add together the relative entropies (Durbin et al. 1998) for each pair of marginal probability vectors (both the reference and the mutated sequence). We refer to the sum as the binding shift of the mutation and denote it by the symbol t (see Methods).
To explore the properties of the new t measurement, we exhaustively simulated every possible point mutation in the human promoters (4200 changes per promoter, 73,920,000 overall). We then compared the human sequences with aligned sequences in the dog genome, chosen because it was distantly related enough for many neutral changes to occur, yet close enough that the effects of selection on cis-regulation would still be observable. We separated the changes observed in dog (4,069,878, 8% of the mutations at a human position aligned to a dog nucleotide). Figure 3 shows the mean t for both changes observed and unobserved in dog averaged at each TSS-relative position.
Figure 3.

Aggregation plot of the binding shifts of 17,600 human genes, averaged within two groups: one where the simulated mutation was observed in dog (green circles, solid line), and one where it was unobserved (orange crosses, dashed line). (A) Local regressions for ±700 bp around the TSS, estimated with the loess (Cleveland and Devlin 1988) function in R (R Development Core Team 2007), with second-degree polynomials and α = 0.1. Shaded regions in this plot are magnified as separate panels below to show mean binding shifts at individual positions proximal to (B) and more distal from (C) the TSS.
Overall, t rises steadily as mutations approach the TSS, as expected from the increase in density of TF binding sites. More importantly, there is a strong separation over the TSS of the observed from the unobserved mutations, leading to consistently higher t values in the unobserved portion. Both the overall shape of this plot and its consistency with the prediction that higher t mutations are less favored by the predominantly selectively neutral changes accepted over evolutionary time suggest that this measurement models something that correlates with evolutionary acceptance of mutations near TSSs.
For confirmation, we repeated this analysis on mouse–rat aligned proximal promoters and found similar results (Supplemental Fig. 1). We found different results when looking human–dog aligned regions (Supplemental Fig. 2) with enhancer activity validated in transgenic mice (Pennacchio et al. 2006), or into human–dog aligned ancestral repeats (Supplemental Fig. 3; Paten et al. 2008). The relatively flat binding shift lines in these results lead us to conclude that with the input PWMs used, this model will primarily detect signatures of selection in proximal promoter regions rather than enhancer regions or negative control ancestral repeat regions.
The t measurement provides an approximation to the binding occupancy change of a mutation, which is the simplest predictable phenotypic change in a promoter, much like the number of changed residues in a protein is the simplest measurement of phenotypic change in a protein. We also sum up the total potential change of a promoter, considering every possible mutation, and call this T. Interestingly, different classes of genes, as determined by Gene Ontology (GO) (Gene Ontology Consortium 2006) annotations, show varying levels of this inherent propensity to change (see Supplemental Tables 1–6). Genes involved in developmental processes are expected to have complex, finely tuned promoters, and therefore are expected to have high T. Somewhat more unexpected in high-T genes are those involved in phosphorylation and the cell cycle. Interestingly, these GO terms are also excluded from copy number variant (CNV) regions (Redon et al. 2006).
In order to examine how actual changes affect the binding profile, we can sum up only those values of t that correspond to observed substitutions. To control for different inherent propensities to change, we divide by the potential total binding shift T, and then transform this proportion using the Jukes–Cantor model (Jukes and Cantor 1964) to correct for multiple substitutions along an evolutionary lineage (see Methods). This results in a transcriptional distance measurement dT.
We developed an evolutionary measurement, which we call ψ, by analogy to the protein-coding ω parameter for the nonsynonymous-to-synonymous substitution rate ratio. For ψ, we wish to control both for the inherent binding shift mutability and for the local mutation rate, so we take dT and divide it by the local neutral mutation rate dS, analogously to dN/dS. The measurement ψ = dT/dS therefore summarizes our approximation of the binding occupancy change in a promoter due to mutations, normalizing for both local mutation rate and inherent mutability of a promoter.
Values of human–dog ψ are not strongly correlated to the local mutation rate, measured either using synonymous coding sites (Supplemental Fig. 6; rS = −0.51; P < 2.2 × 10⁻¹⁶) or at introns (Hoffman and Birney 2007) (Supplemental Fig. 7; rS = −0.24; P < 2.2 × 10⁻¹⁶). Neither is it correlated to the raw mutability (T) of each promoter (Supplemental Fig. 8; rS = −0.20; P < 2.2 × 10⁻¹⁶). This suggests that ψ captures an aspect of biology independent of these quantities, such as selection on promoters, just as ω captures for coding sequence. While others have identified purifying selection adjacent to the TSS (Taylor et al. 2006), we can identify a potential mechanism for this selection.
Considering classes of genes with high or low amounts of selective pressure on promoters provides interesting insights into biology. Focusing first on cellular components, it has long been known that plasma membrane and extracellular compartments show strong enrichment for high values of the protein-coding ω. The transcriptional ψ, however, shows an almost perfect contrast to this, with these compartments showing striking enrichment for low ψ values (Fig. 4). Turning to more specific functional categories, Figure 5 shows a scatter plot of median ψ against median ω for biological process and molecular function GO terms with at least 10 genes annotated. It is clear that ψ and ω are not strongly correlated for functional classes of genes (rS = 0.081; P = 9.87 × 10⁻¹²), nor are they correlated on a gene by gene basis (Supplemental Fig. 4; rS = 0.10; P < 2.2 × 10⁻¹⁶). More importantly, functional classes enriched for high ω are rarely enriched for high ψ, and vice versa. This implies that positive selection amongst genes associated with a GO term predominantly works in a single modality. In contrast, many of the categories that show negative selection in both the transcriptional and protein-coding measurements, having low ω and low ψ, agree with perceptions of transcriptional complexity, with terms such as sensory organ development (low ψ: P = 7 × 10⁻⁶, q < 1 × 10⁻⁴; low ω: P = 2 × 10⁻⁵, q < 1 × 10⁻⁴) and transcription factor activity (low ψ: P = 5 × 10−38, q < 1 × 10⁻⁴; low ω: P = 4 × 10⁻⁵, q = 6 × 10⁻⁴) enriched in both modalities. As expected, there are genes showing evidence of strong transcriptional negative selection with no striking shift in protein selection, such as those associated with signal transduction (low ψ: P = 8 × 10⁻¹⁷, q < 1 × 10⁻⁴; low ω: P = 0.5, q = 1), cell adhesion (low ψ: P = 8 × 10⁻¹⁰, q < 1 × 10⁻⁴; low ω: P = 1, q = 1), and cell migration (low ψ: P = 3 × 10⁻⁵, q = 2 × 10⁻⁴; low ω: P = 0.1, q = 1). Finally, gene classes enriched for more positive transcriptional selection (high ψ) without striking changes in protein evolution include phospholipid biosynthetic process genes (high ψ: P = 2 × 10 5, q = 3 × 10⁻⁴; high ω: P = 0.6, q = 1) such as CEPT1 (ψ = 2.24; ω = 0.04), and DNA repair genes (high ψ: P = 3 × 10⁻¹⁰, q < 1 × 10⁻⁴; high ω: P = 0.006, q = 0.07) such as UBE2B (ψ = 2.53; ω = 0.002).
Figure 4.

Box plot of ψ = dT/dS values arranged by GO cellular component term, for each term associated with significantly high (above dividing line) or low (below dividing line) ψ values, as determined by the Wilcoxon rank sum test (P < 1 × 10⁻⁴) performed by FUNC (see Methods). The vertical bar in each box indicates the median ψ, the extents of each box the first and third quartiles of ψ, and the whiskers extend to the furthest data point that is no more than 1.5 times the interquartile range from the nearest quartile. High outliers are used in calculating statistics, but are omitted from the display for clarity.
Figure 5.

Scatter plot of median ψ = dT/dS versus median ω = dN/dS for the genes in 1402 GO terms. Only terms that are annotated on at least 15 genes are shown. The term has a significantly high or low value of ψ (blue), ω (red), both measurements (yellow), or neither measurement (gray), as determined by FDR threshold q < 0.05. Labels indicate the terms with the 10 highest and 10 lowest ψ values.
Discussion
We have developed, assessed, and used a new series of measurements that aim to capture the effect of DNA sequence change on transcriptional regulation. Although our model crudely approximates the known complexity of this process and does not include more poorly understood processes such as TFBS turnover (Dermitzakis and Clark 2002), it is not obviously less sophisticated than the dN/dS measurement commonly and successfully used to study protein-coding evolution. An important component to the Sunflower model is that it penalizes the creation of motifs overlapping with existing motifs. The aggregate evolutionary signature of this measurement shows an expected suppression of highly perturbing mutations in both human–dog and mouse–rat promoter comparisons. In contrast, ancestral mammalian repeats, thought to be predominantly neutral, show no difference in predicted impact between observed and unobserved mutations. The functional processes that have transcriptional sensitivity agree with preconceptions derived from our understanding of cellular and molecular biology.
While PWM methods are often used to predict TF occupancy, we cannot be certain that such methods accurately estimate TF binding or transcriptional output. One major limitation of our technique is that it relies on the assumption that the PWM-based method it uses will be accurate much of the time. Another limitation is the lack of a complete set of PWMs for TFs. The development of a number of high-throughput methods for quantifying in vitro binding preferences (Mukherjee et al. 2004) will provide a larger set of matrices over time, and the integration with other methods (Ren et al. 2000; Hudson and Snyder 2006; Robertson et al. 2007; Wang et al. 2007; Jothi et al. 2008) will likely drive the library of accessible matrices closer to completion. It is interesting to note that the set of distal enhancers did not show the same separation of observed versus unobserved changes. The lack of enhancer-specific factors may well be the explanation for this result, as JASPAR's contents have a bias toward promoter-associated TFs.
A more complex problem is how to set the entry probabilities to each petal. We have chosen to take a uniform prior as a way to handle the large diversity of cell types that vary in expression values. Potentially, one could consider integrating this signal over a variety of relative expression levels of the transcription factors at the expense of a more computationally expensive procedure. Related to this problem is the issue of redundancy in PWMs. The JASPAR database provides a curated PWM set with some efforts made toward eliminating redundancy. The JASPAR PWMs used in this study (Supplemental Table 1) include a pair of PWMs representing different motifs recognized by one protein (ZNF42_1-4, ZNF42_5-13), two motifs recognized by dimers that include one overlapping protein (HAND1-TCF3, TAL1-TCF3), and two pairs of PWMs from the same protein recognizing similar motifs but with data from different sources (NFKB, NFKB1; RORA, RORA1). In reality, some redundancy is acceptable because there are likely to be some transcription factors with similar motifs in vivo. Increasing the number of TFs considered by the model will increase the redundancy in motifs yet still more accurately model the actual processes in living cells.
It is feasible to imagine more complex impact models than the one presented here, such as considering compensatory creation of new binding sites in a TFBS turnover model, at the conceptual and computational expense that comes with more complicated models. This would be analogous to integrating structural adjacency of amino acids for protein selection. It is interesting to note that, probably due to the complexity of a more advanced model, the simpler site-wise model in protein sequences has remained the predominant evolutionary model.
The ψ measurement generated using pairwise alignments shows a weak correlation between orthologs in different clades (Supplemental Fig. 5; rS = 0.33; P < 2.2 × 10⁻¹⁶). This means that this measure of selection is consistent between clades, at least within mammals, although obviously it will not have the same consistency as ω measurements generated from a maximum likelihood method on a single multiple alignment. It would be possible to use the Sunflower method to find pairwise dT values for multiple species pairs from a single alignment, but effective use of multispecies alignments would require integration of the Sunflower change model during the sampling of potential ancestral sequences in the tree. This is an interesting approach that requires both more theoretical and practical work. Similar to the research arising from the dN/dS model, the pairwise model presented here would be the starting point for that work.
The protein-coding ω measurement has the property that neutral changes are predicted (and observed) to be around ω = 1, while the ψ measurement does not come with such a principle for its interpretation. Much of the use of ω, however, consists in averaging values over several genes, where identifying deviations from the bulk distribution (as performed in this analysis) is the primary mode of analyzing gene sets. In contrast, the ψ measurement lends itself more naturally to the joint analysis of multiple changes, such as those found on haplotypes. As genome-wide association studies implicate haplotypes, and extensive resequencing (Kaiser 2008) will provide a complete set of changes on nearly all common haplotypes, a haplotype-level analysis of functional changes will become a more important form of analysis. Integration of these mechanistic models with expression quantitative trait locus studies (Veyrieras et al. 2008) in the context of complete sequencing will provide an interesting comparison.
Many of the associations of ψ were expected, such as the suppression of promoter changes in signal transduction and developmental genes. The bulk suppression of ψ in genes associated with extracellular components and the plasma membrane is more puzzling, in particular given the striking signals of positive selection in these proteins (Kim et al. 2007). Alternatively, inappropriate expression of many extracellular proteins may have a far more deleterious effect, given their potential to interact with other components outside of the cell. More generally, ψ is not strongly correlated with the protein-coding ω, showing a very different behavior of transcriptional selection compared with protein-coding selection.
In this work, we focused on an evolutionary analysis of intramammalian substitutions, although one could apply the same framework both to other clades and to other mutational processes, such as natural polymorphisms and somatic changes discovered in cancer. In the latter two cases the low rate of change will make gaining statistical power hard, just as analyzing protein changes also requires extensive aggregation of signals (Stratton et al. 2009). With the large number of sequenced genomes appropriate for this analysis and the aggressive generation of polymorphism and somatic mutation data sets, Sunflower provides a key additional tool in the interpretation of genomic sequence differences.
Methods
Posterior inference
Sunflower does posterior inference using an algorithm we call Sunflower-Reference. The algorithm calculates the posterior probability Pk,i = P(xi | k) that a particular nucleotide xi was emitted by a given state k in the Sunflower model. The results are the same as the standard Forward-Backward algorithm when the silent state is the start state (ksilent = 0).
Posterior inference is equivalent to tracing all of the pathways through this model that can emit a single sequence, and estimating the posterior probability that the model is in each of the states at each position of that sequence. Underlying the model is the physical mechanism that transcription factors are continuously binding and leaving chromosomal sequences, at a rate related to their affinity for the sequence. The statistical mechanics of the biophysical model are approximated by the probabilities that a transcription factor is bound in the sequence model. Indeed, PWMs, which are frequently thought of as purely probabilistic concepts, were originally proposed as part of a statistical mechanics model (Berg and von Hippel 1987).
The new parameters in Sunflower-Reference allow two optimizations. The first is the use of connection set vectors cf and cb, which contain information about which states are connected to which other states, relieving the algorithm from the necessity in each round of doing calculations involving transition probabilities of zero. The other optimization is that one can specify a calculation starting position i to indicate that the intermediate forward matrix F and backward matrix B have already been partially calculated, such that recalculation is only necessary in the forward direction for values >i, and in the reverse direction for values <i.
We wrote Sunflower in the Python language (van Rossum 2006) and inner loops in the C language (Kernighan and Ritchie 1988) for speed.
Comparing joint and single-motif models
We compared the joint model used in the rest of this work with single-motif control models for each motif m to investigate the importance of the domino effect. After performing posterior inference on all of the models, we derived a two-state probability distribution for each motif from the joint model at each position by taking P(xi | m) and 1 − P(xi | m). We then compared each probability distribution generated from the joint model Pjoint with the equivalent probability distributions from the single-motif model Psingle by taking the relative entropy H(Pjoint ‖ Psingle) .
The binding shift t
The algorithm used to investigate the effects of mutations can be described simply. First, run the Sunflower-Reference algorithm with a Sunflower model and a nucleic acid sequence to get the posterior probability matrix P. Then use the Sunflower-Mutate algorithm to calculate the relative entropy H(P ‖ P′) = t for each position i and each nucleotide 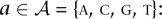
- Sunflower-Mutate(A, E, X = (x1…xn), F = (fk,x)m×n, B, P)
This algorithm includes a significant optimization over the naive implementation, because it uses the three extra arguments in Sunflower-Reference to avoid rerunning the whole Forward-Backward algorithm each time. Only those columns j of the forward matrix where j ≥ i and the backward matrix where j ≤ i are recalculated, as the left and right partitions of these two matrices, respectively, would have the same value as when calculated from the reference sequence.
Sunflower avoids the binary classification of binding and thresholds commonly used in TFBS finders, as they are not essential to the biology of transcription finding (Roider et al. 2007), and uses a probabilistic model instead. The result of Sunflower-Reference is a two-dimensional matrix of the posterior probabilities defined at each position for each PWM column of all TFs in the input set. These values specify how likely it is that a particular TF binds to a particular string of positions.
The promoter distance dT
One can think of the binding shift measurement t introduced above as a measurement of the synonymity of a particular nucleotide. To get a measurement of the potential disruption in TF binding for a gene, T, similar to the total number of nonsynonymous nucleotides, N, one first must select a region of interest. We limit our inspection to only those nucleotides we are most sure have an effect on transcripts by selecting the region [−100, + 100) relative to the TSS. These are the nucleotides where t is highest on average. If the value of T is used for further comparisons to an aligned sequence, then we exclude positions that do not align. We use P to refer to the set of included positions in the region of interest.
Inspired by the logic used by Nei and Gojobori (1986) to assign a fractional synonymity to protein-coding nucleotides that are only partially degenerate, we consider the average binding shift from the reference nucleotide to all other possibilities as a measurement of the potential disruption for that nucleotide. Summing the values for all these nucleotides, and dividing by 3, the number of different possible substitutions, we get
To compare a human promoter with sequence X = (x0…xn) with the promoter in a related species, we limit to only those alignments of upstream regions of Ensembl orthologs with fewer than 25% gap columns. We call the sequence in the other species Y = (y0…yn), and the two positions align at each position i. With Y, we can define the amount of observed binding profile disruption
Since  whenever xi = yi, Td is nonzero only at positions where the two sequences differ. While
  may be larger than the average t for any given position, this is unlikely to be true across the whole gene.
Using T and Td, we can calculate a proportion of binding profile disruption
analogous to pN and pS (Nei and Gojobori 1986). We use the Jukes–Cantor equation (Jukes and Cantor 1964), which performs a proportion such as this into a distance measurement
Gene Ontology enrichment analysis
We use FUNC (Prüfer et al. 2007) to determine GO terms enriched for a particular gene set (hypergeometric test) or for low or high values of various measurements associated with genes (Wilcoxon rank sum test). Considering the genes in a specified set as marked, the hypergeometric test compares the number of marked genes associated with a GO term with the number of marked genes associated with any term in a specific ontology. The Wilcoxon rank sum test involves rank-ordering genes by a measurement, and then comparing the ranks of the genes associated with one GO term with the ranks of the other genes associated with any other term in a specific ontology. We use the false discovery rate (FDR) reported by FUNC as an FDR threshold q (Storey and Tibshirani 2003). To alleviate the multiple testing problem, we consider a term to be enriched only when q < 0.05. For measurements that involve alignments of potential transcriptional regulatory regions, we include in the analysis only those sequences where fewer than 50 of the pairwise alignment columns include gaps.
Acknowledgments
This material is based upon work supported under a National Science Foundation Graduate Research Fellowship. We thank Kathryn Beal and Michael Schuster for providing data used in the analysis. We thank Benedict Paten and three anonymous reviewers for helpful comments on the manuscript.
Footnotes
[Supplemental material is available online at http://www.genome.org. The Sunflower package and source code are available at http://www.ebi.ac.uk/∼hoffman/software/sunflower/.]
Article published online before print. Article and publication date are at http://www.genome.org/cgi/doi/10.1101/gr.096719.109.
References
- Adams MD, Celniker SE, Holt RA, Evans CA, Gocayne JD, Amanatides PG, Scherer SE, Li PW, Hoskins RA, Galle RF, et al. 2000. The genome sequence of Drosophila melanogaster. Science 287: 2185–2195 [DOI] [PubMed] [Google Scholar]
- Berg OG, von Hippel PH 1987. Selection of DNA binding sites by regulatory proteins. Statistical-mechanical theory and application to operators and promoters. J Mol Biol 193: 723–750 [DOI] [PubMed] [Google Scholar]
- Boyko AR, Williamson SH, Indap AR, Degenhardt JD, Hernandez RD, Lohmueller KE, Adams MD, Schmidt S, Sninsky JJ, Sunyaev SR, et al. 2008. Assessing the evolutionary impact of amino acid mutations in the human genome. PLoS Genet 4: e1000083 doi: 10.1371/journal.pen.1000083 [DOI] [PMC free article] [PubMed] [Google Scholar]
- Bulyk ML 2006. DNA microarray technologies for measuring protein–DNA interactions. Curr Opin Biotechnol 17: 422–430 [DOI] [PMC free article] [PubMed] [Google Scholar]
- C. elegans Sequencing Consortium 1998. Genome sequence of the nematode C. elegans: A platform for investigating biology. Science 282: 2012–2018 [DOI] [PubMed] [Google Scholar]
- Cleveland WS, Devlin SJ 1988. Locally-weighted fitting: An approach to fitting analysis by local fitting. J Am Stat Assoc 83: 596–610 [Google Scholar]
- Dermitzakis ET, Clark AG 2002. Evolution of transcription factor binding sites in mammalian gene regulatory regions: Conservation and turnover. Mol Biol Evol 19: 1114–1121 [DOI] [PubMed] [Google Scholar]
- Dermitzakis ET, Bergman CM, Clark AG 2003. Tracing the evolutionary history of Drosophila regulatory regions with models that identify transcription factor binding sites. Mol Biol Evol 20: 703–714 [DOI] [PubMed] [Google Scholar]
- Durbin R, Eddy SR, Krogh A, Mitchison G 1998. Biological sequence analysis, 1st ed Cambridge University Press, Cambridge [Google Scholar]
- Eyre-Walker A 2006. The genomic rate of adaptive evolution. Trends Ecol Evol 21: 569–575 [DOI] [PubMed] [Google Scholar]
- Foat BC, Morozov AV, Bussemaker HJ 2006. Statistical mechanical modeling of genome-wide transcription factor occupancy data by MatrixREDUCE. Bioinformatics 22: e141–e149 [DOI] [PubMed] [Google Scholar]
- Gene Ontology Consortium 2006. The Gene Ontology (GO) project in 2006. Nucleic Acids Res 34: D322–D326 [DOI] [PMC free article] [PubMed] [Google Scholar]
- Goldman N, Yang Z 1994. A codon-based model of nucleotide substitution for protein-coding DNA sequences. Mol Biol Evol 11: 725–736 [DOI] [PubMed] [Google Scholar]
- Granek JA, Clarke ND 2005. Explicit equilibrium modeling of transcription-factor binding and gene regulation. Genome Biol 6: R87 doi: 10.1186/gb-2005-6-10-r87 [DOI] [PMC free article] [PubMed] [Google Scholar]
- Haygood R, Fedrigo O, Hanson B, Yokoyama KD, Wray GA 2007. Promoter regions of many neural- and nutrition-related genes have experienced positive selection during human evolution. Nat Genet 39: 1140–1144 [DOI] [PubMed] [Google Scholar]
- Hoffman MM, Birney E 2007. Estimating the neutral rate of nucleotide substitution using introns. Mol Biol Evol 24: 522–531 [DOI] [PubMed] [Google Scholar]
- Hudson ME, Snyder M 2006. High-throughput methods of regulatory element discovery. Biotechniques 41: 673–681 [DOI] [PubMed] [Google Scholar]
- Hurst LD 2002. The Ka/Ks ratio: Diagnosing the form of sequence evolution. Trends Genet 18: 486–487 [DOI] [PubMed] [Google Scholar]
- Jothi R, Cuddapah S, Barski A, Cui K, Zhao K 2008. Genome-wide identification of in vivo protein-DNA binding sites from ChIP-seq data. Nucleic Acids Res 36: 5221–5231 [DOI] [PMC free article] [PubMed] [Google Scholar]
- Jukes TH, Cantor CR 1964. Evolution of protein molecules. In Mammalian protein metabolism (ed. Munro HN, Allison JB), pp. 21–132 Academic Press, New York [Google Scholar]
- Kaiser J 2008. A plan to capture human diversity in 1000 genomes. Science 319: 395. [DOI] [PubMed] [Google Scholar]
- Kernighan BW, Ritchie DM 1988. The C programming language, 2nd ed Prentice Hall, Englewood Cliffs, NJ [Google Scholar]
- Kim PM, Korbel JO, Gerstein MB 2007. Positive selection at the protein network periphery: Evaluation in terms of structural constraints and cellular context. Proc Natl Acad Sci 104: 20274–20279 [DOI] [PMC free article] [PubMed] [Google Scholar]
- King MC, Wilson AC 1975. Evolution at two levels in humans and chimpanzees. Science 188: 107–116 [DOI] [PubMed] [Google Scholar]
- Kosiol C, Holmes I, Goldman N 2007. An empirical codon model for protein sequence evolution. Mol Biol Evol 24: 1464–1479 [DOI] [PubMed] [Google Scholar]
- Lander ES, Linton LM, Birren B, Nusbaum C, Zody MC, Baldwin J, Devon K, Dewar K, Doyle M, FitzHugh W, et al. 2001. Initial sequencing and analysis of the human genome. Nature 409: 860–921 [DOI] [PubMed] [Google Scholar]
- Li WH, Wu CI, Luo CC 1985. A new method for estimating synonymous and non-synonymous rates of nucleotide substitution considering the relative likelihood of nucleotide and codon changes. Mol Biol Evol 2: 150–174 [DOI] [PubMed] [Google Scholar]
- Manke T, Roider HG, Vingron M 2008. Statistical modeling of transcription factor binding affinities predicts regulatory interactions. PLoS Comput Biol 4: e1000039 doi: 10.1371/journal.pcbi.1000039 [DOI] [PMC free article] [PubMed] [Google Scholar]
- Massingham T, Goldman N 2005. Detecting amino acid sites under positive selection and purifying selection. Genetics 169: 1753–1762 [DOI] [PMC free article] [PubMed] [Google Scholar]
- Matys V, Kel-Margoulis OV, Fricke E, Liebich I, Land S, Barre-Dirrie A, Reuter I, Chekmenev D, Krull M, Hornischer K, et al. 2006. TRANSFAC and its module TRANSCompel: Transcriptional gene regulation in eukaryotes. Nucleic Acids Res 34: D108–D110 [DOI] [PMC free article] [PubMed] [Google Scholar]
- McDonald JH, Kreitman M 1991. Adaptive protein evolution at the Adh locus in Drosophila. Nature 351: 652–654 [DOI] [PubMed] [Google Scholar]
- Miyata T, Yasunaga T 1980. Molecular evolution of mRNA: A method for estimating evolutionary rates of synonymous and amino acid substitutions from homologous nucleotide sequences and its application. J Mol Evol 16: 23–36 [DOI] [PubMed] [Google Scholar]
- Moses AM, Chiang DY, Kellis M, Lander ES, Eisen MB 2003. Position specific variation in the rate of evolution in transcription factor binding sites. BMC Evol Biol 3: 19 doi: 10.1186/1471-2148-3-19 [DOI] [PMC free article] [PubMed] [Google Scholar]
- Moses AM, Chiang DY, Pollard DA, Iyer VN, Eisen MB 2004. MONKEY: Identifying conserved transcription-factor binding sites in multiple alignments using a binding site-specific evolutionary model. Genome Biol 5: R98 doi: 10.1186/gb-2004-5-12-r98 [DOI] [PMC free article] [PubMed] [Google Scholar]
- Mouse Genome Sequncing Consortium 2002. Initial sequencing and comparative analysis of the mouse genome. Nature 420: 520–562 [DOI] [PubMed] [Google Scholar]
- Mukherjee S, Berger MF, Jona G, Wang XS, Muzzey D, Snyder M, Young RA, Bulyk ML 2004. Rapid analysis of the DNA-binding specificities of transcription factors with DNA microarrays. Nat Genet 36: 1331–1339 [DOI] [PMC free article] [PubMed] [Google Scholar]
- Mustonen V, Kinney J, Callan CG, Lässig M 2008. Energy-dependent fitness: A quantitative model for the evolution of yeast transcription factor binding sites. Proc Natl Acad Sci 105: 12376–12381 [DOI] [PMC free article] [PubMed] [Google Scholar]
- Nei M, Gojobori T 1986. Simple methods for estimating the numbers of synonymous and nonsynonymous nucleotide substitutions. Mol Biol Evol 3: 418–426 [DOI] [PubMed] [Google Scholar]
- Nei M, Kumar S 2000. Molecular evolution and phylogenetics Oxford University Press, Oxford, UK [Google Scholar]
- Nielsen R 2001. Statistical tests of selective neutrality in the age of genomics. Heredity 86: 641–647 [DOI] [PubMed] [Google Scholar]
- Paten B, Herrero J, Beal K, Fitzgerald S, Birney E 2008. Enredo and Pecan: Genome-wide mammalian consistency-based multiple alignment with paralogs. Genome Res 18: 1814–1828 [DOI] [PMC free article] [PubMed] [Google Scholar]
- Pennacchio LA, Ahituv N, Moses AM, Prabhakar S, Nobrega MA, Shoukry M, Minovitsky S, Dubchak I, Holt A, Lewis KD, et al. 2006. In vivo enhancer analysis of human conserved non-coding sequences. Nature 444: 499–502 [DOI] [PubMed] [Google Scholar]
- Perler F, Efstratiadis A, Lomedico P, Gilbert W, Kolodner R, Dodgson J 1980. The evolution of genes: The chicken preproinsulin gene. Cell 20: 555–566 [DOI] [PubMed] [Google Scholar]
- Prüfer K, Muetzel B, Do HH, Weiss G, Khaitovich P, Rahm E, Pääbo S, Lachmann M, Enard W 2007. FUNC: A package for detecting significant associations between gene sets and ontological annotations. BMC Bioinformatics 8: 41 doi: 10.1186/1471-2105-8-41 [DOI] [PMC free article] [PubMed] [Google Scholar]
- R Development Core Team 2007. R: A language and environment for statistical computing R Foundation for Statistical Computing, Vienna, Austria [Google Scholar]
- Rajewsky N, Vergassola M, Gaul U, Siggia ED 2002. Computational detection of genomic cis-regulatory modules applied to body patterning in the early Drosophila embryo. BMC Bioinformatics 3: 30 doi: 10.1186/1471-2105-3-30 [DOI] [PMC free article] [PubMed] [Google Scholar]
- Ray P, Shringarpure S, Kolar M, Xing EP 2008. CSMET: Comparative genomic motif detection via multi-resolution phylogenetic shadowing. PLoS Comput Biol 4: e1000090 doi: 10.1371/journal.pcbi.1000090 [DOI] [PMC free article] [PubMed] [Google Scholar]
- Redon R, Ishikawa S, Fitch KR, Feuk L, Perry GH, Andrews TD, Fiegler H, Shapero MH, Carson AR, Chen W, et al. 2006. Global variation in copy number in the human genome. Nature 444: 444–454 [DOI] [PMC free article] [PubMed] [Google Scholar]
- Ren B, Robert F, Wyrick JJ, Aparicio O, Jennings EG, Simon I, Zeitlinger J, Schreiber J, Hannett N, Kanin E, et al. 2000. Genome-wide location and function of DNA binding proteins. Science 290: 2306–2309 [DOI] [PubMed] [Google Scholar]
- Robertson G, Hirst M, Bainbridge M, Bilenky M, Zhao Y, Zeng T, Euskirchen G, Bernier B, Varhol R, Delaney A, et al. 2007. Genome-wide profiles of STAT1 DNA association using chromatin immunoprecipitation and massively parallel sequencing. Nat Methods 4: 651–657 [DOI] [PubMed] [Google Scholar]
- Roider HG, Kanhere A, Manke T, Vingron M 2007. Predicting transcription factor affinities to DNA from a biophysical model. Bioinformatics 23: 134–141 [DOI] [PubMed] [Google Scholar]
- Salser W, Bowen S, Browne D, el Adli F, Fedoroff N, Fry K, Heindell H, Paddock G, Poon R, Wallace B, et al. 1976. Investigation of the organization of mammalian chromosomes at the DNA sequence level. Fed Proc 35: 23–35 [PubMed] [Google Scholar]
- Segal E, Raveh-Sadka T, Schroeder M, Unnerstall U, Gaul U 2008. Predicting expression patterns from regulatory sequence in Drosophila segmentation. Nature 451: 535–540 [DOI] [PubMed] [Google Scholar]
- Sinha S 2006. On counting position weight matrix matches in a sequence, with application to discriminative motif finding. Bioinformatics 22: e454–e463 [DOI] [PubMed] [Google Scholar]
- Storey JD, Tibshirani R 2003. Statistical significance for genomewide studies. Proc Natl Acad Sci 100: 9440–9445 [DOI] [PMC free article] [PubMed] [Google Scholar]
- Stratton MR, Campbell PJ, Futreal PA 2009. The cancer genome. Nature 458: 719–724 [DOI] [PMC free article] [PubMed] [Google Scholar]
- Sunyaev S, Ramensky V, Koch I, Lathe W, Kondrashov AS, Bork P 2001. Prediction of deleterious human alleles. Hum Mol Genet 10: 591–597 [DOI] [PubMed] [Google Scholar]
- Taylor MS, Kai C, Kawai J, Carninci P, Hayashizaki Y, Semple CAM 2006. Heterotachy in mammalian promoter evolution. PLoS Genet 2: e30 doi: 10.1371/journal.pgen.0020030 [DOI] [PMC free article] [PubMed] [Google Scholar]
- van Rossum G 2006. Python reference manual. Python Software Foundation. Hampton, NH: http://docs.python.org/release/2.5/ref/ [Google Scholar]
- Veyrieras JB, Kudaravalli S, Kim SY, Dermitzakis ET, Gilad Y, Stephens M, Pritchard JK 2008. High-resolution mapping of expression-QTLs yields insight into human gene regulation. PLoS Genet 4: e1000214 doi: 10.1371/journal.pgen.1000214 [DOI] [PMC free article] [PubMed] [Google Scholar]
- Vlieghe D, Sandelin A, De Bleser PJ, Vleminckx K, Wasserman WW, van Roy F, Lenhard B 2006. A new generation of JASPAR, the open-access repository for transcription factor binding site profiles. Nucleic Acids Res 34: D95–D97 [DOI] [PMC free article] [PubMed] [Google Scholar]
- Wang H, Johnston M, Mitra RD 2007. Calling cards for DNA-binding proteins. Genome Res 17: 1202–1209 [DOI] [PMC free article] [PubMed] [Google Scholar]
- Wasson T, Hartemink AJ 2009. An ensemble model of competitive multi-factor binding of the genome. Genome Res 19: 2101–2112 [DOI] [PMC free article] [PubMed] [Google Scholar]
- Wong WSW, Nielsen R 2004. Detecting selection in noncoding regions of nucleotide sequences. Genetics 167: 949–958 [DOI] [PMC free article] [PubMed] [Google Scholar]