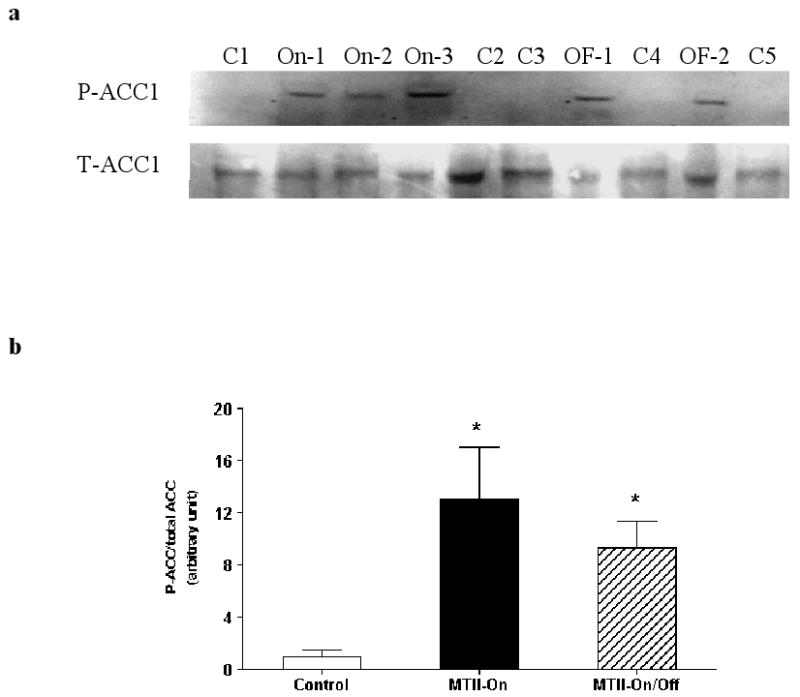
Figure 5.

a, Representative Western blot of phosphorylation of ACC1 (P-ACC1) and total ACC1 (T-ACC1) in PWAT of Control (C1-C5), MTII-On (On-1, On-2 and On-3) and MTII-On/Off (OF-1 and OF-2) samples. b, Degree of ACC1 phosphorylation in PWAT expressed as a ratio of P-ACC1/total ACC1. p = 0.0037 with MTII treatment by one-way ANOVA. By post hoc analysis, P-ACC1 levels were significantly elevated in the MTII-On (p < 0.01) and MTII-On/Off (p < 0.05) groups relative to the Controls.
