Abstract
An ex situ nanoparticle DNA detection assay utilizing DNA modified nanoparticles attached to DNA monolayer gratings on glass substrates is developed. The assay utilizes the simultaneous hybridization of a single stranded DNA (ssDNA) target molecule to both an amine-modified DNA oligonucleotide attached to an amine-reactive glass surface, and a thiol-modified DNA oligonucleotide attached to a 13 nm gold nanoparticle. Surface plasmon resonance imaging (SPRI) measurements are used to characterize the two sequential hybridization adsorption processes employed in the assay, and fluorescence microscopy is used to characterize the formation of DNA monolayer gratings via the photopatterning of the amine-reactive glass slides. First order diffraction measurements utilizing incoherent white light source and a 10 nm bandpass filter centered at 600 nm provided quantitative measurements of target ssDNA down to a concentration of 10 pM. Fourth order diffraction measurements employing a HeNe laser and avalanche photodiode were used to detect target ssDNA adsorption from 10 μL of a solution with a concentration as low as 10 fM, corresponding to 60,000 target DNA molecules. This simple yet sensitive grating-based nanoparticle DNA detection assay should be directly applicable for genetic screening, mRNA expression assays, and microRNA profiling.
I. Introduction
In the area of genomic screening and diagnostics, there is a current need for the direct detection of multiple DNA and RNA sequences at femtomolar concentrations for various microarray assays including SNP genotyping, 1-5 mRNA expression6 and miRNA profiling.7-9 PCR amplification methods can be used to detect a specific DNA sequence in genomic material, but typically have problems uniformly amplifying large sets of DNA sequences simultaneously.10,11 Both direct fluorescence measurements (sandwich assays, molecular beacons)12,13 and refractive index-based methods such as surface plasmon resonance (SPR) have been explored as possible direct detection alternatives to multiplexed PCR.14-16 For example, SPR imaging (SPRI) has been used to directly detect genomic DNA sequences at femtomolar concentrations via the surface enzymatic manipulation of RNA microarrays with ribonuclease H.17,18 Additionally, DNA-modified gold nanoparticles have been employed in conjunction with surface enzymatic reactions to detect microRNA with SPRI at femtomolar concentrations.19
While in situ experiments of DNA hybridization onto microarrays with either SPRI or fluorescence microscopy are very accurate and reproducible, there is a demand for quicker ex situ detection methods similar to those routinely used in gene expression arrays. DNA hybridization adsorption followed by drying and ex situ detection allows for both the easier handling of samples and the detection of very small numbers of molecules via the reduction of target volume (typically down to microliters). Our goal in the work presented here is to create a simple yet sensitive ex situ nanoparticle DNA detection assay that can potentially be used in a microarray format based on the formation of diffraction gratings from patterned DNA monolayers on glass substrates.
Gratings have been used in a variety of methods to monitor bioaffinity adsorption in an in situ format.20-27 For example, researchers have used surface gratings (i) to detect biomolecular adsorption onto patterned gold thin films in a transmission geometry,26 (ii) to monitor changes in patterned polymer films on gold films in an in situ prism format,20-22,24 and (iii) to quantitatively measure protein adsorption onto patterned bioactive monolayers on glass prisms.25 We recently have used SPR gratings on patterned gold surfaces in an in situ prism-based geometry to detect DNA at femtomolar concentrations.27 In contrast with these previous efforts, the nanoparticle grating measurements described here are implemented in a simple ex situ detection scheme in which the sample is dried prior to detection. This ex situ detection methodology is commonly used in mRNA expression measurements.6
Specifically, in this paper we create a simple grating-based assay that utilizes the simultaneous hybridization of a target single stranded DNA (ssDNA) molecule to both an amine-modified DNA oligonucleotide attached to a photopatterned amine-reactive surface and a thiol-modified DNA oligonucleotide attached to 13 nm gold nanoparticles. This assay is depicted schematically in Figure 1. The two sequential hybridization adsorption processes are characterized with SPRI measurements, and the formation of DNA monolayer gratings via photopatterning of the amine-reactive glass slides is characterized with fluorescence microscopy. First order diffraction measurements obtained with an incoherent white light source are used to detect target ssDNA down to a concentration of 10 pM before background light scattering interferes with the signal. Fourth order diffraction measurements using a HeNe laser and avalanche photodiode allow us to avoid this background and measure target ssDNA adsorption at a concentration of 10 fM in 10 μL of solution. This corresponds to a total amount of 0.1 attomoles or 60,000 target DNA molecules.
Figure 1.
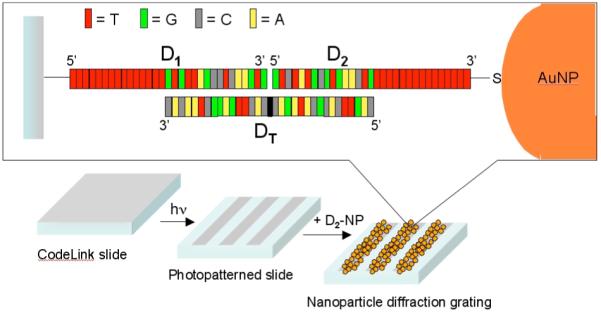
Schematic diagram illustrating the principle of the nanoparticle-based DNA detection assay on glass substrates. The target ssDNA, DT, is simultaneously hybridized to a 5′-amine-modified ssDNA (D1) attached to a photopatterned amine reactive glass slide, and a 3′-thiol-modified ssDNA (D2) attached to a 13 nm gold nanoparticle. The formation of a nanoparticle grating on the surface is detected by transmission optical diffraction.
II. Experimental Considerations
All chemicals were obtained from commercial sources and used as received. MilliQ water (Millipore) was used throughout.
Synthesis of gold nanoparticles capped with ssDNA
Aqueous sodium citrate stabilized Au nanoparticles with a mean diameter of (13±1) nm were synthesized following the Turkevich method28. DNA coated gold nanoparticles were prepared in accordance with well-documented procedures24, 29-30 with the following modification; in the nanoparticles purification stage, removal of excess DNA and reaction by-products was carried out employing 0.2x SSC at pH 7.5. (1x SSC = saline-sodium citrate solution, 150 mM NaCl, 15 mM sodium citrate and 0.1% sodium dodecil sulphate, SDS) as diluent. The DNA used was a 3′-thiol modified single stranded oligonucleotide (D2, IDT, 5 μL, 1 mM) with the sequence D2 = 5′-GTC TAT GCG TGA ACT G (T)15-(CH2)3-SH-3′ The assembly formed of AuNPs and D2 ssDNA is named D2-NP.
Preparation of the glass slides for nanoparticles diffraction gratings
Amine-terminated single stranded DNA (D1) probes were immobilized at discrete locations onto amine-reactive commercial microarray slides based on N-Hydroxysuccinimide (NHS) active ester terminated silane (CodeLink) and then hybridised with the target DNA for sandwich array formation. Amine-reactive microarray glass surfaces were previously studied by Grainger et al 31-33 and their work gives a comprehensive view of the DNA probe immobilization procedure to achieve high target hybridization efficiency.
A first step in preparing DNA sandwich microarrays is the photopatterning, the irradiation of the NHS ester terminated slides with UV light. High energy UV radiation (λ= 260 nm, 400 W power from a mercury-xenon arc lamp) was used to irradiate the glass slides through a chromium grating quartz mask (7.5 μm lines) for one hour. The slides were rinsed with water and dried with nitrogen to remove the NHS-terminated polymer from the exposed areas. Microarrays were fabricated with amine-modified single-stranded DNA probes (D1 = 5′-NH2-(CH2)12 - (T)15 GTG TTA GCC TCA AGT G-3′, IDT Technology) (200 μM, 10 μL) in 100 mM phosphate buffer, 0.3 M NaCl, pH 8.4. Reactions were run for 24 h using commercial glass cover slips (1 oz., premium cover glass, Fisher Scientific) at room temperature under 100% humidity. All slides were soaked in ethanolamine, (50 mM, 0.1 M Tris, pH 9, Sigma) at 50 °C for 30 min to block the residual amine reactive groups followed by incubation in 2x SSC for 30 min. After all slides were rinsed with water and dried with N2 gas, the hybridization reaction with a target ssDNA sequence (DT = 5′-CAG TTC ACG CAT AGA CCA CTT GAG GCT AAC AC-3′, IDT Technology) was performed using a range of concentrations from 1 μM to 10 fM and volumes of 10 μL/slide in 2x SSC under a glass cover slip. The slides were then soaked once in 2x SSC to remove the cover slip followed by rinsing twice in 0.2x SSC. The reason for using 2x SSC as solvent is to optimize the hybridization efficiency on glass, to achieve the ionic strength necessary for the stabilization of backbone interactions in the DNA structure and to avoid the unspecific binding of the biomolecules or metal particles onto the glass surface, that is assisted by the presence of the SDS surfactant. A second hybridization with a single stranded DNA (D2) immobilized onto the 13 nm gold nanoparticles surface was then performed on the wet slides. The particles (10 μL, 3.5 nM in 0.2x SSC) were reacted with the target DNA onto the glass slide for 4 hours at room temperature using the glass cover slip. After the hybridization, slides were soaked 3 times in 0.2x SSC to remove the cover slip and to make sure all unattached DNA was removed from the glass surface. A schematic illustration of the AuNPs diffraction gratings formation is shown in Figure 1, where D1 and D2 are each complementary to half of the DT target DNA. For fluorescence imaging experiments, a Cy3 fluorescently labeled (3′ end) single stranded DNA with the same sequence as the D2 was used (D2-Cy3). The control experiments were performed under similar conditions as described above with the modification that no target DNA was used in the hybridization reaction. Thus, after the printing step, the photopatterned glass slide possessing the amine ssDNA covalently attached is reacted with the D2-NP for the diffraction experiments or with D2-Cy3 for the fluorescence imaging experiments.
Preparation of the slides for SPRI experiments
Gold spotted SF10 glass surfaces were reacted with 1 mM ethanolic solution of 11-Mercaptoundecylamine (MUAM, Dojindo) for 24 h. The slides were rinsed with ethanol to remove unbound thiol and dried with nitrogen. The gold spotted slides were then exposed to an aqueous polyglutamic acid (Sigma) solution for one hour in order to obtain amine reactive surfaces. The amine DNA, D1 (10 μL, 0.250 mM) in 0.1 M triethanolamine (TEA, Sigma) buffer pH 7.2, was then selectively spotted onto the slide and left to react in the presence of 10 mM EDC and 10 mM NHS (Pierce) for 48 h in the 100% humidity chamber at room temperature. The role of this was to create reactive succinimide esters on the surface, which can then combine with the amine group of the DNA molecule and form a peptide bond with the available carboxylic acid groups of the polyglutamic acid. The slides were then rinsed with TEA buffer to remove unbound DNA and dried with N2 gas. Both hybridization reactions with DT and D2 ssDNA were performed in the SPR flow cell for half an hour each.
Instrumentation
Fluorescence images were taken on an inverted fluorescence microscope (Olympus IX71). Surface plasmon resonance imaging experiments were performed using anSPRimager (GWC Technologies) instrument using protocols that have been described in detail elsewhere.16, 34-36 The diffraction experiments were performed using a HeNe laser (λ = 633 nm, 12mW, Research Electro-optics) with the diffracted light measured by an avalanche photodiode detector. The glass slide sample was mounted onto a controllable moving stage to enable the laser beam to move over the entire slide. An adjustable mirror was placed behind the sample to give control over the particular diffraction spot that was sent to the detector. An optical chopper (1000 Hz) was used in connection with a lock-in amplifier (SR510, Stanford Research Systems) to measure the AC voltage signal. In the white light diffraction setup a tungsten lamp and a 10 nm bandpass orange filter centered at 600 nm was used as the light source. The first order diffraction from the sample was measured in transmission and focused onto a fiber optic-coupled monochromator and CCD detector (Ocean Optics).
III. Results and Discussion
A. SPRI measurements of the nanoparticle DNA detection assay
A series of SPR imaging measurements on gold thin films were used to verify the presence and activity of the DNA molecules employed in the nanoparticle DNA detection assay. As shown schematically in Figure 1 and Figure 2a, this assay requires the assembly of three oligonucleotides on the surface: sequence D1 that is attached to the planar substrate, sequence D2 that is attached to the gold nanoparticles, and sequence DT, the target DNA, which binds to both D1 and D2. The three specific DNA sequences used in this paper are listed in the previous section.
Figure 2.
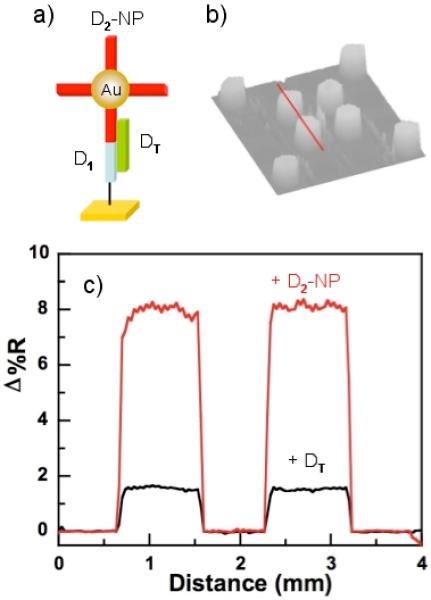
SPRI data of the nanoparticle-based DNA detection assay on gold substrates. (a) Schematic figure of the surface assembly after the first (+DT) and second (+D2-NP) hybridization adsorption events, (b) SPRI difference image of the hybridization absorption of D2-NP onto a DT oligonucleotide array formed by previous hybridization onto a D1 array, (c) The quantitative line profile of the hybridization of D1 onto DT (black line) and of D2-NP onto DT (red line) obtained from the array elements indicated by the line in Figure 2b.
SPRI differential reflectivity measurements of a two-component DNA microarray were first used to monitor the “hybridization adsorption” (i.e., DNA duplex formation on the surface) of DT onto the D1-modified gold surface. The resultant SPRI image and line profile for the hybridization adsorption of DT are shown in Figure 2b and 2c respectively. A differential reflectivity change (Δ%R) of 1.5% was observed upon exposure of the D1-modified surface to a 1 μM solution of DT; this Δ%R is similar to that observed previously for DNA hybridization adsorption, and indicates the formation of a full monolayer of adsorbed DT.37,38
A second SPRI image was obtained after the subsequent exposure of the surface to a 3.5 nM solution of 13 nm gold nanoparticles that were coated with the thiol-modified DNA oligonucleotide D2. A large differential reflectivity increase (6.5%) was observed due to the adsorption of the gold nanoparticles onto the surface (the red line profile in Figure 2c). This large increase is attributed to the coupling of the surface and planar plasmon modes in the gold film and the 13 nm particles as observed previously.19,39
From these SPRI measurements, we can conclude that: (i) there is a uniform attachment of D1 oligonucleotides onto the chemically modified gold surface, (ii) the attached D1 oligonucleotides are able to hybridize with DNA from solution, (iii) the 13 nm gold nanoparticles were successfully modified with thiol-modified D2 oligonucleotides, (iv) the DNA modified nanoparticles are capable of hybridization with DNA from solution, and finally (v) the target DNA molecule DT can simultaneously hybridize to both D1 and D2 to form the three-sequence structure shown schematically in Figure 1. Of course, these SPRI measurements were performed at substantially higher concentrations (high nanomolar) than the intended application range for the diffraction grating measurements (subpicomolar), but they nevertheless confirm that the surface hybridization chemistry required for the nanoparticle-based DNA detection assay is working properly.
B. Monolayer grating fabrication and characterization
A surface grating format was employed to create a simple yet sensitive ex situ version of the nanoparticle-based detection assay described in the previous section. In a recent paper,27 we monitored the nanoparticle-enhanced diffraction from thin film (45 nm) gold gratings with an in situ SPR prism geometry to detect ssDNA down to a concentration of 10 fM. In the present paper, the nanoparticle DNA detection assay is implemented in an ex situ methodology on glass microscope slides. DNA monolayer gratings are created by attaching 5′-amine-modified D1 DNA onto commercially available amine-reactive silane-coated glass slides (Codelink) that are photopatterned through a Cr mask with UV light. It has been demonstrated previously that organic adsorbed films can be removed completely by exposure to short-wavelength UV radiation by photopatterning.40-41 Wavelengths shorter than 260 nm are required to photolyze the silane polymer that is then removed from the surface by rinsing with water. The amine-modified ssDNA was then reacted with the surface to create the chemically attached monolayer; any excess amine reactive sites on the surface were blocked by further reaction of the slides with ethanolamine. In these initial experiments, gratings were formed from evenly spaced 7.5 micron lines; more advanced gratings patterns are envisioned in future experiments.
A series of fluorescence microscopy measurements were used to characterize the monolayer grating photopatterning and the DNA surface hybridization adsorption reactions. In lieu of nanoparticles, the D1-modified grating surface was first exposed to a DT ssDNA solution, followed by a 1 μM solution of fluorescently labelled D2 ssDNA (D2-Cy3). Figure 3c shows representative fluorescence images for DT solution concentrations of 1 μM to 10 nM. Alternating 7.5 um dark and light stripes were observed over the entire concentration range, indicating the formation of a DNA monolayer grating on the surface. Also shown in Figure 3c is a “0 nM” control slide. No patterned fluorescence was observed from this photopatterned slide, in spite of its exposure to a 1 μM D2-Cy3 solution. These experiments allow us to conclude that the amine-reactive surfaces can be photopatterned and then successfully reacted with amine-modified ssDNA to create DNA monolayer gratings, and that non-specific binding of the fluorescent D2-Cy3 ssDNA is negligible in the nanomolar DT detection measurements. Detection of DT using this fluorescence assay was limited to concentrations above 10 pM due to a combination of fluorescence bleaching, CCD sensitivity and non-specific fluorescence background.
Figure 3.
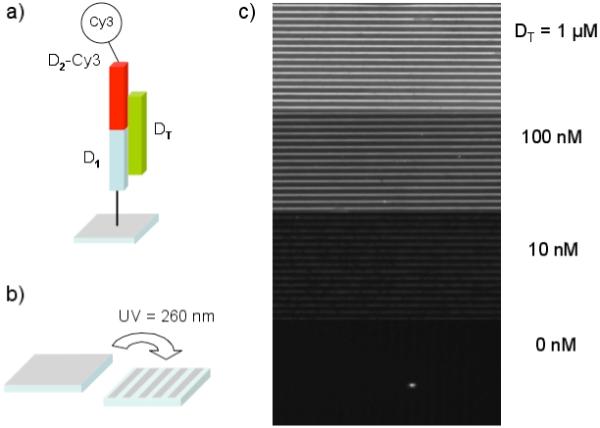
Fluorescence microscopy data from Cy3-modified DNA monolayers created on photopatterned amine-reactive glass substrates. (a) Schematic representation of the three component DNA structure formed on an amine-reactive glass substrate where D1 is amine-modified ssDNA attached to the surface, DT is the target oligonucleotide, and the D2-Cy3 is the oligonucleotide D2 modified with a Cy3 fluorescent tag. (b) An illustration showing the photopatterning of the amine reactive glass slides by means of a Cr mask with 7.5 μm lines and a high intensity UV radiation source. (c) Fluorescence images of the DNA monolayer gratingsafter exposure of the slides to target DT solutions of 1 μM, 100 nM, 10 nM and 0 nM (as the control slide) followed by a 1 μM D2-Cy3 solution.
C. First order diffraction grating experiments with an incoherent light source
Once the specific hybridization adsorption of the DNA modified nanoparticles and the formation of the DNA monolayer surface grating were thoroughly characterized, the two were combined as shown in Figure 1 to create the grating-based nanoparticle DNA detection assay. As a first study, we measured the intensity of the first order diffraction in transmission using a collimated white light source and a 10 nm bandpass filter centered at 600 nm. This wavelength was chosen based on our previous measurements of the diffraction efficiency of 13 nm gold nanoparticles at wavelengths from 400-900 nm.27 The diffraction spot was focused into a monochromator and quantitated for six target DNA (DT) concentrations varying from 1 μM to 10 pM. The spectra from the six DT concentrations are plotted in Figure 4. In the inset of the figure, the diffraction intensity is plotted versus the log of the DT concentration and fit to a Langmuir adsorption isotherm:
| (1) |
where K is the Langmuir adsorption coefficient, c is the aqueous DT concentration, Γ is the surface concentration of occupied D1 surface sites, and Γmax is total number of D1 surface sites. The diffraction intensity was assumed to be linearly proportional to Γ/Γmax, and a Langmuir adsorption coefficient of 1.0 E08 M-1 was obtained from the fit of the data as shown in the inset. This value for K is consistent with the values for the Langmuir adsorption coefficient for DNA hybridization adsorption reported previously.42
Figure 4.
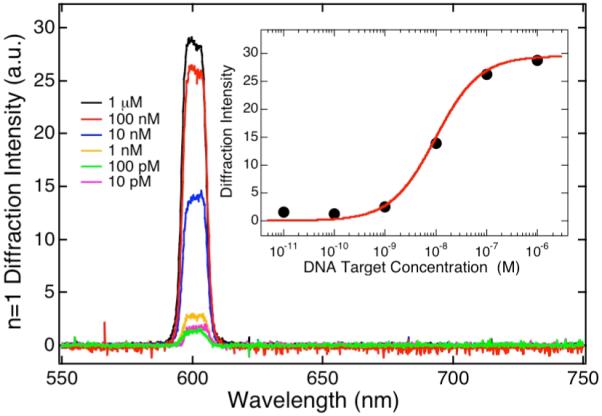
First order diffraction intensity of the nanoparticle-based DNA detection assay as a function of target DT concentration. Optical diffraction was obtained using an incoherent light source and a 10 nm bandpass filter centered at 600 nm in transmission; one of the two first order diffraction spots was focused into a fiber optic-coupled spectrometer to measure the diffraction intensity. The n=1 diffraction spectra observed from six different target concentrations are shown in the figure. The inset plots the n=1 diffraction intensity at 600 nm versus target DNA concentration on a logarithmic scale. The solid line in the inset is a fit of the data to a Langmuir adsorption isotherm with K = 1.0 E08 M-1.
D. Fourth order diffraction grating experiments with a HeNe laser
For DT concentrations lower than 10 pM, background scattering of the incident light obscured the first order diffraction in the incoherent light source experiments. This background was avoided and the DT detection limit was improved to 10 fM by moving to a more powerful light source and monitoring higher order diffraction orders. By replacing the white light source with a 12 mW HeNe laser, a multi-order diffraction pattern was observed in transmission. A diffraction image taken from a glass slide that was exposed to a 100 nM DT solution is shown in Figure 5a. As the quantitative line profile in Figure 5b shows, up to twelve diffraction orders were observed. The diffraction intensity decreased in general for higher orders, but a significant even-odd alternation of the diffraction also was observed. This even-odd alternation is attributed to the Fourier components of the nanoparticle formations on the surface; at 100 nM we expect the surface to be significantly occupied with nanoparticles. Both the image and the line profile of the 100 nM data show significant speckle and light scattering that appear as a background in the line profile at lower diffraction orders. By choosing an order of n=4 or higher, this scattering background can be avoided.
Figure 5.
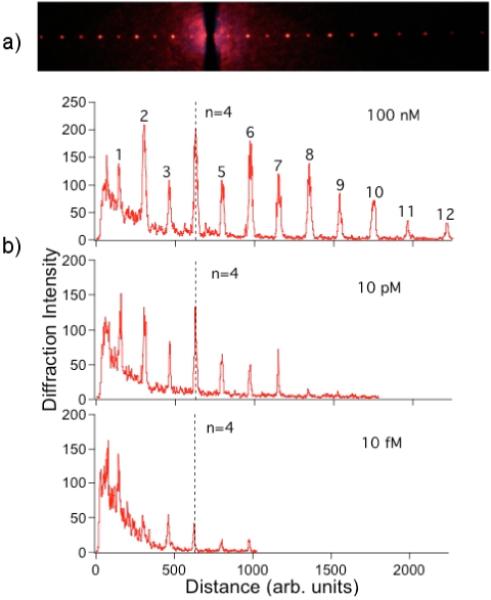
Laser transmission diffraction pattern images and line profiles from the nanoparticle-based DNA detection assay. (a) Optical image of the diffraction patterned obtained from a nanoparticle grating in transmission using a HeNe laser; for this image, the sample had a target DT concentration of 100 nM. (b) Line profiles from optical diffraction pattern images obtained from samples with DT concentrations of 100 nM, 10 pM and 10 fM respectively. The n=4 diffraction spot is removed from the laser light scattering and speckle background at all three concentrations.
Line profiles from diffraction images obtained at a series of concentrations ranging from 10 pM to 10 fM are shown in Figure 5b. The number of higher orders observed in the diffraction pattern decreases as a function of concentration, but even at 10 fM the n=4 diffraction order is clearly visible. The log intensity of the n=4 diffraction spot as obtained from the avalanche photodiode/lock-in amplifier measurements is plotted versus the log DT concentration in Figure 6. The variation in diffraction spot intensity with concentration is not linear, and saturates at concentrations above 1 pM (the solid line is a quadratic fit to the data). This signal saturation is attributed to a combination of nanoparticle surface saturation (one nanoparticle is much larger than a single D1 adsorption site) and the saturation of the avalanche photodiode used in these experiments. The dotted line in Figure 6 is the signal level observed from a control slide that was not exposed to a DT solution; the diffraction intensity from the 1 fM DT sample is of the same size as this background signal and must be discarded. We thus report the detection limit of these initial surface diffraction measurements of the nanoparticle-based DNA detection assay as 10 fM with a S/N ratio of 4. Since a 10 μL DT solution was used in these ex situ measurements, this detection limit corresponds to 60,000 molecules.
Figure 6.
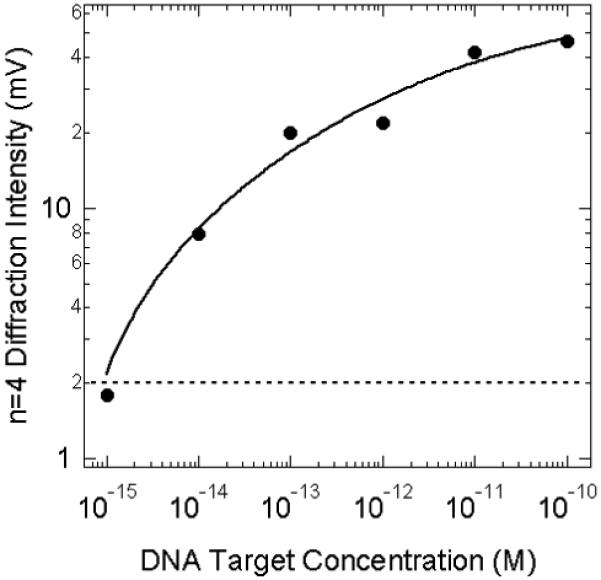
Fourth order diffraction intensity of the nanoparticle-based DNA detection assay as a function of target DT concentration. The log of the n=4 diffraction intensity as obtained from the avalanche photodiode/lock-in amplifier measurements is plotted versus the log of the target DT concentration. The dotted line is the background signal level from a control slide that was not exposed to a DT solution, and the solid line is a parametric fit to the data.
IV. Conclusions
In these initial experiments, we have demonstrated that a simple yet sensitive ex situ nanoparticle-based DNA detection assay can be created using the simultaneous hybridization of a target DNA sequence to a DNA monolayer grating and DNA-modified nanoparticles. A detection limit of 10 fM or 60,000 molecules was established using evenly spaced 7.5 μm gratings; further measurements will explore the use of finer gratings, more complex patterns and, most importantly, the creation of a multiplexed microarray format. We will also explore the use of different nanoparticles (e.g., nanorods) that have potentially larger effects on the grating efficiency at specific wavelengths. Future studies will combine these diffraction measurements with various enzymatic amplification methodologies for even higher sensitivity. As with all ex situ DNA hybridization assays, the variability of the hybridization data is higher as compared with in situ measurements. However, the intrinsic sensitivity of the diffraction grating format plus its high resistance to nonspecific nanoparticle adsorption strongly suggest that this rapid detection methodology can evolve into a routine technique that can be easily implemented in any laboratory.
Acknowledgments
This research was supported by the National Institute of Health (2RO1 GM059622-04 and 1R21 RR018475-01A2), the National Science Foundation (CHE-0551935), and DARPA Micro/Nano Fluidics Fundamentals Focus (MF3) Center at UCI.
References
- 1.Syvanen A-C. Nat. Rev. Genet. 2001;2:930. doi: 10.1038/35103535. [DOI] [PubMed] [Google Scholar]
- 2.Kirk BW, Feinsod M, Favis R, Kliman RM, Barany F. Nucleic Acids Res. 2002;30:3295. doi: 10.1093/nar/gkf466. [DOI] [PMC free article] [PubMed] [Google Scholar]
- 3.Bao YP, Huber MM, Wei T, Marla SS, Storhoff JJ, Muller UR. Nucleic Acids Res. 2005;33:el5. doi: 10.1093/nar/gni017. [DOI] [PMC free article] [PubMed] [Google Scholar]
- 4.Gerion D, Chen F, Kannan B, Fu A, Parak WJ, Chen DJ, Majumdar A, Alivisatos AP. Anal. Chem. 2003;75:4766. doi: 10.1021/ac034482j. [DOI] [PubMed] [Google Scholar]
- 5.Li Y, Wark AW, Lee HJ, Corn RM. Anal. Chem. 2006;78:3158. doi: 10.1021/ac0600151. [DOI] [PMC free article] [PubMed] [Google Scholar]
- 6.Schena M, Shalon D, Davis R, Brown P. Science. 1995;270:467. doi: 10.1126/science.270.5235.467. [DOI] [PubMed] [Google Scholar]
- 7.Arenz C. Angew. Chem. 2006;118:5170. Angew. Chem. Int. Ed. 45, 5048 (2006) [Google Scholar]
- 8.Carthew RW. Curr. Opin. Genet. Dev. 2006;16:203. doi: 10.1016/j.gde.2006.02.012. [DOI] [PubMed] [Google Scholar]
- 9.Rodriguez A, Vigorito E, Clare S, Warren MV, Couttet P, Soond DR, Dongen SV, Grocock RJ, Das PP, Miska EA, Vetrie D, Okkenhaug K, Enright AJ, Dougan G, Turner M, Bradley A. Science. 2007;316:608. doi: 10.1126/science.1139253. [DOI] [PMC free article] [PubMed] [Google Scholar]
- 10.Gonzalez SF, Krug MJ, Nielsen ME, Santos Y, Call DRJ. Clin. Microbiol. 2004;42:1414. doi: 10.1128/JCM.42.4.1414-1419.2004. [DOI] [PMC free article] [PubMed] [Google Scholar]
- 11.Sengupta S, Onodera K, Lai A, Melcher UJ. Clin. Microbiol. 2003;41:4542. doi: 10.1128/JCM.41.10.4542-4550.2003. [DOI] [PMC free article] [PubMed] [Google Scholar]
- 12.Neely LA, Patel S, Garver J, Gallo M, Hackett M, McLaughlin S, Nadel M, Harris H, Gullans S, Rooke J. Nat. Methods. 2006;3:41. doi: 10.1038/nmeth825. [DOI] [PubMed] [Google Scholar]
- 13.Hartig JS, Grune I, Najafi-Shoushtari SH, Famulok M. J. Am. Chem. Soc. 2004;126:722. doi: 10.1021/ja038822u. [DOI] [PubMed] [Google Scholar]
- 14.Lee HJ, Wark AW, Corn RM. Langmuir. 2006;22:5241. doi: 10.1021/la060223o. [DOI] [PMC free article] [PubMed] [Google Scholar]
- 15.Lee HJ, Li Y, Wark AW, Corn RM. Anal. Chem. 2005;77:5096. doi: 10.1021/ac050815w. [DOI] [PubMed] [Google Scholar]
- 16.Wark AW, Lee HJ, Corn RM. Anal. Chem. 2005;77:3904. doi: 10.1021/ac050402v. [DOI] [PubMed] [Google Scholar]
- 17.Goodrich TT, Lee HJ, Corn RM. Anal. Chem. 2004;76:6173. doi: 10.1021/ac0490898. [DOI] [PubMed] [Google Scholar]
- 18.Goodrich TT, Lee HJ, Corn RM. J. Am. Chem. Soc. 2004;126:4086. doi: 10.1021/ja039823p. [DOI] [PubMed] [Google Scholar]
- 19.Fang S, Lee HJ, Wark AW, Corn RM. J. Am. Chem. Soc. 2006;128:14044. doi: 10.1021/ja065223p. [DOI] [PMC free article] [PubMed] [Google Scholar]
- 20.Yu F, Yao D, Knoll W. Nucleic Acids Res. 2004;32:9. doi: 10.1093/nar/gnh067. e75. [DOI] [PMC free article] [PubMed] [Google Scholar]
- 21.Yu F, Tian S, Yao D, Knoll W. Anal. Chem. 2004;76:3530. doi: 10.1021/ac049964p. [DOI] [PubMed] [Google Scholar]
- 22.Yu F, Knoll W. Anal. Chem. 2004;76:1971. doi: 10.1021/ac035369w. [DOI] [PubMed] [Google Scholar]
- 23.Massary AM, Stevenson KJ, Hupp JT. Electroanal. Chem. 2001;500:185. [Google Scholar]
- 24.Tian S, Armstrong NR, Knoll W. Langmuir. 2005;21:4656. doi: 10.1021/la0467741. [DOI] [PubMed] [Google Scholar]
- 25.Goh JB, Tam PL, Loo RW, Goh MC. Anal. Biochem. 2003;313:262. doi: 10.1016/s0003-2697(02)00634-6. [DOI] [PubMed] [Google Scholar]
- 26.Bailey RC, Nam J-M, Mirkin CA, Hupp JT. J. Am. Chem. Soc. 2003;125:13541. doi: 10.1021/ja035479k. [DOI] [PubMed] [Google Scholar]
- 27.Wark AW, Lee HJ, Qavi AJ, Corn RM. Anal. Chem. 2007;79:6697. doi: 10.1021/ac071062b. [DOI] [PubMed] [Google Scholar]
- 28.Turkevich J, Stevenson PC, Hillier J. Discuss. Faraday Soc. 1951;11:55. [Google Scholar]
- 29.Elghanian R, Storhoff JJ, Mucic RC, Letsinger RL, Mirkin CA. Science. 1997;277:1078. doi: 10.1126/science.277.5329.1078. [DOI] [PubMed] [Google Scholar]
- 30.Goodrich GP, Helfrich MR, Overberg JJ, Keating CD. Langmuir. 2004;20:10246. doi: 10.1021/la048434l. [DOI] [PubMed] [Google Scholar]
- 31.Gong P, Grainger DW. Surf. Sci. 2004;570:67. [Google Scholar]
- 32.Cheng F, Gamble LJ, Grainger DW, Castner DG. Anal. Chem. 2007;79:8781. doi: 10.1021/ac0715423. [DOI] [PMC free article] [PubMed] [Google Scholar]
- 33.Gong P, Harbers GM, Grainger DW. Anal. Chem. 2006;78:2342. doi: 10.1021/ac051812m. [DOI] [PubMed] [Google Scholar]
- 34.Smith EA, Corn RM. Appl. Spectroscopy. 2003;57:320 A. doi: 10.1366/000370203322554446. [DOI] [PubMed] [Google Scholar]
- 35.Wilkop T, Wang Z, Cheng Q. Langmuir. 2004;20:11141. doi: 10.1021/la048177k. [DOI] [PubMed] [Google Scholar]
- 36.Shumaker-Parry JS, Campbell CT. Anal. Chem. 2004;76:907. doi: 10.1021/ac034962a. [DOI] [PubMed] [Google Scholar]
- 37.Wark AW, Lee HJ, Corn RM. Anal. Chem. 2005;77:3904. doi: 10.1021/ac050402v. [DOI] [PubMed] [Google Scholar]
- 38.Nelson BP, Grimsrud TE, Liles MR, Goodman RM, Corn RM. Anal. Chem. 2001;73:1. doi: 10.1021/ac0010431. [DOI] [PubMed] [Google Scholar]
- 39.He L, Musick MD, Nicewarner SR, Salinas FG, Benkovic SJ, Natan MJ, Keating CD. J. Am. Chem. Soc. 2000;122:9071. [Google Scholar]
- 40.Howland MC, Sapuri-Butti AR, Dixit SS, Dattelbaum AM, Shreve AP, Parikh AN. J. Am. Chem. Soc. 2005;127:6752. doi: 10.1021/ja043439q. [DOI] [PubMed] [Google Scholar]
- 41.Nakagawa M, Nawa N, Iyoda T. Langmuir. 2004;20:9844. doi: 10.1021/la048606e. [DOI] [PubMed] [Google Scholar]
- 42.Wark AW, Lee HJ, Corn RM. Advanced Methods for SPR Biosensing. In: Schasfoort RBM, Tudos AJ, editors. Handbook of Surface Plasmon Resonance. RSC Publishing; 2008. pp. 251–280. [Google Scholar]


