

Abstract
Progesterone (P4) is a steroid hormone that plays multiple roles in the central nervous system (CNS) including promoting neuroprotection. However, the precise mechanisms involved in its neuroprotective effects are still unknown. Given that the regulation of the intracellular calcium (Ca2+) concentration is critical for cell survival, we determined if inositol 1, 4, 5-trisphosphate receptors (IP3Rs) are relevant targets of P4. Using primary hippocampal neurons, we tested the hypothesis that P4 controls the gain of IP3R-mediated intracellular Ca2+ signaling in neurons and characterized the subcellular distribution and phosphorylation of potential signaling intermediates involved in P4s actions. Our results reveal that P4 treatment altered the intensity and distribution of IP3R immunoreactivity and induced the nuclear translocation of phosphorylated Akt. Further, P4 potentiated IP3R-mediated intracellular Ca2+ responses. These results suggest a potential involvement of P4 in particular and of steroid hormone signaling pathways in general in the control of intracellular Ca2+ signaling and its related functions.
Keywords: Progesterone; intracellular calcium signals; inositol (1,4,5)-trisphosphate receptor; Hippocampal neurons; gonadal steroid hormone; central nervous system
Introduction
Steroid hormones play a regulatory role in a variety of cellular processes such as reproduction, development, differentiation, apoptosis, and brain function1. Many studies have identified that steroid hormones are synthesized not only in peripheral tissues but also in the central nervous system (CNS) as neurosteroids2.
Progesterone (P4), one of these neurosteroids, has multiple biological functions in the CNS, among which is its ability to afford neuroprotection. For example, P4 protects hippocampal neurons from FeSO4-, amyloid β- as well as glutamate-induced cell death3-6. Further, P4 is effective in reducing secondary neuronal loss and the associated cognitive impairment following cortical contusion injury7-8. Although studies continue to demonstrate the neuroprotective potential of P4, our understanding of the likely numerous mechanisms underlying the neuroprotective effects of P4 remain incomplete.
The goal of the present study was to identify what role the neurosteroid P4 plays in controlling intracellular Ca2+ concentrations and Ca2+ signaling in neurons.
Calcium (Ca2+) contributes to signal transduction and acts as an intracellular second messenger in neurons. Ca2+ signaling is highly regulated and dynamic. Intracellular Ca2+ signaling in neurons plays an important role in regulating numerous cellular processes such as gene expression, cell development, neurotransmitter release, and apoptosis9-10. Even small alterations in Ca2+ dependent homeostatic mechanisms contribute to various diseases that involve functional decline or death of cells11-13.
A functional link between P4 and intracellular Ca2+ levels ([Ca2+]i) was seen in non-neuronal systems14, however, the cellular mediators involved in the P4-mediated changes in [Ca2+]i remain to be determined particularly for neurons. What is known is that intracellular Ca2+ channels (ICCs) such as inositol 1, 4, 5-trisphosphate receptors (IP3Rs) are major components of the cytosolic Ca2+ regulation machinery10, 15. Furthermore, several steroid hormones activate other signaling molecules that might in turn lead to activation of ICCs15, 16.
IP3Rs are located predominantly in the endoplasmic reticulum (ER). Activation of phospholipase C by extracellular stimuli including hormones and neurotransmitters leads to hydrolysis of phosphatidylinositol 4,5 bisphosphate (PIP2), generating IP3 and diacylglycerol13. IP3 activates IP3R, leading to release of Ca2+ from intracellular stores, and thus, is capable of contributing to the control of intracellular Ca2+ levels. Drugs that alter Ca2+ release from intracellular stores may affect neuronal function13.
Both estradiol and P4 elicit the phosphorylation of Akt kinase in mouse cerebral cortical cultures16, a signaling protein that has been implicated in the phosphorylation of IP3Rs in non-neuronal cell types and tissues17. Furthermore, Akt activation has been implicated in neuroprotective signaling in neurons6. Therefore, the overall goal of this study was to identify the mechanism by which P4 alters IP3R-mediated Ca2+ release in hippocampal neurons.
We tested the hypothesis that Akt-mediated phosphorylation of IP3R leads to increased IP3R-mediated intracellular Ca2+ release. In addition, we tested the second hypothesis that P4 modifies cellular expression levels and/or distribution of certain components of P4 and Ca2+ signaling pathways as well as IP3R activity. We show that P4, through activation of Akt, potentiates IP3R-mediated Ca2+ release. This work is unique in that it identifies a specific Ca2+ signaling protein target that is activated by Akt through the steroid hormone P4. Furthermore, this work reveals a mechanism for how P4 alters Ca2+ signaling in neurons.
Methods
Preparation of mouse hippocampal neurons and primary cell culture
Hippocampal tissue from 2 day-old mice was removed, minced in Hank’s balanced salt solution (HBSS) and incubated in 0.25% trypsin and 0.1% DNase in phosphate buffered saline (PBS) at 37°C for 20 minutes. Tissue from both sexes was used and no differences in parameters assessed by the present study was detected. The tissue was then briefly triturated with a fire-polished glass pipet. After centrifugation, washing and trituration, the cells were filtered through a 70 μm cell strainer and plated on glass coverslips coated with poly-D-lysine/laminin (BD Biosciences, Bedford, MA). The plated cells were incubated in Neurobasal A Medium with 2% B27 supplement, 1% Horse serum, 0.5% penicillin-streptomycin-fungizone, 1% L-glutamine, and 1% DTT at 37°C in a 5% CO2 humidified environment. Half of the culture medium was replaced every 3 days with Neurobasal A medium containing 3 μM of cytosine arabinoside to prevent proliferation of glial cells resulting in ≥90% neurons.
Immunocytochemistry and microfluorimetry
After 11 days in vitro (DIV), primary hippocampal cultures were washed 3 times with PBS and fixed with 4% paraformaldehyde in PBS for 10 min at room temperature. After washing in PBS, cells were incubated with pre-incubation solution (10% NGS, 1% BSA, 0.05% Triton X-100 in PBS) for 1 hr in a humidified environment at room temperature. Subsequently, cells were incubated with primary antibody diluted in incubation solution (3% NGS, 1% BSA, 0.05% Triton X-100 in PBS) overnight at 4°C (antibodies and related experimental parameters are listed in Table 1). Cultures were double-labeled with an antibody against the protein of interest and with an antibody against neurofilament, 70 KDa as a neuronal marker. The cells were washed in PBS and then incubated with fluorescently-labeled secondary antibody (Alexa fluo 488 goat anti-mouse IgG and Alexa fluo 594 goat anti-rabbit IgG diluted 1:1000 in incubation solution; Molecular Probes, Eugene, OR.) for 1 hr protected from light at room temperature. After washing, cells were mounted on microscope slides with Aqua polymount (Polysciences, Inc., Warrington, PA) or ProLong antifade reagent with DAPI (Molecular Probes, Eugene, OR). Only cells exhibiting positive immunoreactivity for neurofilament were analyzed. Microfluorimetric analysis was performed with fluorescence microscopy and digital imaging as described previously32 (see specifications below, section “Optical imaging”). Cells or cellular regions such as soma or neuritis were randomly selected, identical defined volumes were measured with 3-D deconvolution software for specific intensities, by subtracting intensities for antibody controls from total fluorescence intensities. While every effort was made to improve the quantitation of sample intensity through using non-saturating antibody and fluorochrome concentrations as well as parallel processing of samples and analyses, limitations of immunochemical techniques could not be fully excluded, such as potential non-linearity of low and high signal intensities, lack of comparability of staining intensities from different primary antibodies.
Table 1.
Antibodies and related experimental parameters
| Antibody | Supplier, ID # | Host | Dilution |
|---|---|---|---|
| IP3R1 | Calbiochem, #407144 | rabbit | 1:1000 |
| IP3R2 | Chemicon, #AB9074 | rabbit | 1:500 |
| IP3R3 | Sigma, #I7529 | rabbit | 1:100 |
| Progesterone Receptor | Santa Cruz Biotechnology, #sc-538 | rabbit | 1:500 |
| Phospho-MAP Kinase | Cell Signaling Technology, #9101 | rabbit | 1:400 |
| Phospho-AKT (ser473) | Cell Signaling Technology, #3787 | rabbit | 1:50 |
| Akt | Cell Signaling Technology, #9272 | rabbit | 1:100 |
| Neurofilament, 70 KDa | Chemicon, #MAB1615 | mouse | 1:250 |
Progesterone treatment
Cells were treated with 100 nM of P4 (Sigma, St. Louis, MO) dissolved in DMSO for 40 min at 37°C before fixation and subsequent immunocytochemistry. DMSO was used as an equal volume vehicle control. The concentration of P4 was chosen based on previously described neuroprotective effects3,6.
Also, for the temporal administration pattern, it has been previously reported that 100nM progesterone led to maximal Akt phosphorylation in cerebral cortical explants between 15 and 30 min and sustained Akt phosphorylation for up to 2 hr following progesterone treatment16.
Inhibitor treatment
To evaluate the requirement of the PI3K/Akt pathway on the effects of P4, cells were preincubated with the Akt inhibitor X (4μM, Calbiochem, La Jolla, CA) or the PI-3 kinase inhibitor, LY294002 (15μM, Cell signaling Technology, Danvers, MA) for 30 min prior to the addition of P4. Similarly, the PR antagonist RU486 (1μM, SIGMA, St. Louis, MO) was administered for 30 min before P4 treatment to identify the contribution of the progesterone receptor (PR) to the observed activity.
Optical imaging of [Ca2+]i
After 11 DIV, mouse hippocampal cells were incubated with the Ca2+ indicator dye, 4μM Fluo-3 acetoxymethylester (Fluo-3-AM, Molecular Probes) in extracellular solution (ECS, in mM: NaCl, 137; KCl, 5; CaCl2 2; Na2HPO4 1; MgSO4 1; HEPES, 10; glucose, 22; pH 7.4) at 37°C for 30 min and then rinsed with ECS. Subsequently, we measured changes in fluorescence intensity of fluo-3 AM in loaded cells using time-lapse videomicroscopy (model IX70; Olympus, Japan; ORCA-ER, a high-resolution 12-bit digital B/W cooled CCD camera, Hamamatsu, Japan; Lambda DG-4 ultra high speed wavelength switcher; Sutter Instrument Co., Novato, CA; Simple PCI Imaging Software, Ver. 5.2; Compix Inc., Imaging systems/Hamamatsu Photonics Management Corp., Bridgewater, NJ). Only cells exhibiting a typical neuronal morphology (bipolar or pyramidal cell morphology) were selected for analysis. We performed two different sets of experiments: first, cells were treated acutely with P4 (100 nM) in ECS and, secondly, cells were pre-treated with 100 nM P4 for 15 min and then stimulated with the appropriate agonist. Fluorescence intensity of fluo-3 AM was recorded over time and cells were perfused with a gravity-driven perfusion system with ECS at a flow rate of 1ml/min. Ca2+ intensity was measured as the ratio of fluorescence intensity during the experiment over the of average baseline fluorescence intensity (F/F0).
In a separate set of experiments, cells were pretreated with 100 nM P4 for 15 min and then stimulated with membrane permeant IP3-AM (1μM; 2,5,6-Tri-O-Butyryl-myo-Inositol-1,3,4-trisphosphate-acetoxymethyl ester, AG Scientific, Inc., San Diego, CA) that was bath-applied to release Ca2+ from intracellular stores. One group of P4- and IP3-AM-treated cells was pretreated with 1 μM Xestospongin D (Calbiochem, San Diego, CA) to block IP3 receptors. Both nuclear and cytosolic Ca2+ signals were measured independently and amplitude, duration, slope and half-rise time (Tmax0.5) of individual Ca2+ transients were determined as kinetic parameters. Five or more independent experiments analyzing at least 10 cells each were performed to obtain data for each experimental condition and group.
Statistics
Results are presented as mean ± standard error of the mean (S.E.M) with the number of cells. Two sample t-tests with equal or unequal variance were applied to detect differences between groups. P values of 0.05 or lower were considered significant and indicated as such.
Results
Subcellular localization and distribution of IP3Rs and proteins involved in P4 signaling in primary cultures of mouse hippocampal neurons
To determine if there were any P4-induced changes in the expression and distribution of IP3R receptors and the neuroprotection-associated signaling protein, Akt, cells were treated cells with 100 nM P4 for 40 minutes and analyzed using immunocytochemistry. The cells were double-immunolabeled with specific antibodies for each signaling protein along with a neurofilament antibody as a neuronal marker, followed by nuclear counterstaining by DAPI. IP3R1, 2 and 3 (Figs. 1a-c, respectively), PR (Fig. 2), phospho-MAP kinase (phospho-ERK) (Fig. 3), Akt (total) (Fig. 4a), and phospho-Akt (Fig. 4b) were highly expressed in primary hippocampal neurons. In contrast, there was weak immunoreactivity for phospho-MAP kinase (ERK) in both P4 pretreated cells and vehicle treated cells (Fig. 3).
Figure 1.
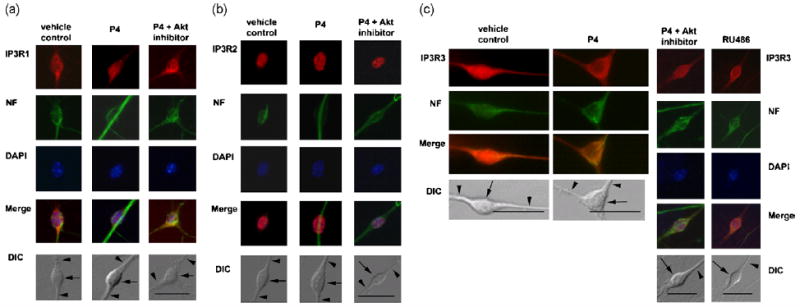
a, Differential distribution of IP3R type1 in response to P4 treatment in primary hippocampal neurons. Cells were pretreated with vehicle or P4 (100 nM) for 40 min. Cells were double-labeled with anti-IP3R1 antibodies (red), anti-neurofilament antibodies (green), and DAPI for nuclear staining (blue). Merged images of IP3R1, neurofilament and DAPI for vehicle-, P4-and inhibitor-pretreated cells are shown. Nomarski (DIC) images of primary hippocampal neurons for these treatment conditions are also shown.
b, Subcellular localization of IP3R2 in primary hippocampal neurons. IP3R2 immunoreactivity is detected exclusively in nucleus in vehicle-, P4- and both Akt inhibitor- and P4-pretreated cells (red). Cells were double-labeled with anti-IP3R2-specific antibodies (red), anti-neurofilament antibodies (green) and DAPI for nuclear staining (blue). Merged images of IP3R2, neurofilament and DAPI for vehicle-, P4- and both Akt inhibitor- and P4-pretreated cells are shown. Nomarski (DIC) images for are also shown.
c, Differential distribution and subcellular localization of IP3R type 3 in response to P4 treatment in primary hippocampal neurons. Cells were pretreated with vehicle (0.1% DMSO) or P4 (100 nM) for 40 min. Cells were double-labeled with anti-IP3R3-specific antibodies (red), anti-neurofilament-specific antibodies (green) and DAPI for nuclear staining (blue). Merged images of IP3R3 and neurofilament for vehicle-, P4- and both inhibitor- (Akt inhibitor or RU486) and P4-pretreated cells are shown.
Nomarski (DIC) images of primary hippocampal neurons for all treatment conditions are also shown; somata are indicated by arrows, some neurites by arrowheads in the DIC image of each set of panels.
Figure 2.
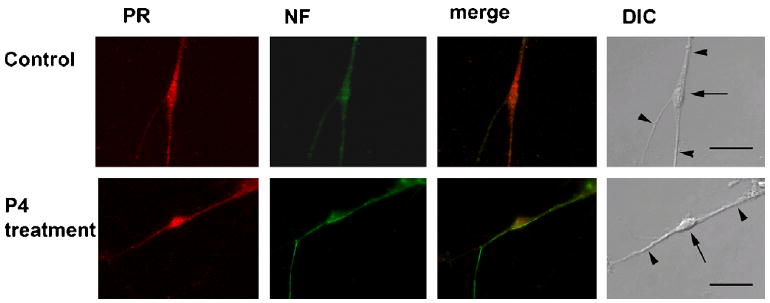
Differential distribution and subcellular localization of PR in response to P4 in primary hippocampal neurons. Cells were labeled with anti-PR antibodies (red) and anti-neurofilament (NF) antibodies (green). The merged image of PR and neurofilament for both vehicle- and P4-pretreated cells are shown. Nomarski (DIC) images of primary hippocampal neurons for both treatment conditions are also shown; somata are indicated by arrows, some neurites by arrowheads in the DIC image of each set of panels.
Figure 3.
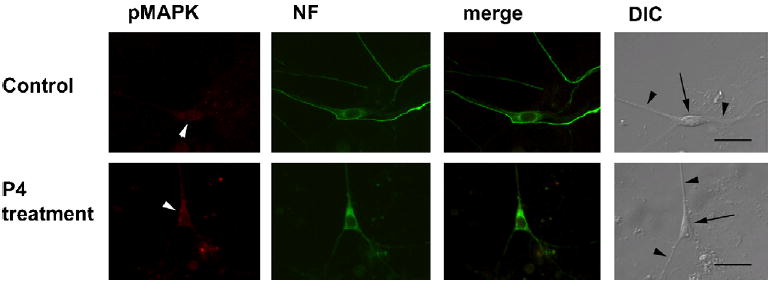
Subcellular localization of phospho-MAP kinase in primary hippocampal neurons. Cells were pretreated with vehicle (0.1% DMSO) or P4 (100 nM) for 40 min. Cells were double-labeled with anti-phospho-MAP kinase antibodies (red) and anti-neurofilament antibodies (green). The merged image of phospho-MAP kinase and neurofilament for both vehicle- and P4-pretreated cells is shown. Nomarski (DIC) images of primary hippocampal neurons for both treatment conditions are also shown; somata are indicated by arrows, some neurites by black arrowheads in the DIC image of each set of panels. Note that Phospho-MAP kinase immunorectivity is hardly detectable in either treatment condition (white arrowheads).
Figure 4.
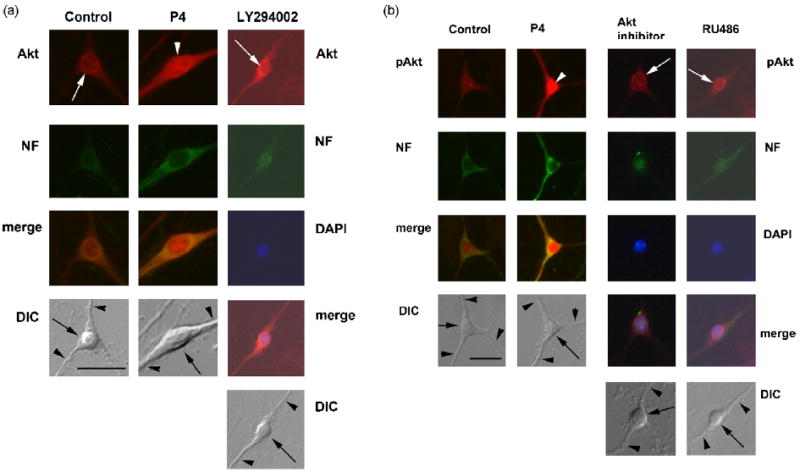
a, Differential distribution and subcellular localization of Akt in response to P4 in primary hippocampal neurons. Akt labeling is shown in perinuclear region in vehicle- and PI3-Kinase inhibitor (LY294002)-pretreated cells (white arrows), but diffuse in the soma of P4- and Akt inhibitor-pretreated cells (white arrowheads). Cells were double-labeled by anti-Akt antibodies (red) and anti-neurofilament antibodies (green). Merged images of Akt and neurofilament for vehicle-, P4-, Akt inhibitor- and PI3-Kinase inhibitor (LY294002)-pretreated cells are shown. Nomarski (DIC) images of primary hippocampal neurons for all treatment conditions are also shown.
b, Differential distribution and subcellular localization of phopho-Akt in response to P4 in primary hippocampal neurons. Phospho-Akt is translocated to the nucleus in response to P4 (white arrowheads). Cells were double-labeled with anti-phospho-Akt antibodies (red) and anti-neurofilament antibodies (green). Merged images of phospho-Akt and neurofilament for vehicle-, P4-, Akt inhibitor- and the PR antagonist (RU486)-pretreated cells are shown. The latter two treatments inhibited nuclear translocation of phospho-Akt within immunoreactivity in the perinuclear region (white arrows). Nomarski (DIC) images of primary hippocampal neurons for all treatment conditions are also shown; somata are indicated by arrows, some neurites by black arrowheads in the DIC image of each set of panels.
With respect to the influences of P4 on the subcellular distribution of these proteins, we found that IP3R type 1 labeling, while perinuclear in control-treated cells, appeared as a diffuse stain in the nucleus and cytosol of P4 pretreated cells (Fig. 1a). Pretreatment of neurons with the Akt inhibitor, Akt inhibitor X, reversed the P4-mediated alteration in IP3R1 immunoreactivity (Fig. 1a). IP3R type 2 was found exclusively in nucleus of both control and P4 treated cells (Fig. 1b). Inhibition of Akt did not affect IP3R2 distribution (Fig. 1b). However, immunoreactivity of IP3R type 3 was detected in a diffuse pattern throughout the soma (cytosolic and nuclear regions) of control treated cells, but mainly in perinuclear cytosolic region in P4 treated neurons (Fig. 1c). As with IP3R1, inhibition of Akt reversed the P4-mediated alteration in IP3R3 immunoreactivity (Fig. 1c). Interestingly, the PR antagonist, RU486, led to IP3R3 immunolabeling in the cytosolic regions of the soma with little nuclear labeling (Fig. 1c).
In order to identify if P4 also causes differential changes in the subcellular localization of the PR, immunolabeling of primary hippocampal neurons using a specific PR antibody revealed that the PR was expressed in both the soma and neurites of hippocampal neurons as verified by colocalization of immunoreactivity for PR and neurofilament (Fig. 2), with higher fluorescence intensity in the soma of P4-pretreated cells compared with vehicle controls (Fig 5a).
Figure 5.
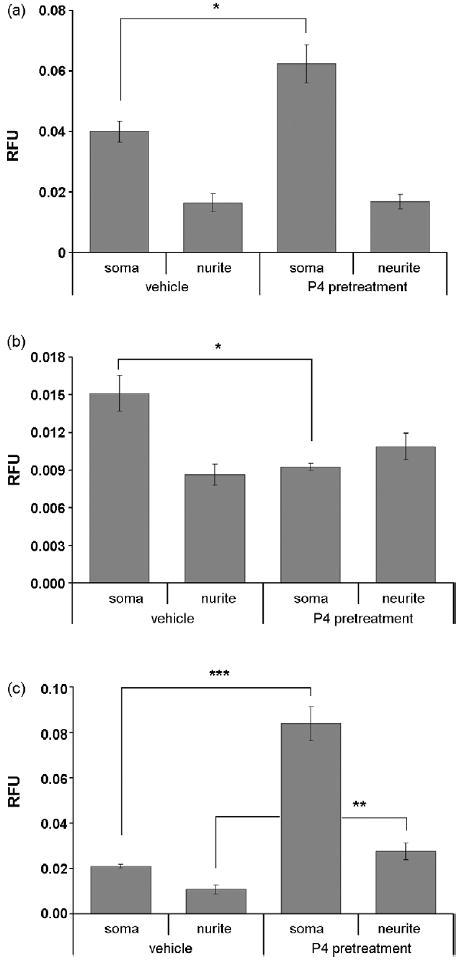
Semiquantitative analysis of immunofluorescence intensity of PR, pMAPK, and pAkt in the soma and neurites in response to P4. (a), Relative fluorescence intensity for PR is significantly increased by 51.6% in soma in cells pretreated with P4 when compared with vehicle control-treated cells (n=10, P<0.05 [indicated by “*”, two-sample t-test with unequal variances was applied], values are mean ± SEM). (b), On the contrary, relative fluorescence intensity for pMAPK is significantly decreased by 40 % in the soma of P4-pretreated cells when compared with vehicle-treated cells (n=10, P<0.05 [indicated by “*”, two-sample t-test with unequal variances was applied], values are mean ± SEM). (c), Relative fluorescence intensity for pAKT is significantly increased both in soma (by 74.69%, n=10, P<0.001 [indicated by “***”, two-sample t-test with unequal variances was applied], values are mean ± SEM) and neurites (by 62.96%, n=10, P<0.01 [indicated by “**”, two-sample t-test with equal variances was applied], values are mean ± SEM) in P4 pretreated cells.
Immunoreactivity for the active form of ERK, phospho-ERK (pERK) was weak in primary hippocampal neurons (Fig. 3). Furthermore, no increase in immunoreactivity for ERK and pERK was elicited by P4 pretreatment (Fig. 3, Fig. 5b). There was, however, a significant decrease in pERK in the soma of P4 treated cells compared to controls (Fig 5b).
Akt was differentially distributed throughout the soma and neurites of neurons with the highest immunoreactivity found in the perinuclear region (Fig. 4a). After P4 treatment, Akt immunoreactivity was more evenly distributed throughout the cells with significant immunoreactivity in the nucleus. Inhibition of PI3K with LY294002 blocked the translocation of Akt to the nucleus (Fig. 4a). pAkt, was evenly distributed at low levels throughout the nucleus, soma and neurites (Fig. 4b). After P4 treatment, pAkt immunoreactivity was significantly increased particularly in the nucleus (Fig. 4b). Inhibition of Akt (with the Akt inhibitor X) and PR (with RU486) blocked the increase in nuclear pAkt immunoreactivity (Fig. 4b, Fig. 6). Overall, pAKT was significantly increased in both the nuclear region of the soma and the neurites of P4 treated cells compared to controls (Fig. 5c, Fig. 6)
Figure 6.
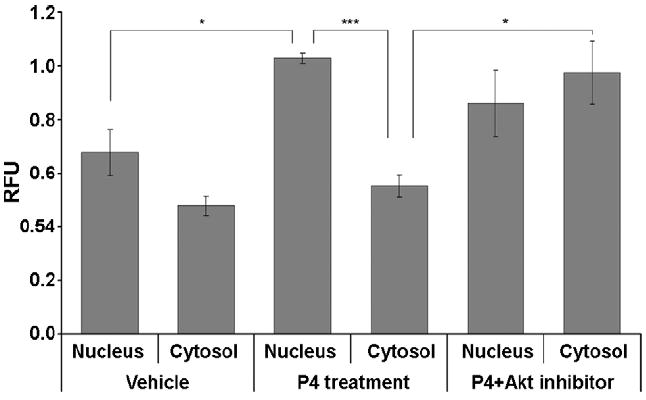
Semiquantitative analysis of relative fluorescence intensity for phospho-Akt in the nucleus and cytosol in response to P4. Relative fluorescence intensity is significantly increased by 34.4 % in the nucleus in P4-pretreated cells when compared with vehicle controls (n=10, P<0.05 [indicated by “*”, two-sample t-test with equal variances was applied], values are mean ± SEM). In P4-pretreated cells, fluorescence intensity in the nucleus is 46.2 % higher than in cytosol (n=10, P<0.001 [indicated by “***”, two-sample t-test with unequal variances was applied], values are mean ± SEM). On the contrary, relative fluorescence intensity is significantly increased by 56.7 % in cytosol in both P4- and Akt inhibitor-pretreated cells compared with P4-pretreated cells (n=7, P<0.05 [indicated by “*”, two-sample t-test with unequal variances was applied], values are mean ± SEM).
P4-induced Ca2+ transients
In order to determine changes in Ca2+ responses of cultured mouse hippocampal neurons in response to P4, we used optical imaging of [Ca2+]i. After culturing the primary neurons for 11 DIV, cells were incubated with the Ca2+ indicator dye Fluo3-acetoxymethylester (Fluo3-AM; 4μM) in extracellular solution (ECS) and changes in Fluo-3 fluorescence intensity were measured using time-lapse videomicroscopy.
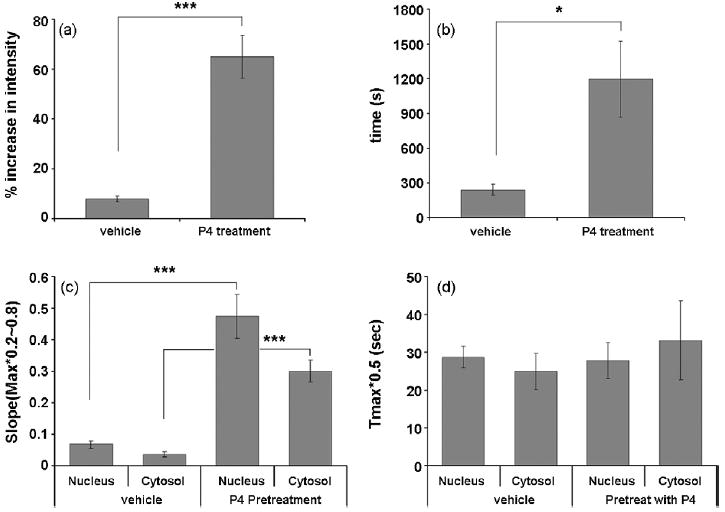
Representative Ca2+ responses are shown for the vehicle control-treated and P4-treated cells (Fig. 7a, b, respectively). We observed that both amplitude and duration of fluorescence intensity were significantly increased (Fig. 7c) (d, approximately 120% higher amplitude and e, 1400 sec longer duration, Fig. 7c, d and e; n=10, p<0.01 and p<0.001, respectively; values are mean ± SEM) in response to acutely applied P4 as compared to controls. Furthermore, acute P4 application resulted in a significant increase in the slope of both cytosolic and nuclear Ca2+ responses compared to vehicle controls (supplemental Fig. 1a). The time to half-maximal Ca2+ rise (Tmax0.5) was also greater for P4-treated cells compared to vehicle controls, but the observed increases failed to reach statistical significance (supplemental Fig. 1b).
Figure 7.
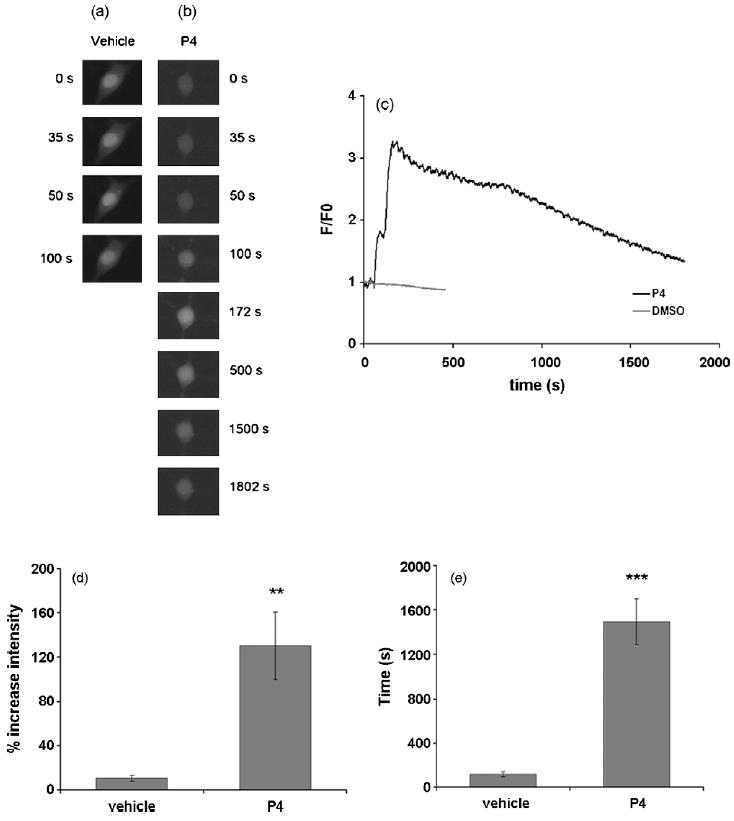
P4 enhances the intracellular Ca2+ concentration [Ca2+]i in cultured hippocampal neurons in response to acute application of P4. Cells were acutely-treated with 100 nM P4. The fluorescence intensity in the cells loaded with the Ca2+-sensitive dye fluo-3-AM was normalized as fluorescence intensity over initial fluorescence intensity (F/F0) to measure relative changes in [Ca2+]i over time. Acute treatment of P4 results in an increase in [Ca2+]i in hippocampal neurons. (a) Montage of a representative Ca2+ imaging experiment visualizing [Ca2+]i at 0s, 35s (application of P4), 50s (maximal intensity) and 100s (the time at which the Ca2+ concentration went back to baseline). (b) Montage of a representative imaging experiment visualizing the cytosolic Ca2+ concentration at 0s, 50s (application of P4), 172s (maximal intensity) and 1802s (the time at which the Ca2+ concentration returned to baseline) in response to acute application of P4. (c) Representative Ca2+ traces of both control and P4 treated cell. (d, e) The amplitude and duration of the Ca2+ are shown, respectively. Both amplitude and duration of Ca2+ responses were significantly increased in response to P4 (120 % higher, n=10, P<0.01 / 1376 sec longer, n=10, P<0.001; indicated by “**” and “***”, respectively two-sample t-tests with unequal variances were applied], values are mean ± SEM).
Potentiation of IP3-induced Ca2+ responses by P4 pretreatment
To determine whether changes in the Ca2+ responses of P4-pretreated cultured mouse hippocampal neurons is directly controlled by IP3Rs, cells were stimulated with IP3-AM, a cell membrane-permeant agonist of IP3Rs (Fig. 8). Both amplitude (e) and duration (f) of Ca2+ signals elicited by IP3 were significantly increased after treatment of cells with P4 when compared to controls (Fig. 8e, f; for Fig. 8e, n=10, p<0.001, with approximately 71% higher amplitude; for Fig. 8f, n=10, p<0.01, with 941sec longer duration). The addition of the Akt inhibitor, Akt inhibitor X , reversed the P4-mediated increase in amplitude and duration of Ca2+ responses (Fig 8e,f).
Figure 8.
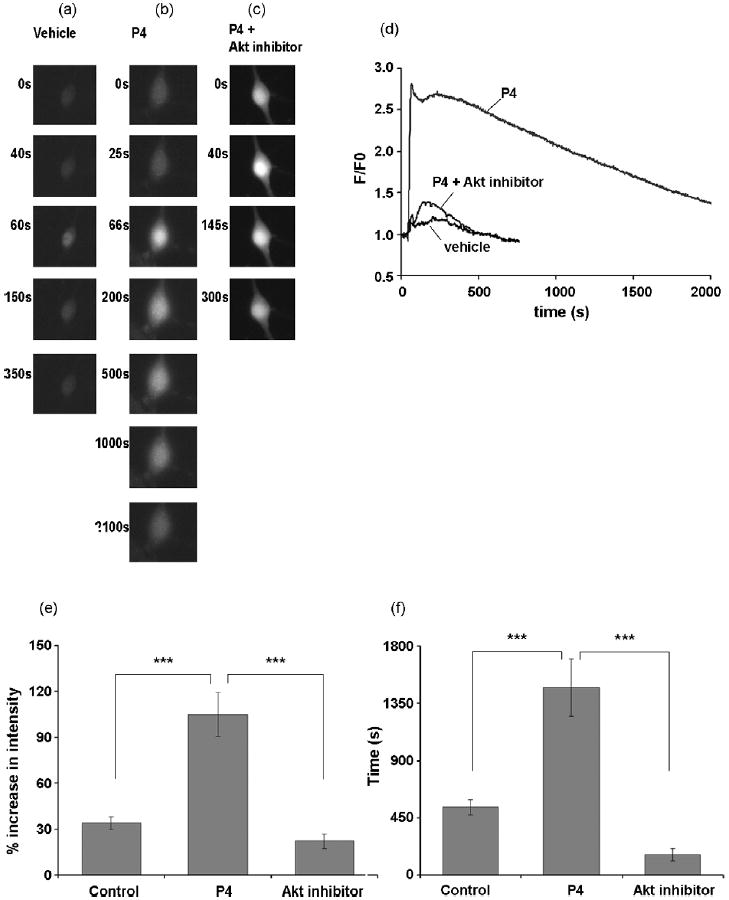
IP3- mediated Ca2+ response in P4 pretreated hippocampal neurons. Cells were pretreated with 100 nM P4 for 15 min. (a) Montage of a representative imaging experiment visualizing the cytosolic Ca2+ concentration at 0s, 40s (application of IP3AM), 60s (maximal intensity) and 350s (the time at which the Ca2+ concentration returned to baseline). (b) Montage of a representative imaging experiment visualizing the cytosolic Ca2+ concentration at 0s, 25s (application of IP3AM), 66s (maximal intensity) and 2100s (the time at which the Ca2+ concentration returned to baseline) in P4 pretreated cells. (c) Montage of a representative imaging experiment visualizing the cytosolic Ca2+ concentration at 0s, 40s (application of IP3AM), 145s (maximal intensity) and 500s (the time at which the Ca2+ concentration returned to baseline) in P4- and Akt inhibitor-pretreated cells. Both the amplitude and duration of Ca2+ transients were significantly increased as shown in response to P4 when compared with vehicle controls (e and f, respectively; n=10, P<0.001, indicated by “***”, two-sample t-tests with unequal variances were applied; values are mean ± SEM).
In separate control experiments, cells were treated with 1μM Xestospongin D to block IP3Rs after pre-treatment with P4 in order to verify whether the IP3-mediated Ca2+ responses are dependent on the direct activation of IP3Rs (Fig. 9). Approximately 82% of cells (41 out of 50) did not respond to IP3AM after treating with Xestospongin D treatment. The IP3-mediated Ca2+ response was also analyzed in DMSO pre-treated vehicle controls versus P4 pre-treated cells and in blocking controls using either vehicle or IP3-AM (Fig. 9c,d). In both cases, the DMSO vehicle control had no significant effect on the amplitude or duration of the IP3-AM-mediated Ca2+ responses compared to P4-pretreated cells. The slope of the Ca2+ response was calculated using data from 20% of Tmax to 80% of Tmax using liner regression and was significantly increased in the nucleus as compared to the cytosol in response to P4 (supplemental Fig. 1c). P4 treatment had no significant effect on the Tmax0.5 of the Ca2+ responses (supplemental Fig. 1d).
Figure 9.
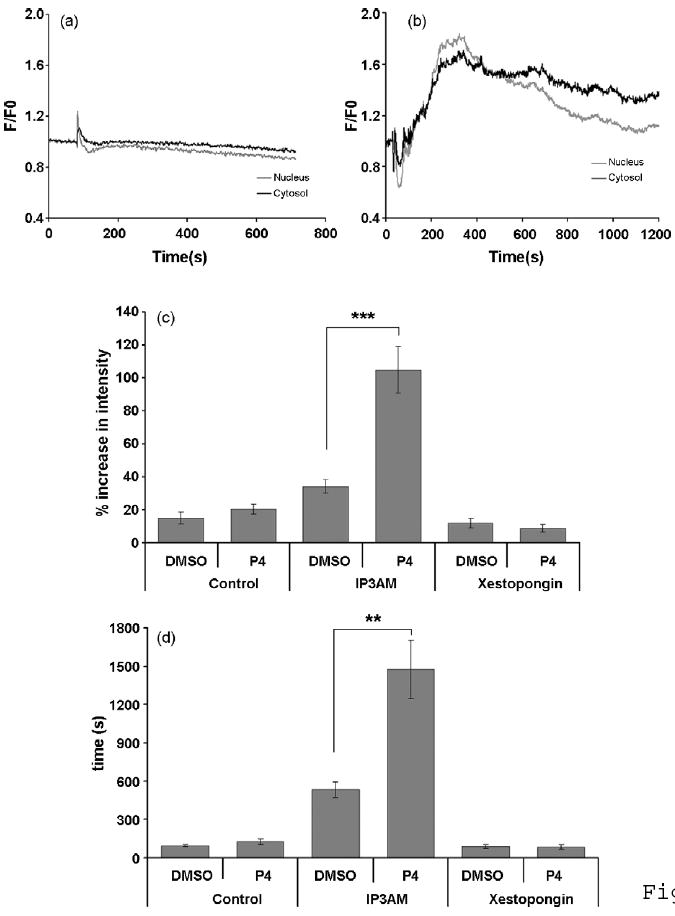
Nuclear and cytosolic Ca2+ responses in hippocampal neurons pretreated P4 and stimulated with IP3-AM (1μM). Representative Ca2+ traces of both vehicle- and P4-pretreated cells are shown in Fig. 9a,b, respectively. An increase of fluorescence intensity in the nucleus precedes the increase in the cytosol (Fig. 9b). Both slope and Tmax0.5 of IP3–mediated Ca2+ signals were calculated for the nuclear and cytosolic regions (nucleus traces in gray; cytosol traces in black). The slope of nuclear and cytosolic responses are increased by 86.04% (P<0.001) and 76% (P<0.01), indicated by “***” and “**”, respectively (two-sample t-tests with unequal variances were applied), values are mean ± SEM).), in P4-pretreated cells when compared with vehicle-treated cells (c, n=10, Values are mean ± SEM). Moreover, the Tmax0.5 of nuclear and cytosolic responses are increased by 75.82 % (P<0.05) and 71.63 % (P<0.05), respectively (two-sample t-tests with unequal variances were applied), in P4-pretreated cells as compared to vehicle-treated cells (d, n=10, Values are mean ± SEM). In addition, nuclear Ca2+ responses mediated by IP3-AM are faster than cytosolic responses to P4 as shown in c (the slope of nuclear response was 41.86 % steeper compared with cytosolic responses; n=10, P<0.05; two-sample t-tests with unequal variances were applied).
Potentiation of depolarization-induced Ca2+ responses by P4 pretreatment in hippocampal neurons
Ca2+ can enter the cytosol from the extracellular space via numerous channels such as voltage-dependent Ca2+ channels that are activated during membrane depolarization. The resulting Ca2+ transient can release Ca2+ from intracellular stores by a mechanism known as Ca2+-induced Ca2+ release (CICR). It was hypothesized that P4 activates IP3Rs, which in turn result in the release of more Ca2+ via CICR in response to a depolarization.
To identify whether the depolarization-elicited Ca2+ response is enhanced by P4, primary hippocampal neurons were pretreated with 100 nM P4 for 15 min followed by stimulation with 50 mM KCl for 30 sec. Application of 50 mM KCl caused a rapid increase in intracellular Ca2+ concentration in cells pretreated with P4 (Fig. 10). The amplitude of depolarization-induced Ca2+ transients was increased significantly by approximately 57% and the duration was extended significantly by approximately 956 seconds in P4-treated cells relative to controls (Fig. 10a,b, respectively). The slope of both the nuclear and cytosolic Ca2+ responses was significantly higher in P4-pretreated cells compared to vehicle controls, but there was no significant difference in Tmax0.5 between treatment groups (Fig. 10 c,d).
Figure 10.
The effect of P4 on chemically-induced depolarization. (a,b) The amplitude and duration of depolarization-induced Ca2+ responses, respectively. Both the amplitude and duration of the responses are significantly increased in response to P4-treatment compared to vehicle-treated cells (the amplitude is 57.09 % higher, n=10, P<0.001; the duration of the Ca2+ signal is 955.75 sec longer, n=10, P<0.05; values are mean ± SEM; indicated by “***” and “*”, respectively; two-sample t-tests with unequal variances were applied). (c,d) The slope and duration of depolarization-induced Ca2+ responses, respectively. (c), The slope of both cytosolic and nuclear Ca2+ responses are significant greater for P4-pretreated cells compared to vehicle controls (P<0.001; values are mean ± SEM; indicated by “***”; two-sample t-tests with unequal variances were applied). (d), there is no difference in the Tmax0.5 of Ca2+ responses between treatment groups.
IP3-induced Ca2+ responses in the nucleus have faster kinetics than cytosolic Ca2+ transients after P4 pre-treatment
The differential distribution of the biophysically distinct IP3R isotypes in the nucleus and cytosol (Fig. 1) suggests that IP3-mediated Ca2+ signals are potentially differentially regulated in the nucleus compared to the cytosol. To test this hypothesis, Ca2+ imaging experiments were performed in the presence of IP3-AM. Subsequently, IP3-mediated Ca2+ responses in the nucleus and cytosol were measured individually and normalized to the same baseline and peak amplitude value to determine Ca2+ responses under the vehicle and P4 pretreatment conditions (Fig. 9a,b, respectively). Slope and half-maximal rise time (Tmax0.5) were calculated in the nucleus and cytosol to identify differences in the Ca2+ response kinetics (supplemental Fig. 1). Slope and T max0.5 were significantly increased in both the nucleus and cytosol of the P4-pretreated cells when compared with control cells (supplemental Fig. 1. n=10, P<0.001. Values are mean ± SEM). In addition, supplemental Fig. 1 shows that the slope of nuclear IP3-mediated Ca2+ transients was significantly increased compared to cytosolic transients after P4 pretreatment.
Nuclear Ca2+ responses mediated by IP3-AM have faster kinetics than those of the cytoplasm in response to P4 as shown in supplemental Fig. 1 (n=10; P<0.05; values are mean ± SEM).
Discussion
Calcium (Ca2+) is an essential second messenger that mediates multiple cellular responses in neurons to various stimuli including cell proliferation, neurotransmission, and cell death10,15. Tight control of spatial and temporal Ca2+ signaling enables neurons to perform these different tasks appropriately. P4 is involved in multiple processes in neurons including neuroprotection4-8. There is increasing evidence from non-neuronal cell models suggesting that P4 is implicated in intracellular Ca2+ signaling14,18. Further, P4 potentiates the glutamate-induced rise in [Ca2+]i in hippocampal neurons4. However, little is known about the mechanism underlying the phenomenon in neurons. Based on the fact that IP3Rs mediate a variety of cellular Ca2+ signaling events in neurons, it was proposed that IP3Rs play a central role in P4-elicited Ca2+ signaling. In order to investigate the hypothesis, optical imaging of intracellular Ca2+ concentrations in cultured primary hippocampal neurons was performed. The present study determined that each IP3 receptor isotype was expressed in primary hippocampal neurons, each with distinct subcellular localization. Immunoreactivity for IP3R type 1 was present mainly in the perinuclear region and diffusely distributed in the soma. Immunoreactivity for IP3R type 3 was localized similarly in soma but underwent translocation to the perinuclear region in response to P4 treatment. IP3R type 2 immunoreactivity was confined to the nucleus and was not altered by P4 treatment, similar to type 1 IP3R. Such differential distribution of IP3Rs has been previously reported in other cells19-21.
Multiple kinases including Akt and MAP kinase (ERK) phosphorylate IP3Rs leading to changes in activity of the channel17,22,23. Interestingly, P4 enhances the phosphorylation of Akt in mouse cerebral cortical explants, which causes activation of Akt16. Akt phosphorylates IP3R in Chinese hamster ovary T-cells leading to changes in channel activity17. Such posttranslational modifications potentially increase the release of Ca2+ from intracellular stores. Elevated intracellular IP3-generated Ca2+ transients have the potential to induce gene expression for cell survival and neuroprotection acting through Ca2+ response elements24.
Besides the genomic action of P4, recent studies indicate that P4 exerts rapid stimulatory effects by so called non-genomic pathways25. These non-genomic pathways are associated with intracellular signaling pathways involving intracellular cAMP and protein kinase A (PKA) levels, suggesting an action of P4 on this intracellular signaling cascade26 similar to other steroid hormones27 and steroid hormone signaling pathways28-31.
P4 also generates Ca2+ transients by itself in primary hippocampal neurons with a significantly high amplitude and long duration (Fig. 7). Most Ca2+ transients reach a peak within 5 min after acute P4 application. From this result, we predicted that P4 activates IP3R through a rapid and direct membrane-associated effect rather than a nuclear mode of action.
The present study measured the subcellular distribution of phospho-Akt immunoreactivity, which was altered in cultured hippocampal neurons exposed to P4. Phospho-Akt was predominantly translocated to the nucleus in response to P4. These findings raise the possibility that P4 influences IP3R function through Akt, which, in turn, induces the phosphorylation of IP3Rs resulting in enhanced Ca2+ release through the channel.
As previous studies have shown, signaling components for IP3-mediated Ca2+ response are found not only in the cytosol, but also in the nuclear membrane. The nuclear membrane contains phosphatidylinositol 4,5 bisphosphate (PIP2), the precursor of IP3, phospholipase C, diacylglycerol and IP3Rs19. Additionally, we showed that IP3R type 2 appeared exclusively in the nucleus (Fig. 1b). This finding reflects higher sensitivity of nuclear Ca2+ stores for IP3. Therefore, these results suggest that P4 activates IP3R type 2 that is exclusively present in nucleus or P4 stimulates phosphorylation of Akt that is in turn translocated to the nucleus, leading to enhancing channel activity of IP3R type 2. To determine this hypothesis, further studies using Akt inhibitors need to be conducted to find out Akt involvement on the IP3R-mediated Ca2+ signal and nuclear fractionation to quantify the translocation of phospho-Akt in nucleus was needed.
In conclusion, the present study provides evidence for the involvement of IP3Rs as important targets and mediators of the P4-elicited changes in intracellular Ca2+ concentration in primary hippocampal neurons. P4 also alters the localization of IP3R type 1 and 3 in primary hippocampal neurons, and likely reflects the observation that P4-induced IP3-mediated Ca2+ signaling occurred in a distinct spatial and temporal pattern, providing integration of hormonal and Ca2+ signaling in neurons.
Supplementary Material
References
- 1.Tsai MJ, O’Malley BW. Molecular mechanisms of action of steroid/thyroid receptor superfamily members. Annu Rev Biochem. 1994;63:451–486. doi: 10.1146/annurev.bi.63.070194.002315. [DOI] [PubMed] [Google Scholar]
- 2.Baulieu EE. Steroid hormones in the brain: Several Mechanisms. In: Fuxe K, Gustafsson JA, Wetterberg L, editors. Steroid Hormone Regulation of the Brain. Pergamon Press; Oxford: 1981. pp. 3–14. [Google Scholar]
- 3.Goodman Y, Bruce AJ, Cheng B, Mattson MP. Estrogens attenuate and corticosterone exacerbates excitotoxicity, oxidative injury, and amyloid beta-peptide toxicity in hippocampal neurons. J Neurochem. 1996;66(5):1836–44. doi: 10.1046/j.1471-4159.1996.66051836.x. [DOI] [PubMed] [Google Scholar]
- 4.Nilsen J, Brinton RD. Impact of progestins on estrogen-induced neuroprotection: synergy by progesterone and 19-norprogesterone and antagonism by medroxyprogesterone acetate. Endocrinology. 2002;143(1):205–12. doi: 10.1210/endo.143.1.8582. [DOI] [PubMed] [Google Scholar]
- 5.Nilsen J, Brinton RD. Divergent impact of progesterone and medroxyprogesterone acetate (Provera) on nuclear mitogen-activated protein kinase signaling. Proc Natl Acad Sci U S A. 2003;100:10506–10511. doi: 10.1073/pnas.1334098100. [DOI] [PMC free article] [PubMed] [Google Scholar]
- 6.Kaur P, Jodhka PK, Underwood WA, Bowles CA, de Fiebre NC, de Fiebre CM, Singh M. Progesterone increases brain-derived neuroptrophic factor expression and protects against glutamate toxicity in a mitogen-activated protein kinase- and phosphoinositide-3 kinase-dependent manner in cerebral cortical explants. J Neurosci Res. 2007;85(11):2441–9. doi: 10.1002/jnr.21370. [DOI] [PMC free article] [PubMed] [Google Scholar]
- 7.Asbury ET, Fritts ME, Horton JE, Isaac WL. Progesterone facilitates the acquisition of avoidance learning and protects against subcortical neuronal death following prefrontal cortex ablation in the rat. Behav Brain Res. 1998;97(1-2):99–106. doi: 10.1016/s0166-4328(98)00031-x. [DOI] [PubMed] [Google Scholar]
- 8.Roof RL, Duvdevani R, Braswell L, Stein DG. Progesterone facilitates cognitive recovery and reduces secondary neuronal loss caused by cortical contusion injury in male rats. Exp Neurol. 1994;129(1):64–9. doi: 10.1006/exnr.1994.1147. [DOI] [PubMed] [Google Scholar]
- 9.Berridge MJ. Inositol trisphosphate and calcium signalling. Nature. 1993;361:315–325. doi: 10.1038/361315a0. [DOI] [PubMed] [Google Scholar]
- 10.Berridge MJ, Bootman MD, Roderick HL. Calcium signalling: dynamics, homeostasis and remodelling. Nat Rev Mol Cell Biol. 2003;4:517–529. doi: 10.1038/nrm1155. [DOI] [PubMed] [Google Scholar]
- 11.Missiaen L, Robberecht W, van den Bosch L, Callewaert G, Parys JB, Wuytack F, Raeymaekers L, Nilius B, Eggermont J, De Smedt H. Abnormal intracellular ca(2+)homeostasis and disease. Cell Calcium. 2000;28(1):1–21. doi: 10.1054/ceca.2000.0131. [DOI] [PubMed] [Google Scholar]
- 12.Wehrens XH, Lehnart SE, Marks AR. Intracellular calcium release and cardiac disease. Annu Rev Physiol. 2005;67:69–98. doi: 10.1146/annurev.physiol.67.040403.114521. [DOI] [PubMed] [Google Scholar]
- 13.Pin JP, Acher F. The metabotropic glutamate receptors: structure, activation mechanism and pharmacology. Curr Drug Targets CNS Neurol Disord. 2002;1(3):297–317. doi: 10.2174/1568007023339328. [DOI] [PubMed] [Google Scholar]
- 14.Wasserman WJ, Pinto LH, O’Connor CM, Smith LD. Progesterone induces a rapid increase in [Ca2+]in of Xenopus laevis oocytes. Proc Natl Acad Sci U S A. 1980;77:1534–1536. doi: 10.1073/pnas.77.3.1534. [DOI] [PMC free article] [PubMed] [Google Scholar]
- 15.Berridge MJ, Lipp P, Bootman MD. The versatility and universality of calcium signalling. Nat Rev Mol Cell Biol. 2000;1:11–21. doi: 10.1038/35036035. [DOI] [PubMed] [Google Scholar]
- 16.Singh M. Ovarian hormones elicit phosphorylation of Akt and extracellular-signal regulated kinase in explants of the cerebral cortex. Endocrine. 2001;14:407–415. doi: 10.1385/ENDO:14:3:407. [DOI] [PubMed] [Google Scholar]
- 17.Khan MT, Wagner L, 2nd, Yule DI, Bhanumathy C, Joseph SK. Akt kinase phosphorylation of inositol 1,4,5-trisphosphate receptors. J Biol Chem. 2006;281:3731–3737. doi: 10.1074/jbc.M509262200. [DOI] [PubMed] [Google Scholar]
- 18.Kirkman-Brown JC, Bray C, Stewart PM, Barratt CL, Publicover SJ. Biphasic elevation of [Ca(2+)](i) in individual human spermatozoa exposed to progesterone. Dev Biol. 2000;222:326–335. doi: 10.1006/dbio.2000.9729. [DOI] [PubMed] [Google Scholar]
- 19.Leite MF, Thrower EC, Echevarria W, Koulen P, Hirata K, Bennett AM, Ehrlich BE, Nathanson MH. Nuclear and cytosolic calcium are regulated independently. Proc Natl Acad Sci U S A. 2003;100:2975–2980. doi: 10.1073/pnas.0536590100. [DOI] [PMC free article] [PubMed] [Google Scholar]
- 20.Koulen P, Wei J, Madry C, Liu J, Nixon E. Differentially distributed IP3 receptors and Ca2+ signaling in rod bipolar cells. Invest Ophthalmol Vis Sci. 2005;46(1):292–8. doi: 10.1167/iovs.04-0939. [DOI] [PubMed] [Google Scholar]
- 21.Duncan RS, Hwang SY, Koulen P. Differential inositol 1,4,5-trisphosphate receptor signaling in a neuronal cell line. Int J Biochem Cell Biol. 2007;39(10):1852–1862. doi: 10.1016/j.biocel.2007.05.003. [DOI] [PubMed] [Google Scholar]
- 22.Wojcikiewicz RJ, Luo SG. Phosphorylation of inositol 1,4,5-trisphosphate receptors by cAMP-dependent protein kinase. Type I, II, and III receptors are differentially susceptible to phosphorylation and are phosphorylated in intact cells. J Biol Chem. 1998;273(10):5670–7. doi: 10.1074/jbc.273.10.5670. [DOI] [PubMed] [Google Scholar]
- 23.Bai GR, Yang LH, Huang XY, Sun FZ. Inositol 1,4,5-trisphosphate receptor type 1 phosphorylation and regulation by extracellular signal-regulated kinase. Biochem Biophys Res Commun. 2006;348(4):1319–27. doi: 10.1016/j.bbrc.2006.07.208. Epub 2006 Aug 11. [DOI] [PubMed] [Google Scholar]
- 24.Gomes DA, Leite MF, Bennett AM, Nathanson MH. Calcium signaling in the nucleus. Can J Physiol Pharmacol. 2006;84(3-4):325–32. doi: 10.1139/y05-117. [DOI] [PubMed] [Google Scholar]
- 25.Edwards DP. Regulation of signal transduction pathways by estrogen and progesterone. Annu Rev Physiol. 2005;67:335–376. doi: 10.1146/annurev.physiol.67.040403.120151. [DOI] [PubMed] [Google Scholar]
- 26.Sadler SE, Maller JL. Inhibition of Xenopus oocyte adenylate cyclase by progesterone: a novel mechanism of action. Adv Cyclic Nucleotide Protein Phosphorylation Res. 1985;19:179–194. [PubMed] [Google Scholar]
- 27.Honda K, Sawada H, Kihara T, Urushitani M, Nakamizo T, Akaike A, Shimohama S. Phosphatidylinositol 3-kinase mediates neuroprotection by estrogen in cultured cortical neurons. J Neurosci Res. 2000;60:321–327. doi: 10.1002/(SICI)1097-4547(20000501)60:3<321::AID-JNR6>3.0.CO;2-T. [DOI] [PubMed] [Google Scholar]
- 28.Bagowski CP, Myers JW, Ferrell JE., Jr The classical progesterone receptor associates with p42 MAPK and is involved in phosphatidylinositol 3-kinase signaling in Xenopus oocytes. J Biol Chem. 2001;276:37708–37714. doi: 10.1074/jbc.M104582200. [DOI] [PubMed] [Google Scholar]
- 29.Thomas P, Zhu Y, Pace M. Progestin membrane receptors involved in the meiotic maturation of teleost oocytes: a review with some new findings. Steroids. 2002;67:511–517. doi: 10.1016/s0039-128x(01)00180-5. [DOI] [PubMed] [Google Scholar]
- 30.Zhu Y, Bond J, Thomas P. Identification, classification, and partial characterization of genes in humans and other vertebrates homologous to a fish membrane progestin receptor. Proc Natl Acad Sci U S A. 2003;100:2237–2242. doi: 10.1073/pnas.0436133100. [DOI] [PMC free article] [PubMed] [Google Scholar]
- 31.Peluso JJ, Pappalardo A. Progesterone mediates its anti-mitogenic and anti-apoptotic actions in rat granulosa cells through a progesterone-binding protein with gamma aminobutyric acidA receptor-like features. Biol Reprod. 1998;58:1131–1137. doi: 10.1095/biolreprod58.5.1131. [DOI] [PubMed] [Google Scholar]
- 32.Stokely ME, Bhat MA, Koulen P. Microfluorimetry defines early axonal damage in a rat model of optic neuritis: A novel method targeting early CNS autoimmunity. J Neurosci Meth. 2007;166(2):217–28. doi: 10.1016/j.jneumeth.2007.07.010. Epub 2007 Jul 24. [DOI] [PubMed] [Google Scholar]
Associated Data
This section collects any data citations, data availability statements, or supplementary materials included in this article.