

Abstract
Warfarin is a widely prescribed drug that is difficult to use because of its narrow therapeutic window. Genetic polymorphisms associated with warfarin metabolism have been identified, but the clinical utility of genetic testing in warfarin dosing has not been established. External validation of published algorithms is critical to determine the best prediction for warfarin dosing in prospective trials. We used two independent datasets totaling 1095 patients to evaluate four published algorithms and a simple prediction algorithm developed in this study based on the CYP2C9*2, CYP2C9*3, and VKORC1 −1639 polymorphisms in 150 patients taking warfarin. Predicted warfarin doses were calculated and compared for accuracy with actual maintenance doses. All evaluated pharmacogenetics-based dosing algorithms performed similarly for both datasets. The proportion of variation explained (R2) was high (60% to 65%) in the small white-only Connecticut dataset but low (36% to 46%) in the large dataset on a diverse ethnic population from the International Warfarin Pharmacogenetics Consortium (IWPC). When comparing the percentage of patients whose predicted dosage are within 20% of actual, the IWPC algorithm performed the best overall (45.9%) for the two datasets combined while other algorithms performed nearly as well. Because no algorithm could be considered the best for all dosing ranges, it may be important to consider the nature of a local service population in choosing the most appropriate pharmacogenetics-based dosing algorithm.
Pharmacogenetics is a new and rapidly evolving discipline that addresses how genetic polymorphisms affect an individual's response to pharmacological agents. Also known as “personalized” medicine, pharmacogenetic testing is still not routinely used in clinical practice. One important direction in pharmacogenetics, warfarin therapy, has gained significant attention.
Warfarin, a widely prescribed medication used by millions of Americans, is used to prevent venous and arterial thrombosis for patients with a variety of conditions. Unfortunately, the appropriate dose required is highly variable (up to 20-fold)—such that routine dosing can lead to major and fatal bleeding episodes.1,2,3 Current clinical warfarin guidelines are able to predict only 25% of variability in dosage.3 In recent years, however, dosing algorithms incorporating common polymorphisms in a gene encoding a liver enzyme that metabolizes warfarin, cytochrome P4502C9 (CYP2C9), and in the gene for vitamin K epoxide reductase complex 1 (VKORC1) along with certain clinical characteristics (such as age, gender, and height) have been shown to predict approximately half of the interpatient variability in dosage.4,5,6
These studies led the U.S. Food and Drug Administration (FDA), in August 2007, to update the warfarin drug label to include information on how genetic polymorphisms can affect dosing (http://www.fda.gov/NewsEvents/Newsroom/PressAnnouncements/2007/ucm108967.htm, last accessed August 5, 2009). Nonetheless, the American College of Medical Genetics (ACMG) concluded that despite satisfactory analytical validity of clinical testing for the genetic variants that influence therapeutic dose of warfarin, there is insufficient evidence, at the present time, to recommend for or against routine pharmacogenetic testing.7,8 Clinicians also remain uncertain how to use the genotyping information for dosing patients.9 Many professional organizations have recommended further clinical research on the subject to generate evidence-based guidelines.
One of the most challenging aspects of transitioning the science of pharmacogenetics to the bedside is establishing criteria for its clinical application. Despite the publication of numerous genotype-based dosing algorithms,4,5,6,10,11,12,13,14,15,16,17 there are very few studies comparing the performance of these algorithms. Three existing comparison studies are based on small sample sizes, n = 75 by Langley et al,18 n = 92 by Wu et al,19 and n = 259 by Schelleman et al.14 The purpose of this study was to assess the analytical validity of a warfarin genotyping assay and to assess whether existing genotype-based warfarin dosing algorithms appropriately predict the actual maintenance dose for two independent datasets totaling 1095 patients: a service population in Farmington Valley, Connecticut and a multicenter study population of diverse ethnicity.
Materials and Methods
Human Subjects
This study was approved by the Institutional Review Board of the University of Connecticut Health Center (UCHC). A total of 150 patients on warfarin therapy were enrolled from the UCHC Anticoagulation Clinic from June 2007 to November 2007. All patients provided written informed consent for the study. Height was measured at the time of consent, and peripheral blood was obtained for genotyping. Clinical information was collected from medical records, including age, sex, ethnicity, weight, medications, comorbidity factors, reason(s) for anticoagulation, therapeutic target range expressed as an international normalized ratio (INR), initial INR, and maintenance warfarin dose. Age, weight, and medications were all obtained at the time of warfarin initiation. Maintenance dose was defined as the first warfarin dose at which 7 of 10 consecutive INR measurements were within the target range of 2.0 to 3.0. Body mass index (BMI) was calculated in the standard fashion from weight and height.
Patients were excluded from the final data analysis if one or more of the following situations occurred: incomplete medical information, including height and weight; concurrent treatment with amiodarone and other medications known to impact warfarin dosing; target INR other than 2 to 3; and significant comorbidity/comortality factors, including liver disease.
Genotyping
We used the Invader assay (Third Wave Technologies, Madison, WI) to genotype all patients for CYP2C9*2, CYP2C9*3, and VKORC1 −1639 polymorphisms according to the manufacturer's recommendations. A random selection of 10 samples was subjected to confirmatory automated sequencing using an ABI3130XL (Applied Biosystems, Foster City, CA). Specifically, amplified DNA products were purified with a PCR Cleanup kit (Promega Corp., Madison, WI) and analyzed with the BigDye Terminator v3.1 Cycler Sequencing Kit (Applied Biosystems, Foster City, CA) before loading onto the ABI 3130XL. Primers used for each locus are: CYP2C9*2 forward 5′-GACGCTGCGGAATTTTGG-3′, reverse 5′-AAGGCAGCGGGCTTCCT-3′; CYP2C9*3 forward 5′-GCCACATGCCCTACACAGATG-3′, reverse 5′-TTTCTGAATTTAATGTCACAGGTCACT-3′; VKORC1 −1639 forward 5′-GCCAGCAGGAGAGGGAAATA-3′, reverse 5′-AGTTTGGACTACAGGTGCCT-3′.
Validation of Published Algorithms
We tested the accuracy of three published dosing algorithms (detailed below) and the website http://www.warfarindosing.org (last accessed August 2009), incorporating genotype information. The modeled/predicted dose requirements were compared with the actual maintenance dose for each patient within the therapeutic INR of 2.0 to 3.0.
The Sconce equation is shown below5:
Age: input age in years; CYP2C9 genotype: input 0, 1, or 2 for the number of *2 and *3 alleles within the patient's genotype; VKORC1 −1639 genotype: input 1 for GG, 2 for GA, and 3 for AA; height: input height in centimeters. The output value is the square root of daily warfarin dose.
The Anderson equation is shown below10,12:
where expe is the exponential to base e; *1, *2, *3 refer to CYP2C9 wild-type (*1), or variant (*2, *3) genotypes, respectively; and Vk refers to the VKORC1 1173 C>T genotype, which is in strong linkage disequilibrium with the VKORC1 −1639 G>A genotype.5,20,21 Individuals with the A allele haplotype (i.e., −1639 A and 1173 T) require less therapeutic warfarin than those with the B allele haplotype (i.e., −1639 G and 1173 C).22 We hence used the haplotype groups, A and B, instead of G/A or C/T alleles in Table 1 and Figure 1B.
Table 1.
Characteristics of the Study Population
| Variable | Value (n = 125) |
|---|---|
| Demographics | |
| Age, y, mean ± SD | 70 ± 12.5 |
| Male, n (%) | 77 (61.6%) |
| Female, n (%) | 48 (38.4%) |
| White, n (%) | 125 (100%) |
| Height, cm, mean ± SD | 171.0 ± 12.5 |
| Weight, lb, mean ± SD | 183.0 ± 53.7* |
| BMI ± SD | 28.1 ± 6.65* |
| Indications for warfarin use | |
| Atrial fibrillation | 75.2% |
| Pulmonary embolism | 8.8% |
| Venous thrombosis | 4.8% |
| Cerebrovascular disease | 1.6% |
| Prosthetic heart valves | 4.0% |
| Miscellaneous | 5.6% |
| Maintenance dose, mean mg/week ± SD | 33.4 ± 16.3 |
| Patients with no genetic variants | 47.5 ± 18.3 |
| Patients with any genetic variants | 27.9 ± 11.5 |
| Genotype | |
| CYP2C9 | |
| *1*1 | 78 (62.4%) |
| *1*2 | 23 (18.4%) |
| *1*3 | 19 (15.2%) |
| *2*2 | 2 (1.6%) |
| *2*3 | 2 (1.6%) |
| *3*3 | 1 (0.8%) |
| VKORC1(−1639G>A) | |
| BB (GG) | 45 (36.0%) |
| AB (GA) | 58 (46.4%) |
| AA (AA) | 22 (17.6%) |
Weight information was only available for 121 subjects.
Figure 1.

Characteristics of the study population. A: Distribution histogram of the therapeutic maintenance dose of warfarin among study subjects. The x axis represents the warfarin dose in mg/week. The y axis represents the number of subjects for the respective dosing range. Four subjects (weekly dose of 75 to 95 mg) are the main cause for deviation from a normal distribution. All four subjects are wild-type. B: A box-and-whisker plot of the therapeutic maintenance dose for each genotype category for the study subjects. CYP2C9 genotypes are according to standard nomenclature. The VKORC1 genotypes are based on haplotype nomenclature: BB represents wild-type; AB, heterozygote; AA, homozygote.
The International Warfarin Pharmacogenetics Consortium (IWPC) equation is complicated and was provided in the supplementary appendix of Klein et al.23
The predicted doses from the http://www.warfarindosing.org web site, which used Gage et al data20 to create a dosing model before the release of IWPC data, were obtained from entering required parameters according to the website instruction (last accessed August 2009).
Statistical Analysis
An alternate prediction model was derived from the UCHC dataset using a step-wise selection approach, regressing the actual weekly dose on total number of variants, age, height, weight, BMI, and sex, until there was no statistically significant improvement in the fitted model. This prediction model is named the UCHC equation:
The output from each model was converted to a predicted weekly dose and compared with the actual weekly maintenance dose, using both the UCHC and IWPC datasets. Accuracy of the models was assessed using the absolute value of the difference between predicted dose and actual dose, calculated on both an absolute and percentage basis. Actual weekly dose was also regressed on predicted weekly dose, from which we obtained R2 values, as well as the intercept and slope of the fitted regression lines. Ideally, the latter values should be 0 and 1, respectively.
Clinical accuracy of the predictions was assessed by computing the proportion of patients in which the predicted dose was 20% or more below the actual dose (under dosed), within 20% of the actual dose (ideally dosed), or 20% or greater above the actual dose (over dosed), which was the method used by Klein et al.23 We show the percentages of patients that were under dosed, ideally dosed, and over dosed, for three ranges of actual dose in a table. We also illustrate with a figure the percentage of patients that were ideally dosed, within a window of ±10 mg/wk of actual dose.
Results
Demographics
A total of 150 patients consented for the study, including 91 males (61%) and 59 females (39%). The demographic and clinical data of the final 125 subjects included in the data analysis are summarized in Table 1. The average age (±SD) was 70 ± 12.5 with a range of 24 to 94 years (median age 73).
Analytical Validation of the Genotyping Procedures and Allele Composition
The Invader platform has been shown to accurately provide genotyping results with a high success rate and quick turn-around-time (TAT) of 3 hours.24 The analytical validity of the genetic variants has also been evaluated.7 In our laboratory, this assay has shown 100% analytical sensitivity and specificity by genotyping samples of known genotypes from Corriel Cell Repository and by comparing results with bidirectional Sanger's sequencing method.
All 150 patients were genotyped. CYP2C9*2 genotype frequencies were 77.3% for CC (wild-type), 20.0% for CT (heterozygous), and 2.67% for TT (homozygous). Therefore, the allele frequencies at this locus were 87.3% C (n = 262) and 12.7% for T (n = 38). These genotypes were in Hardy–Weinberg equilibrium.
The CYP2C9*3 genotype frequencies were 82.7% for AA (wild-type), 16.7% for AC (heterozygous), and 0.67% for CC (homozygous). Therefore, the allele frequencies at this locus were 91.0% A (n = 273) and 9.0% for C (n = 27). These genotypes were also in Hardy–Weinberg equilibrium.
The VKORC1–1639 genotype frequencies were 37.3% for GG (wild-type), 44.7% for GA (heterozygous), and 18.0% for AA (homozygous). Therefore, the allele frequencies at this locus were 59.7% G (n = 179) and 40.3% for A (n = 76). These genotypes were also in Hardy–Weinberg equilibrium.
Two- or three-loci genotypes including compound heterozygous CYP2C9*2*3 and double polymorphisms of CYP2C9 and VKORC1 were observed. However, the numbers are limited (Table 1).
Therapeutic Maintenance Dose
Of the 125 patients analyzed, the overall weekly maintenance dose range was 4.5 to 97.5 mg (33.4 ± 16.3). A histogram depicting the distribution of maintenance dose is shown in Figure 1A. The average observed weekly maintenance dose for the wild-type group was 47.5 ± 18.3 mg. The weekly maintenance dose for the polymorphic group was 27.9 ± 11.5 mg (P < 0.0001). For each genotype group, the weekly maintenance dose in milligrams is summarized in Figure 1B.
Development of a Simplified Dosing Algorithm
We examined the distribution of the maintenance doses of our cohort and found that they were approximately normally distributed with four wild-type outliers on the right (Figure 1A). We excluded these four patients, and used the remaining 121 subjects to develop a simple linear regression model for prediction. A recent prospective randomized trial suggested that the number of variant alleles carried by an individual, regardless of the type of the variants, can correlate with the therapeutic dose in a linear manner.10 When we plotted the actual maintenance dose according to the number of variants each patient has, the correlation appeared linear (Figure 2A); therefore, we decided to use the number of variants as a covariate instead of the specific individual genotype for the new model development. Heterozygous for any one locus is considered one variant; homozygous at a single locus or heterozygous at two loci is considered two variants.
Figure 2.
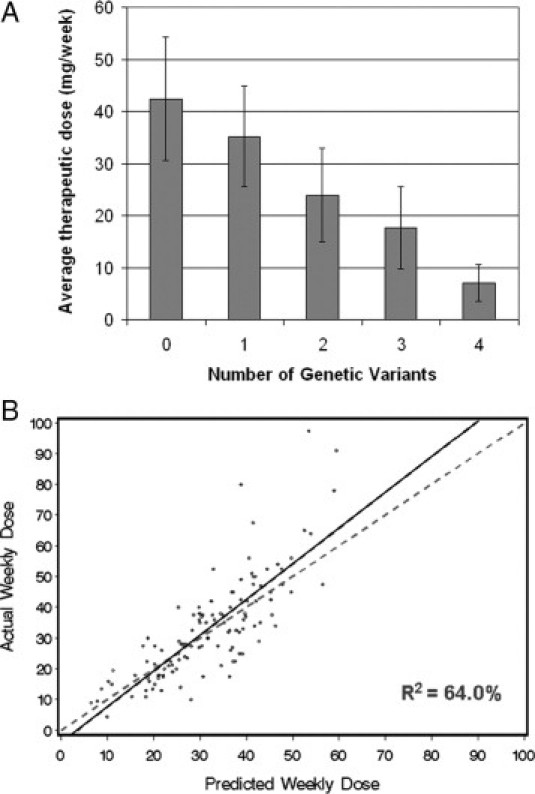
Development of a new regression algorithm for predicting warfarin dosing (UCHC model). A: Average stable maintenance doses in mg/week based on the number of genotype variants. Number of patients in each group: wild-type (0 variant), 35 (28%); 1 variant, 41 (33%); 2 variants, 36 (29%); 3 variants, 11 (8.8%); and 4 variants, 2 (1.6%). Dose differences across groups are highly significant (P < 0.001). B: Correlation analysis of the actual versus predicted doses using the regression algorithm shown in Table 2. Each patient is represented by a dot. The solid line is the linear regression, and the dotted line is the line of perfect prediction.
Among the 121 individuals, 31 were wild-type, 41 had one variant, 36 had two variants, 11 had three variants, and 2 had four variants. Other parameters, including age, weight, height, BMI, and sex were evaluated, but only age and height entered the final equation. The best algorithm is summarized in Table 2. This model yields an R2 value of 64.0% (Figure 2B).
Table 2.
Multiple Linear Regression Model for Prediction of Warfarin Dose
| Variable | Coefficient | t ratio | P value |
|---|---|---|---|
| Intercept | 46.20 | 3.90 | 0.0002 |
| Number of variants | −8.93 | −12.5 | <0.0001 |
| Age, y | −0.461 | −7.70 | <0.0001 |
| Height, cm | 0.173 | 2.94 | 0.004 |
Predicted weekly dose (mg) = 46.20 − 8.93 (number of variants) − 0.461(Age) + 0.173(Height).
Validation and Comparison of Published Dosing Algorithms
Several genotype-based dosing algorithms have been published.4,13,14,16,20,23,25 Limited by the availability of the data we could collect through a retrospective study, we chose three regression equations to evaluate their effectiveness in predicting warfarin doses for our patient cohort. One algorithm was developed by Sconce et al based on 297 UK patients,5 another one by Anderson et al based on 213 subjects from the Couma-Gen study in Utah, USA,10 and the most recently published algorithm from the IWPC based on 4043 subjects.23 In addition, we evaluated the dosing estimation performed by the web site http://www.warfarindosing.org (last accessed August 2009), which is termed the Gage model in Table 3.
Table 3.
Validation and Comparison of Published Dosing Algorithms
| Absolute error |
Absolute % error |
||||||
|---|---|---|---|---|---|---|---|
| Model | Mean ± SD | Median | Mean ± SD | Median | R2 | Intercept | Slope |
| Comparison of model prediction in the UCHC dataset (n = 121) | |||||||
| Sconce5 | 9.45 ± 8.83 | 7.93 | 28.0 ± 18.2 | 26.9 | 60.0 | 2.20 | 1.20 |
| Gage | 7.28 ± 7.22 | 5.4 | 23.6 ± 23.3 | 17.1 | 64.4 | −1.69 | 1.14 |
| IWPC23 | 7.13 ± 7.48 | 4.5 | 22.2 ± 20.0 | 16.7 | 64.8 | −2.33 | 1.17 |
| Anderson10 | 7.43 ± 7.64 | 5.59 | 23.7 ± 22.0 | 18.6 | 64.9 | −6.54 | 1.32 |
| UCHC (derivation set*) | 7.26 ± 7.00 | 5.31 | 25.2 ± 25.3 | 18.2 | 64.0 | −4.14 | 1.16 |
| Comparison of model prediction in the IWPC validation dataset (n = 974) | |||||||
| Sconce5 | 9.50 ± 8.99 | 6.91 | 34.5 ± 38.6 | 26.5 | 37.7 | 5.13 | 0.97 |
| Gage20 | 8.37 ± 7.92 | 6.47 | 34.5 ± 43.9 | 22.5 | 45.8 | 2.23 | 0.93 |
| IWPC23 | 8.39 ± 8.13 | 6.41 | 33.6 ± 42.7 | 22.2 | 44.5 | 1.66 | 0.98 |
| Anderson10 | 8.81 ± 8.11 | 6.74 | 37.8 ± 49.8 | 23.6 | 41.4 | −1.72 | 1.05 |
| UCHC | 9.74 ± 8.43 | 7.91 | 44.0 ± 58.5 | 26.0 | 36.8 | 1.12 | 0.88 |
The four outliers removed for model development are included here for evaluation of the model. Four different subjects are removed from this evaluation set because they were missing weight information and prediction could not be made for all models.
We calculated the predicted dose for each patient in our cohort with all of the algorithms. When the predicted doses derived from the above models were compared with the actual maintenance doses observed, four patients demonstrated much higher values of maintenance doses than the predicted doses. All four cases were of wild-type genotype for the three alleles assessed. To determine whether these patients contain rare VKORC1 variants that may predispose them to warfarin resistance,26,27 we sequenced the DNA of these four patients for these VKORC1 variants. None of the patients contained these variant alleles (data not shown).
Comparison of the model prediction in our cohort is summarized in Table 3 upper. Overall, all models showed a proportion of variation (R2) of greater than 60%. The average absolute error is the smallest for the predictions made by the IWPC model.
To evaluate all of the dosing models in an external validation dataset with a more diversified ethnic composition, we took advantage of the dataset from IWPC available at http://www.pharmgkb.org23 (last accessed March 2009). After removing subjects with incomplete covariate information that would preclude implementing all of the models, we had available n = 974 patients from the IWPC validation cohort. As expected, a larger sample size with more diversified ethnic composition in the IWPC validation set decreased the R2 values for all models to less than 46% (Table 3, lower and Figure 3). The mean absolute errors were slightly higher but similar for each model (Table 3, lower).
Figure 3.

Comparison of four published algorithms with the UCHC model for determining warfarin dosing. Shown are the scatterplots of the actual versus predicted doses by each of the algorithms for 974 patients in the IWPC. Solid lines are the least squares regression, and dotted lines represent the line of perfect prediction.
To further compare the performance of all these algorithms, we divided the patients into low-dose group (≤21 mg weekly), intermediate-dose group (21 to 49 mg weekly), and high-dose group (≥49 mg weekly) because the IWPC has shown the greatest benefits for using a pharmacogenetic algorithm in the low- and high-dose groups compared with current clinical algorithm and fixed dosing.23 We compared the predicted dose with the actual maintenance dose for each patient with each pharmcogenetic dosing algorithm and determined the percentage of patients that were underestimated (prediction ≤20% below actual), ideal (prediction within 20% of actual), and overestimated (prediction ≥20% above actual). The results are summarized in Table 4.
Table 4.
Comparison of Algorithm Performance Based on Dosing Ranges
| Actual dose ≤21 mg |
Actual dose 21 to 49 mg |
Actual dose ≥49 mg |
Overall |
|||||||||
|---|---|---|---|---|---|---|---|---|---|---|---|---|
| Model | Under | Ideal | Over | Under | Ideal | Over | Under | Ideal | Over | Under | Ideal | Over |
| UCHC dataset | n = 30 | n = 74 | n = 17 | n = 121 | ||||||||
| Sconce | 27% | 43% | 30% | 59% | 32% | 8% | 94% | 6% | 0% | 56% | 31% | 12% |
| Gage | 0% | 50% | 50% | 26% | 58% | 16% | 59% | 41% | 0% | 24% | 54% | 22% |
| IWPC | 10% | 53% | 37% | 27% | 58% | 15% | 71% | 29% | 0% | 29% | 53% | 18% |
| Anderson | 0% | 43% | 57% | 27% | 62% | 11% | 76% | 24% | 0% | 27% | 52% | 21% |
| UCHC* | 17% | 27% | 57% | 14% | 69% | 18% | 47% | 53% | 0% | 19% | 56% | 25% |
| IWPC validation dataset | n = 313 | n = 545 | n = 116 | n = 974 | ||||||||
| Sconce | 16% | 34% | 50% | 47% | 42% | 11% | 84% | 16% | 0% | 42% | 36% | 22% |
| Gage | 2% | 33% | 65% | 27% | 52% | 20% | 59% | 40% | 2% | 23% | 45% | 32% |
| IWPC | 5% | 33% | 62% | 27% | 54% | 19% | 62% | 38% | 0% | 24% | 45% | 31% |
| Anderson | 1% | 22% | 77% | 21% | 59% | 20% | 66% | 34% | 0% | 20% | 44% | 36% |
| UCHC | 3% | 17% | 80% | 15% | 52% | 33% | 54% | 45% | 1% | 16% | 40% | 44% |
Underestimation means prediction ≥20% below actual; overestimation means prediction ≥20% above actual.
The best performers in each category are in bold.
UCHC is derivation dataset.
In general, all models tend to overestimate for individuals requiring 21 mg or less weekly dose of warfarin; all models tend to underestimate for individuals requiring 49 mg or more weekly dose. Most models perform the best for those requiring a weekly dose between 21 and 49 mg, which account for the majority of the study subjects (61.1% in the UCHC cohort and 56.0% in the IWPC validation set). When comparing the percentage of patients for whom the predicted doses were ideal (Figure 4A and 4B), we found our algorithm works as equally well as the Gage model, the IWPC model, and the Anderson model for the intermediate-dose group, better than other models for the high-dose group, but worse than the other models for the low-dose group. The Sconce algorithm works well for the low-dose group but is not on par with the other models for the intermediate- and high-dose patients. The IWPC and Gage algorithms work relatively well for all groups.
Figure 4.

Comparison of all genotype-based dosing models based on the percentage of patients with predicted doses within 20% of actual. The x axis shows three actual dose groups: low (less than 21 mg/week), intermediate (21 to 49 mg/week), and high (greater than 49 mg/week). The y axis depicts the percentage of patients within each dose-group whose predicted dose is ideal (within 20% of actual). A: Comparison in the UCHC dataset. B: Comparison in the IWPC validation dataset.
To get a global view of the performance of all of the algorithms, we took a sliding window of ±10 mg/week of the actual dose and plotted the fraction of doses within the window predicted within 20% by each of the models (Figure 5A and 5B). The fraction of total observations within the window as it moves along was also plotted to allow visualization of whether the models are predicting well in the ranges where most dosing occurs.
Figure 5.

Sensitivity of dosing algorithms based on a sliding window of ±10 mg of actual doses. A: Comparison in the UCHC dataset. B: Comparison in the IWPC validation dataset.
Discussion
In this study, we confirmed the analytical validity of a warfarin genotyping assay for the local service population in Farmington Valley, Connecticut. We performed a comprehensive analysis comparing the performance of several published genotype-based warfarin dosing algorithms along with a new UCHC algorithm using the publicly accessible IWPC dataset and the UCHC study cohort with 1095 patients in total. To our knowledge, this is the first external validation of the IWPC dosing algorithm that compares its performance with other well-known warfarin dosing algorithms.
Analytical Validity and Allele Frequencies
The analytical sensitivity and specificity of the Invader genotyping assay were satisfactory and consistent with the literature.18,24 We observed an allele frequency of 12.7% for the *2 allele and 9.0% for the *3 allele of CYP2C9, similar to the 12.2% and 7.9%, respectively, reported in the European white population.24,28 The VKORC1 genotypes were also in agreement with those estimated for non-Hispanic whites (35%, 47%, and 18%, respectively).8,22 Preanalytical and postanalytical errors were not encountered.
Performance of the Dosing Algorithms
Independent external validation of representative, if not all, warfarin dosing models is indispensable for choosing the best algorithm/formula for warfarin dosing prediction. The literature is inconsistent in defining the criteria for the accuracy of dosing algorithms. Some studies have suggested that a mean underestimation of no more than 1 mg/day and a mean overestimation of no more than 0.5 mg/day would render the model acceptable.6,16 Others have used the percentage of predicted doses that are within 1 mg/day of the observed dose compared with the percentage of doses within 1 mg/day of the 5-mg empirical dose.14 Even others have suggested that an R2 value, which represents the percentage of variability explained by an algorithm, greater than 50% would be satisfactory.5 The IWPC tested different cut-off values to create low-, intermediate-, and high-dose groups. They concluded that the greatest benefits for using a genotype-based algorithm, compared with using a clinical algorithm or a fixed-dose approach, were observed in low- and high-dose groups when the thresholds of 21 mg and 49 mg per week were applied.23
We chose to compare the performance of several dosing algorithms by examining their absolute errors, R2 values, intercepts, and slopes as well as the percentage of predictions that fall within 20% of the actual dose in different dose groups. The UCHC dataset represents a local population with special characteristics, such as all white ethnicity and higher male sex composition. The IWPC validation dataset, on the other hand, provides an independent evaluation of a large sample-sized multiethnic population for unbiased comparison of different dosing algorithms.
For patients whose stable therapeutic doses were 21 mg or less per week, the Sconce algorithm, the Gage model, and the IWPC model all provided better predictions than the Anderson and UCHC algorithms. The UCHC algorithm provides the best predictions of ideal warfarin dose for patients whose stable therapeutic doses were 49 mg or more per week (Figure 4). These two groups of patients are the most at risk for adverse consequences of warfarin initiation from underdosing (risk of thrombosis) or overdosing (risk of hemorrhage) and have demonstrated the greatest benefits by pharmacogenetic dosing.23
Comparing the three dosing ranges, all algorithms performed the best for the intermediate dose group, which accounted for 56.5% of all patients. This, however, is the group for which pharmacogenetic dosing has shown little improvement from the current clinical dosing approach.23 Interestingly, the IWPC algorithm, which was derived from a large mixed-population base, did not provide the best prediction for all dosing ranges (Figure 5), although the algorithm did demonstrate the lowest absolute error in the IWPC validation dataset (Table 3). In the same data set, the Gage model showed the highest R2 value (Table 3). When comparing the percentage of patients whose predicted dosage is within 20% of actual for the two datasets combined, the IWPC algorithm performed marginally better than the others (45.9%), followed by the Anderson algorithm (44.9%) and the Gage model (44.2%). While both the Sconce model and the UCHC model were developed on entirely white populations, the Sconce model had the most underestimation in all dosing groups, especially the high-dose group, and the UCHC model had the most overestimation in all dosing groups, especially the low-dose group. Overall, each pharmacogenetics-based dosing algorithm performed similarly for both datasets. The R2 values are high (60% to 65%) in the small dataset with all whites from Connecticut but low (37% to 46%) in the large dataset with a diverse ethnic population from IWPC (Table 3). These data highlight the need for validation of any dosing algorithm for a local service population before clinical implementation and demonstrate the contribution of ethnic variation to the accuracy of dose prediction by genotype-based dosing algorithms.14,29,30 This is further supported by the finding that the UCHC algorithm provided a better prediction than the IWPC clinical algorithm (without genotyping data) among the subset of white patients in the low-dose range within the IWPC data, but this advantage disappears if patients of other ethnicity are included in the analysis (data not shown).
Clinical Application
The nature of a local service population is an important factor in choosing the most appropriate pharmacogenetics-based dosing algorithm for a given anticoagulation clinic. There does not appear to be a single outstanding “winner” to recommend for all service populations based on our study. Nevertheless, genotype information clearly provides value and benefit for more accurate warfarin dosing.23
One of the gaps in knowledge identified by the Rapid-ACCE review was how the difference in dosage among individuals with different genetic variants would be best presented to physicians who initiate warfarin therapy in patients.7 Most of the published dosing algorithms are extremely complicated. Langley et al raised the concern of whether complicated dosing algorithms will be widely adopted by the bulk of prescribing physicians.18 In keeping with the need for ease of use in clinical practice, a simplified algorithm with only a few variables can be very intuitive in application and easily implemented, which is particularly appealing to busy physicians practicing in community settings. In addition, a simple genotype-based algorithm may be used in conjunction with the traditional dose adjustment for patients on amiodarone, namely an additional 15% to 22% dose reduction, given its known correlation with therapeutic dose20,31,32; or with a 10% dose escalation for smokers.20 Until prospective studies provide solid evidence for the advantage of using a complicated dosing algorithm, simple guidance in dose adjustment based on genotyping information can be helpful options to physicians.
As for any data-driven model, the UCHC algorithm might reflect unique features within our data rather than a causal relationship between the variables and the therapeutic dose.33 In fact, the average therapeutic dose of our cohort is higher (33.4 mg/week) than those of other study populations (28.0 and 25.8 mg/week for the IWPC and Sconce cohort, respectively). This may explain why, when validated with the IWPC validation cohort, the UCHC algorithm tends to overestimate while the Sconce algorithm tends to underestimate (Table 4, lower). The higher than average therapeutic dose in our cohort may be partially explained by the higher percentage of males in the study population (61.6%), which translated to higher average height.
Limitations of the study include incomplete clinical and dietary/lifestyle information and the retrospective nature of the study. Some of the models may have performed better if more information were available, such as smoking status, alcohol intake, additional medications, and additional genetic and environmental factors. Inclusion of additional alleles for genotyping may also have improved dosing prediction. We were not able to account for the four subjects who showed extremely high maintenance dose values. They do not have the rare VKORC1 variants associated with warfarin resistance.26,27 Similar “outliers” were reported by other studies with no definitive explanation.18,23 Medication noncompliance is one of the most practical clinical concerns that may lead to such dosing “outliers.”
Future Directions
How should one define “better performance” of a pharmacogenetic test/dosing algorithm? Commonly used clinical validity parameters, including clinical sensitivity and specificity, positive and negative predictive values, are important measures to assess a test/algorithm's ability to correctly identify the phenotype of interest. However, the phenotype of interest is often not straightforward to define. In the case of warfarin, primary health outcomes, such as severe bleeding, and intermediate outcomes, such as out-of-therapeutic-range INRs, are likely the most appropriate. According to the ACMG policy statement, clinical sensitivity based on bleeding as the phenotype of interest should be around 50% to 60% overall.5,7,8 High positive predictive value and moderate negative predictive value are expected, although incomplete penetrance may reduce the positive predictive value. However, these numbers are limited to CYP2C9 genotypes alone. Further assessment of the clinical validity of an algorithm incorporating CYP2C9 and VKORC1 genotypes along with clinical information will await data from large, multicenter, randomized prospective trials with end points such as bleeding, time in therapeutic INR, etc., as the proper phenotype of interest. A recent large prospective study on 1496 Swedish patients demonstrated results supporting improved clinical outcome when using pharmacogenetics to guide warfarin initiation.34 Additional prospective verification will prove fruitful to propel the clinical adoption of genotype testing for the accurate prediction of warfarin dosing.
Acknowledgements
We thank Paul Appleton, M.D., for coordination of patient recruitment and regulatory compliance regarding Human Subject Research. We thank Karyn Ronski and Allison Tyropolis for technical assistance with DNA extraction and genotyping. We thank IWPC, especially Dr. Teri Klein, for providing access to the IWPC dataset and helpful assistance in using it. We also thank Steve Walsh, Ph.D., for statistical consultation during the earlier phase of the study. We appreciate the helpful comments from reviewers for improvement of the manuscript.
Footnotes
Supported in part by a General Clinical Research Center grant from the National Institutes of Health (M01RR06192) awarded to the University of Connecticut Health Center, Farmington, CT (to M.F.) and a medical student fellowship award from the same source (to N.R.).
This work was presented at the 14th Annual Meeting of the Association for Molecular Pathology (2008, Grapevine, TX) and has been published in abstract form (J Mol Diag 2008, 10:567, Abstract G07).
References
- 1.Jones M, McEwan P, Morgan CL, Peters JR, Goodfellow J, Currie CJ. Evaluation of the pattern of treatment, level of anticoagulation control, and outcome of treatment with warfarin in patients with non-valvar atrial fibrillation: a record linkage study in a large British population. Heart. 2005;91:472–477. doi: 10.1136/hrt.2004.042465. [DOI] [PMC free article] [PubMed] [Google Scholar]
- 2.Linkins LA, Choi PT, Douketis JD. Clinical impact of bleeding in patients taking oral anticoagulant therapy for venous thromboembolism: a meta-analysis. Ann Intern Med. 2003;139:893–900. doi: 10.7326/0003-4819-139-11-200312020-00007. [DOI] [PubMed] [Google Scholar]
- 3.Wadelius M, Pirmohamed M. Pharmacogenetics of warfarin: current status and future challenges. Pharmacogenomics J. 2007;7:99–111. doi: 10.1038/sj.tpj.6500417. [DOI] [PubMed] [Google Scholar]
- 4.Hillman MA, Wilke RA, Yale SH, Vidaillet HJ, Caldwell MD, Glurich I, Berg RL, Schmelzer J, Burmester JK. A prospective, randomized pilot trial of model-based warfarin dose initiation using CYP2C9 genotype and clinical data. Clin Med Res. 2005;3:137–145. doi: 10.3121/cmr.3.3.137. [DOI] [PMC free article] [PubMed] [Google Scholar]
- 5.Sconce EA, Khan TI, Wynne HA, Avery P, Monkhouse L, King BP, Wood P, Kesteven P, Daly AK, Kamali F. The impact of CYP2C9 and VKORC1 genetic polymorphism and patient characteristics upon warfarin dose requirements: proposal for a new dosing regimen. Blood. 2005;106:2329–2333. doi: 10.1182/blood-2005-03-1108. [DOI] [PubMed] [Google Scholar]
- 6.Voora D, Eby C, Linder MW, Milligan PE, Bukaveckas BL, McLeod HL, Maloney W, Clohisy J, Burnett RS, Grosso L, Gatchel SK, Gage BF. Prospective dosing of warfarin based on cytochrome P-450 2C9 genotype. Thromb Haemost. 2005;93:700–705. doi: 10.1160/TH04-08-0542. [DOI] [PubMed] [Google Scholar]
- 7.Flockhart DA, O'Kane D, Williams MS, Watson MS, Gage B, Gandolfi R, King R, Lyon E, Nussbaum R, Schulman K, Veenstra D. Pharmacogenetic testing of CYP2C9 and VKORC1 alleles for warfarin. Genet Med. 2008;10:139–150. doi: 10.1097/GIM.0b013e318163c35f. [DOI] [PubMed] [Google Scholar]
- 8.McClain MR, Palomaki GE, Piper M, Haddow JE. A rapid-ACCE review of CYP2C9 and VKORC1 alleles testing to inform warfarin dosing in adults at elevated risk for thrombotic events to avoid serious bleeding. Genet Med. 2008;10:89–98. doi: 10.1097/GIM.0b013e31815bf924. [DOI] [PubMed] [Google Scholar]
- 9.Shurin SB, Nabel EG. Pharmacogenomics–ready for prime time? N Engl J Med. 2008;358:1061–1063. doi: 10.1056/NEJMe0800801. [DOI] [PubMed] [Google Scholar]
- 10.Anderson JL, Horne BD, Stevens SM, Grove AS, Barton S, Nicholas ZP, Kahn SF, May HT, Samuelson KM, Muhlestein JB, Carlquist JF. Randomized trial of genotype-guided versus standard warfarin dosing in patients initiating oral anticoagulation. Circulation. 2007;116:2563–2570. doi: 10.1161/CIRCULATIONAHA.107.737312. [DOI] [PubMed] [Google Scholar]
- 11.Caraco Y, Blotnick S, Muszkat M. CYP2C9 genotype-guided warfarin prescribing enhances the efficacy and safety of anticoagulation: a prospective randomized controlled study. Clin Pharmacol Ther. 2008;83:460–470. doi: 10.1038/sj.clpt.6100316. [DOI] [PubMed] [Google Scholar]
- 12.Carlquist JF, Horne BD, Muhlestein JB, Lappe DL, Whiting BM, Kolek MJ, Clarke JL, James BC, Anderson JL. Genotypes of the cytochrome p450 isoform. CYP2C9, and the vitamin K epoxide reductase complex subunit 1 conjointly determine stable warfarin dose: a prospective study. J Thromb Thrombolysis. 2006;22:191–197. doi: 10.1007/s11239-006-9030-7. [DOI] [PubMed] [Google Scholar]
- 13.Millican EA, Lenzini PA, Milligan PE, Grosso L, Eby C, Deych E, Grice G, Clohisy JC, Barrack RL, Burnett RS, Voora D, Gatchel S, Tiemeier A, Gage BF. Genetic-based dosing in orthopedic patients beginning warfarin therapy. Blood. 2007;110:1511–1515. doi: 10.1182/blood-2007-01-069609. [DOI] [PMC free article] [PubMed] [Google Scholar]
- 14.Schelleman H, Chen J, Chen Z, Christie J, Newcomb CW, Brensinger CM, Price M, Whitehead AS, Kealey C, Thorn CF, Samaha FF, Kimmel SE. Dosing algorithms to predict warfarin maintenance dose in Caucasians and African Americans. Clin Pharmacol Ther. 2008;84:332–339. doi: 10.1038/clpt.2008.101. [DOI] [PMC free article] [PubMed] [Google Scholar]
- 15.Schwarz UI, Ritchie MD, Bradford Y, Li C, Dudek SM, Frye-Anderson A, Kim RB, Roden DM, Stein CM. Genetic determinants of response to warfarin during initial anticoagulation. N Engl J Med. 2008;358:999–1008. doi: 10.1056/NEJMoa0708078. [DOI] [PMC free article] [PubMed] [Google Scholar]
- 16.Tham LS, Goh BC, Nafziger A, Guo JY, Wang LZ, Soong R, Lee SC. A warfarin-dosing model in Asians that uses single-nucleotide polymorphisms in vitamin K epoxide reductase complex and cytochrome P450 2C9. Clin Pharmacol Ther. 2006;80:346–355. doi: 10.1016/j.clpt.2006.06.009. [DOI] [PubMed] [Google Scholar]
- 17.Wadelius M, Chen LY, Downes K, Ghori J, Hunt S, Eriksson N, Wallerman O, Melhus H, Wadelius C, Bentley D, Deloukas P. Common VKORC1 and GGCX polymorphisms associated with warfarin dose. Pharmacogenomics J. 2005;5:262–270. doi: 10.1038/sj.tpj.6500313. [DOI] [PubMed] [Google Scholar]
- 18.Langley MR, Booker JK, Evans JP, McLeod HL, Weck KE. Validation of clinical testing for warfarin sensitivity: comparison of CYP2C9-VKORC1 genotyping assays and warfarin-dosing algorithms. J Mol Diagn. 2009;11:216–225. doi: 10.2353/jmoldx.2009.080123. [DOI] [PMC free article] [PubMed] [Google Scholar]
- 19.Wu AH, Wang P, Smith A, Haller C, Drake K, Linder M, Valdes R., Jr Dosing algorithm for warfarin using CYP2C9 and VKORC1 genotyping from a multi-ethnic population: comparison with other equations. Pharmacogenomics. 2008;9:169–178. doi: 10.2217/14622416.9.2.169. [DOI] [PubMed] [Google Scholar]
- 20.Gage BF, Eby C, Johnson JA, Deych E, Rieder MJ, Ridker PM, Milligan PE, Grice G, Lenzini P, Rettie AE, Aquilante CL, Grosso L, Marsh S, Langaee T, Farnett LE, Voora D, Veenstra DL, Glynn RJ, Barrett A, McLeod HL. Use of pharmacogenetic and clinical factors to predict the therapeutic dose of warfarin. Clin Pharmacol Ther. 2008;84:326–331. doi: 10.1038/clpt.2008.10. [DOI] [PMC free article] [PubMed] [Google Scholar]
- 21.Li T, Lange LA, Li X, Susswein L, Bryant B, Malone R, Lange EM, Huang TY, Stafford DW, Evans JP. Polymorphisms in the VKORC1 gene are strongly associated with warfarin dosage requirements in patients receiving anticoagulation. J Med Genet. 2006;43:740–744. doi: 10.1136/jmg.2005.040410. [DOI] [PMC free article] [PubMed] [Google Scholar]
- 22.Rieder MJ, Reiner AP, Gage BF, Nickerson DA, Eby CS, McLeod HL, Blough DK, Thummel KE, Veenstra DL, Rettie AE. Effect of VKORC1 haplotypes on transcriptional regulation and warfarin dose. N Engl J Med. 2005;352:2285–2293. doi: 10.1056/NEJMoa044503. [DOI] [PubMed] [Google Scholar]
- 23.Klein TE, Altman RB, Eriksson N, Gage BF, Kimmel SE, Lee MT, Limdi NA, Page D, Roden DM, Wagner MJ, Caldwell MD, Johnson JA. Estimation of the warfarin dose with clinical and pharmacogenetic data. N Engl J Med. 2009;360:753–764. doi: 10.1056/NEJMoa0809329. [DOI] [PMC free article] [PubMed] [Google Scholar]
- 24.King CR, Porche-Sorbet RM, Gage BF, Ridker PM, Renaud Y, Phillips MS, Eby C. Performance of commercial platforms for rapid genotyping of polymorphisms affecting warfarin dose. Am J Clin Pathol. 2008;129:876–883. doi: 10.1309/1E34UAPR06PJ6HML. [DOI] [PubMed] [Google Scholar]
- 25.Gage BF, Eby C, Milligan PE, Banet GA, Duncan JR, McLeod HL. Use of pharmacogenetics and clinical factors to predict the maintenance dose of warfarin. Thromb Haemost. 2004;91:87–94. doi: 10.1160/TH03-06-0379. [DOI] [PubMed] [Google Scholar]
- 26.Loebstein R, Dvoskin I, Halkin H, Vecsler M, Lubetsky A, Rechavi G, Amariglio N, Cohen Y, Ken-Dror G, Almog S, Gak E. A coding VKORC1 Asp36Tyr polymorphism predisposes to warfarin resistance. Blood. 2007;109:2477–2480. doi: 10.1182/blood-2006-08-038984. [DOI] [PubMed] [Google Scholar]
- 27.Rost S, Fregin A, Ivaskevicius V, Conzelmann E, Hortnagel K, Pelz HJ, Lappegard K, Seifried E, Scharrer I, Tuddenham EG, Muller CR, Strom TM, Oldenburg J. Mutations in VKORC1 cause warfarin resistance and multiple coagulation factor deficiency type 2. Nature. 2004;427:537–541. doi: 10.1038/nature02214. [DOI] [PubMed] [Google Scholar]
- 28.Sanderson S, Emery J, Higgins J. CYP2C9 gene variants, drug dose, and bleeding risk in warfarin-treated patients: a HuGEnet systematic review and meta-analysis. Genet Med. 2005;7:97–104. doi: 10.1097/01.gim.0000153664.65759.cf. [DOI] [PubMed] [Google Scholar]
- 29.Perini JA, Struchiner CJ, Silva-Assuncao E, Santana IS, Rangel F, Ojopi EB, Dias-Neto E, Suarez-Kurtz G. Pharmacogenetics of warfarin: development of a dosing algorithm for brazilian patients. Clin Pharmacol Ther. 2008;84:722–728. doi: 10.1038/clpt.2008.166. [DOI] [PubMed] [Google Scholar]
- 30.Takahashi H, Wilkinson GR, Nutescu EA, Morita T, Ritchie MD, Scordo MG, Pengo V, Barban M, Padrini R, Ieiri I, Otsubo K, Kashima T, Kimura S, Kijima S, Echizen H. Different contributions of polymorphisms in VKORC1 and CYP2C9 to intra- and inter-population differences in maintenance dose of warfarin in Japanese. Caucasians and African-Americans. Pharmacogenet Genomics. 2006;16:101–110. doi: 10.1097/01.fpc.0000184955.08453.a8. [DOI] [PubMed] [Google Scholar]
- 31.Mungall DR, Ludden TM, Marshall J, Hawkins DW, Talbert RL, Crawford MH. Population pharmacokinetics of racemic warfarin in adult patients. J Pharmacokinet Biopharm. 1985;13:213–227. doi: 10.1007/BF01065653. [DOI] [PubMed] [Google Scholar]
- 32.Gage BF, Lesko LJ. Pharmacogenetics of warfarin: regulatory, scientific, and clinical issues. J Thromb Thrombolysis. 2008;25:45–51. doi: 10.1007/s11239-007-0104-y. [DOI] [PubMed] [Google Scholar]
- 33.Harrell FE, Jr, Lee KL, Mark DB. Multivariable prognostic models: issues in developing models, evaluating assumptions and adequacy, and measuring and reducing errors. Stat Med. 1996;15:361–387. doi: 10.1002/(SICI)1097-0258(19960229)15:4<361::AID-SIM168>3.0.CO;2-4. [DOI] [PubMed] [Google Scholar]
- 34.Wadelius M, Chen LY, Lindh JD, Eriksson N, Ghori MJ, Bumpstead S, Holm L, McGinnis R, Rane A, Deloukas P. The largest prospective warfarin-treated cohort supports genetic forecasting. Blood. 2009;113:784–792. doi: 10.1182/blood-2008-04-149070. [DOI] [PMC free article] [PubMed] [Google Scholar]