

Abstract
Objective:
To use diffusion tensor imaging (DTI) to assess gray matter and white matter tract diffusion in behavioral variant frontotemporal dementia (bvFTD), semantic dementia (SMD), and progressive nonfluent aphasia (PNFA).
Methods:
This was a case-control study where 16 subjects with bvFTD, 7 with PNFA, and 4 with SMD were identified and matched by age and gender to 19 controls. All subjects had 3-T head MRI with a DTI sequence with diffusion encoding in 21 directions. Gray matter mean diffusivity (MD) was assessed using a region-of-interest (ROI) and voxel-level approach, and voxel-based morphometry was used to assess patterns of gray matter loss. White matter tract diffusivity (fractional anisotropy and radial diffusivity) was assessed by placing ROIs on tracts of interest.
Results:
In bvFTD, increased gray matter MD and gray matter loss were identified bilaterally throughout frontal and temporal lobes, with abnormal diffusivity observed in white matter tracts that connect to these regions. In SMD, gray matter loss and increased MD were identified predominantly in the left temporal lobe, with tract abnormalities observed in the inferior longitudinal fasciculus and uncinate fasciculus. In PNFA, gray matter loss and increased MD were observed in left inferior frontal lobe, insula, and supplemental motor area, with tract abnormalities observed in the superior longitudinal fasciculus.
Conclusions:
The diffusivity of gray matter is increased in regions that are atrophic in frontotemporal dementia, suggesting disruption of the cytoarchitecture of remaining tissue. Furthermore, damage was identified in white matter tracts that interconnect these regions, supporting the hypothesis that these diseases involve different and specific brain networks.
GLOSSARY
- AAL
= automated anatomic labeling;
- AC
= anterior cingulate;
- ADRC
= Alzheimer's Disease Research Center;
- ADPR
= Alzheimer's Disease Patient Registry;
- AOS
= apraxia of speech;
- bvFTD
= behavioral variant frontotemporal dementia;
- CV
= coefficient of variation;
- DA
= axial diffusivity;
- DR
= radial diffusivity;
- DTI
= diffusion tensor imaging;
- FA
= fractional anisotropy;
- FDR
= false discovery rate;
- FOV
= field of view;
- FTD
= frontotemporal dementia;
- FWHM
= full-width at half-maximum;
- GCC
= genu of the corpus callosum;
- HDW
= high-dimensional warping;
- ILF
= inferior longitudinal fasciculus;
- MD
= mean diffusivity;
- MPRAGE
= magnetization prepared rapid acquisition gradient echo;
- PC
= posterior cingulate;
- PNFA
= progressive nonfluent aphasia;
- PVC
= partial volume correction;
- ROI
= region of interest;
- SLF
= superior longitudinal fasciculus;
- SMD
= semantic dementia;
- UNC
= uncinate fasciculus.
Diffusion tensor imaging (DTI) has recently emerged as a valuable technique for assessing structural changes in the brain.1–3 It can provide information on microstructural tissue integrity by measuring changes in water diffusion through tissue. This is particularly useful for assessing the integrity of white matter tracts because DTI can provide a measure of the directionality of diffusion (fractional anisotropy [FA]). However, DTI can also provide a measure of the magnitude of diffusivity (mean diffusivity), which is typically increased in neurodegeneration because of loss of microstructural barriers to diffusion, and can be used to assess the integrity of gray matter.
The frontotemporal dementias (FTDs) are a group of neurodegenerative disorders that are associated with unique and focal patterns of gray matter atrophy.4–7 These disorders include behavioral variant FTD (bvFTD), which is characterized by behavior and personality changes; progressive nonfluent aphasia (PNFA), characterized by phenomic errors and hesitant speech; and semantic dementia (SMD), characterized by naming problems.8 There is some evidence that bvFTD and SMD are associated with white matter tract degeneration,9–13 although DTI has not previously been assessed in PNFA, and it is unclear how patterns of tract degeneration differ across these variants.
The aim of this study was therefore to assess water diffusivity in white matter tracts and gray matter, and to compare these results with the patterns of gray matter atrophy in bvFTD, SD, and PNFA. We hypothesize that patterns of abnormal gray matter diffusivity will overlap with patterns of atrophy, although this is currently unknown.
METHODS
Subjects.
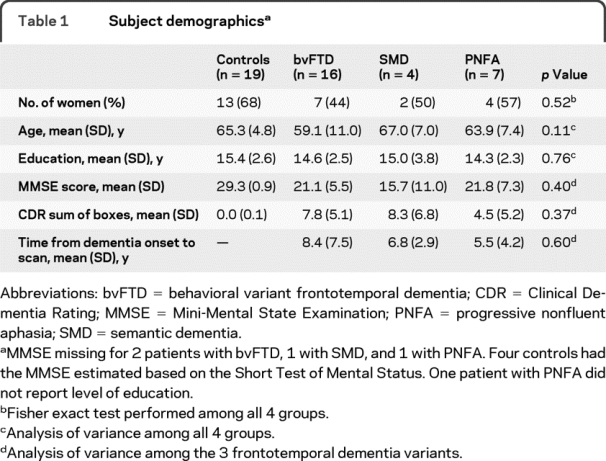
We identified all subjects (n = 27) from the Mayo Clinic Rochester Alzheimer's Disease Research Center (ADRC) or Patient Registry (ADPR) who fulfilled clinical criteria for FTD (16 bvFTD, 7 PNFA, 4 SMD),8 were recruited between July 2007 and October 2008, and had DTI-MRI. These subjects were frequency-matched by age and gender to 19 normal controls who had been recruited into the ADRC or ADPR. Subject demographics are shown in table 1.
Table 1 Subject demographics
Standard protocol approvals and consent.
Informed consent was obtained for participation in the studies, which were approved by the Mayo Institutional Review Board.
Image acquisition.
A standardized protocol was performed on a 3-T GE scanner (GE Healthcare, Milwaukee, WI). The DTI acquisition consisted of a single-shot echo-planar fluid-attenuated inversion recovery pulse sequence used to suppress CSF signal. Imaging was performed in axial plane, with repetition time/inversion time 8,800/2,200 milliseconds, in-plane matrix 128/122 (reconstructed 128 × 128), field of view (FOV) 38 cm, phase FOV 0.62, 21 diffusion encoding steps, in-plane resolution 3 mm, and slice thickness 3.3 mm. Parallel imaging with a SENSE factor of 2 was used. The protocol also included a 3-dimensional magnetization prepared rapid acquisition gradient echo (MPRAGE) sequence as previously described.14
Voxel-based morphometry.
Patterns of gray matter atrophy were assessed using voxel-based morphometry15 in SPM5. Scans were normalized to the Montreal Neurological Institute template, segmented using unified segmentation and averaged to create customized templates and prior probability maps. All images were then normalized to the customized template and segmented using the customized tissue probability maps into gray matter, white matter, and CSF,16 followed by the hidden Markov random field cleanup step.17 Gray matter images were modulated and smoothed at 8-mm full-width at half-maximum (FWHM).
DTI processing.
Each of the 21 diffusion-weighted images was registered to the nondiffusion weighted b0 volumes using 12-df affine registration. Maps of FA, color-coded FA, mean diffusivity (MD), axial diffusivity (DA) (equivalent to eigenvector 1), and radial diffusivity (DR) (average of eigenvectors 2 and 3) were computed from these 21 diffusion-weighted images using DtiStudio.18 To maintain a clear distinction between cortex and tract measurements, MD was assessed in gray matter regions that lack directional diffusion, with FA, DR, and DA assessed in white matter tracts since the diffusion is inherently directional.
Gray matter diffusivity measurements.
Gray matter diffusivity was measured using both an atlas-based parcellation and voxel-level analysis. The atlas-based parcellation technique used the automated anatomic labeling (AAL) atlas19 and SPM5 to generate mean MD values for different regions of interest (ROIs). We analyzed 16 mutually exclusive ROIs covering left and right frontal, temporal, parietal, and occipital lobes and basal ganglia.
The AAL atlas19 was normalized to a customized template16 and edited. Each MPRAGE was normalized to the customized template, and the inverse transformation was applied to warp the atlas labels to the subject's native anatomical space (figure e-1 on the Neurology® Web site at www.neurology.org). Each MPRAGE was segmented into gray matter, white matter, and CSF in native space. Next, the MPRAGE of each subject was warped to the b0 image using an in-house modified version of the high-dimensional warping (HDW) toolbox in SPM5. The resulting deformation was applied to the subject-specific atlas, as well as to the segmented images. For each subject, the b0-space segmented gray and white matter segmentations were combined to create a binary brain mask. Each subject's brain mask was multiplied by the subject-specific b0-space atlas, to generate a custom atlas for each subject, parcellated into the aforementioned ROIs. The b0-space gray and white matter images were used to perform partial volume correction (PVC) on the MD image, using a 2-compartment PVC algorithm.20 PVC-corrected MD values were calculated for all gray matter ROIs in the atlas.
For the voxel-level analysis, each PVC-corrected MD image was transformed into template space by inverting the deformation obtained for the HDW of each MPRAGE to b0 space, combined with the transformation performed above to normalize each MPRAGE into template space. An 8-mm FWHM smoothing filter was applied.
White matter tract diffusivity measurements.
Specific white matter tracts were identified using the color-coded FA maps. ROIs were placed on the tracts on the color-coded FA maps using ANALYZE software (Mayo Biomedical Imaging Resource, Rochester, MN) by 1 rater (J.L.W.) blinded to clinical diagnosis. Regions were placed using anatomic landmarks on axial images, but coronal images were viewed simultaneously to guide placement. ROIs were placed on the following tracts (figure 1): genu of the corpus callosum (GCC), splenium of the corpus callosum, uncinate fasciculus (UNC) at the vertical position where it connects temporal and frontal lobes, inferior longitudinal fasciculus (ILF), anterior cingulate (AC), posterior cingulate (PC), superior longitudinal fasciculus (SLF), and the descending corticospinal/corticopontine tracts. The SLF was sampled at 3 positions: anterior descending tracts branching into the inferior frontal lobes, posterior descending tracts branching into posterior temporal lobes, and superior horizontal fibers usually positioned adjacent to the most superior slice of the lateral ventricles. The ILF was sampled at an anterior and posterior position within the temporal lobe. All ROIs were measured separately for the left and right hemispheres, except for the corpus callosum. Once the ROIs had been placed using color-coded FA maps, they were overlaid on FA, DA, and DR maps to calculate tract statistics for each ROI.
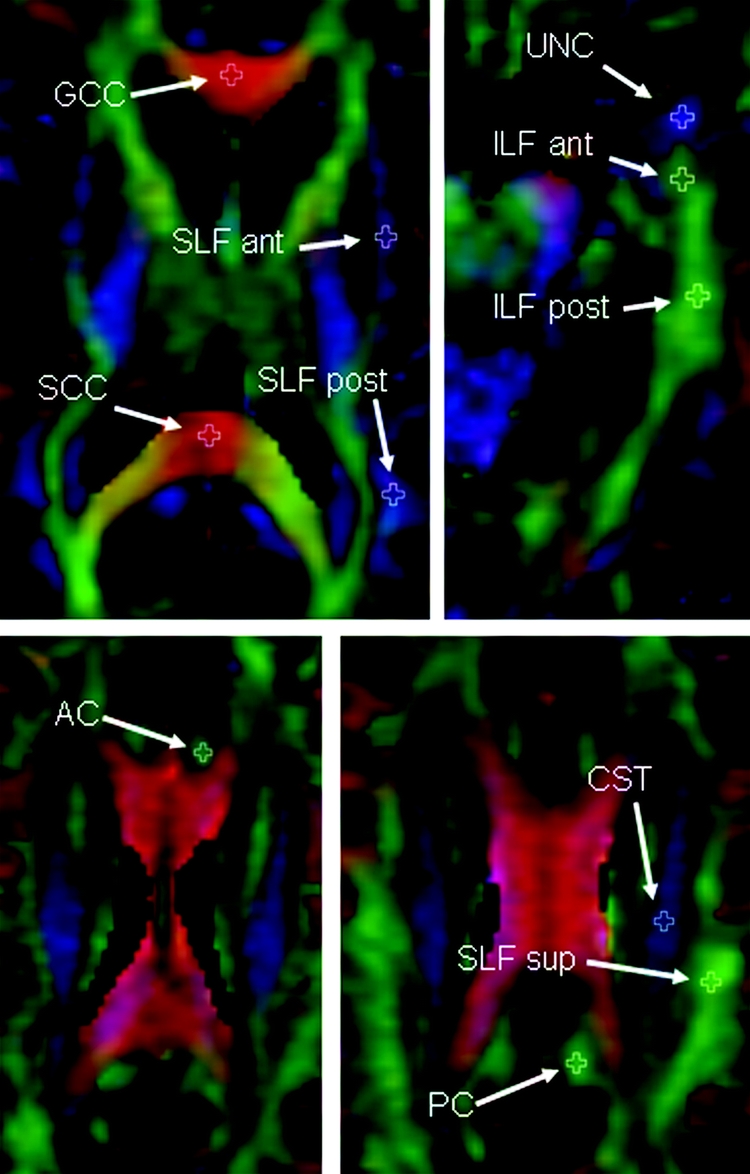
Figure 1 Illustration of placement of fractional anisotropy regions of interest
Fractional anisotropy color map from a control subject illustrating the placement of the white matter tract regions of interest. Regions of interest have been placed in the left hemisphere only. AC = anterior cingulate; ant = anterior; CST = corticospinal tract; GCC = genu of the corpus callosum; ILF = inferior longitudinal fasciculus; PC = posterior cingulate; post = posterior; SCC = splenium of the corpus callosum; SLF = superior longitudinal fasciculus; sup = superior; UNC = uncinate fasciculus.
Intrarater reproducibility was assessed by placing ROIs on 20 subjects twice with an interval of 2 weeks. The rater was blinded to ROI placement at time 1 when placing ROIs at time 2.
Statistics.
To assess reproducibility, we estimated within-subject coefficient of variation (CV) for each ROI by fitting an intercept-only mixed effects model with a random patient effect and, when applicable, a random side-within-patient effect.21 Left and right ROIs from the same subject were treated as separate, albeit correlated, observations.
To assess the gray matter and white matter tract ROI data, we fitted analysis of covariance models with 4-level group effects for each ROI within each endpoint (FA, DA, DR, and gray matter MD) with age and gender included as covariates. We estimated pairwise differences with 95% confidence intervals and performed pairwise hypothesis tests using contrasts from the model. To control the number of false-positive pairwise differences, we applied a false discovery rate (FDR) correction,22 which controls the proportion of false-positives across the p values for all ROIs for each endpoint. Significance was considered at p < 0.05 and at trend level to p < 0.1. If comparisons did not survive correction using FDR, uncorrected p values at p < 0.05 were reported.
To assess gray matter volume and MD at the voxel level, we applied full-factorial models in SPM5 to assess differences between disease groups and controls with age and gender included as covariates. The MD analysis was masked by the gray matter template with a threshold of 0.05. The results for these voxel-level analyses were assessed uncorrected at p < 0.001.
RESULTS
Gray matter voxel-level analyses.
Patterns of gray matter volume loss and MD increase are shown in figure 2. The bvFTD group showed bilateral gray matter loss and MD increase throughout the frontal and anterior temporal lobes, with some involvement of the medial and lateral parietal lobes and occipital lobes. The SMD group showed loss and MD increase predominantly in the temporal lobes, particularly on the left, with loss extending into the occipital lobes. The PNFA group showed loss and MD increase in the left posterior inferior and superior frontal lobe, anterior insula, supplemental motor area, and temporal lobe.

Figure 2 Patterns of gray matter loss and mean diffusivity increase using statistical parametric mapping
Three-dimensional renderings of the brain showing the patterns of gray matter loss (left) and patterns of mean diffusivity (MD) increase (right) in behavioral variant frontotemporal dementia (bvFTD), semantic dementia (SMD), and progressive nonfluent aphasia (PNFA) groups compared with controls. Results are shown uncorrected for multiple comparisons at p < 0.001.
Gray matter ROI diffusivity.
The ROI-based gray matter results are shown in table e-1. The bvFTD group showed increases in MD across all ROIs, with the most significant increases bilaterally throughout the temporal and frontal lobes, insula, and caudate nucleus. The most significant increases in MD in SMD were observed in left temporal lobe regions, with significant increases also observed in the right temporal lobe, insula, and left-sided frontal, parietal, and occipital lobes and caudate nucleus. No regions of increased MD survived the FDR correction in PNFA; however, there was a trend using uncorrected p values for increased MD in the bilateral inferior frontal lobes and the left supplemental motor area, insula, superior and medial frontal lobes, orbitofrontal cortex, temporal lobe, and precentral gyrus.
Significant differences across disease groups were only identified using uncorrected p values. bvFTD showed greater MD in the right temporal, medial frontal, precentral, and parietal lobes than PNFA; SMD showed greater MD in the left lateral temporal lobe than bvFTD and greater MD in the left temporal lobe, caudate, medial parietal and occipital lobe, and right medial temporal lobe than PNFA.
White matter tract ROI diffusivity.
The mean of the within-subject CV21 estimates across all ROIs was 0.06 (range 0.03–0.10) for FA, 0.06 (0.02–0.13) for DR, and 0.05 (0.03–0.08) for DA.
White matter tract results are shown in table 2, figure 3, and figure e-2. In bvFTD, decreased FA and increased DR were identified in bilateral UNC, AC, anterior SLF, left posterior SLF, and anterior ILF, with altered DR only in the GCC and posterior ILF. Increased FA was observed in the corticospinal tract. The SMD group showed significantly decreased FA and increased DR in the left posterior ILF, UNC, and PC. Increased DR was also found in the left anterior ILF, and decreased FA was found in the left anterior SLF. In contrast to the other groups, PNFA showed the most significant alterations in diffusivity in the SLF, with decreased FA and increased DR in the anterior SLF, and decreased FA in the left posterior and superior SLF and right UNC. No significant alterations in DA were identified in any tracts in any group.
Table 2 Mean ± SD white matter tract fractional anisotropy and radial diffusivity by clinical group
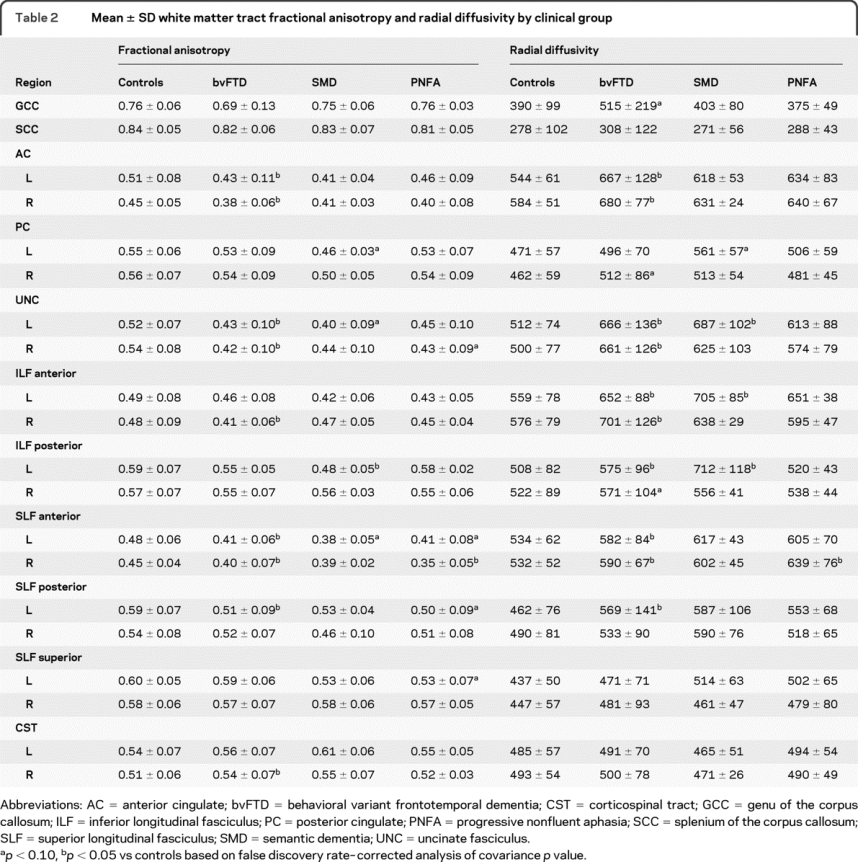

Figure 3 Box plots showing the distribution of fractional anisotropy values for the disease groups
To aid comparison, fractional anisotropy (FA) values were centered at the region of interest (ROI)–specific control group mean (defined as zero on the horizontal axis) and thus can be interpreted as differences between each disease group and controls for each white matter tract ROI. The boxes indicate the 25th, 50th (median), and 75th percentiles of the distributions, whereas the horizontal lines extending from the boxes stop at the most extreme data points. AC = anterior cingulate; ant = anterior; bvFTD = behavioral variant frontotemporal dementia; CST = corticospinal tract; GCC = genu of the corpus callosum; ILF = inferior longitudinal fasciculus; PC = posterior cingulate; post = posterior; PNFA = progressive nonfluent aphasia; SCC = splenium of the corpus callosum; SLF = superior longitudinal fasciculus; SMD = semantic dementia; sup = superior; UNC = uncinate fasciculus. * p < 0.10, ** p < 0.05 vs controls based on false discovery rate–corrected analysis of covariance p value.
Differences across the 3 disease groups were only identified using uncorrected p values; PNFA showed lower FA in the superior SLF than bvFTD, whereas bvFTD showed higher DR in the right anterior ILF than PNFA. SMD showed lower FA and higher DR in the left posterior ILF than both bvFTD and PNFA.
DISCUSSION
This study has demonstrated that FTD is associated with changes in both gray matter and white matter water diffusivity, and that patterns of change differ across the 3 syndromic variants of FTD.
Early DTI studies assessing white matter tracts typically reported FA, although more recent studies have moved toward reporting DR and DA, where increases in DR have been interpreted as reflecting loss of myelin integrity23 and increases in DA represent axonal degeneration. However, it was recently suggested that alignment of the eigenvectors with underlying tissue could be affected by disease pathology, and so this interpretation may not always hold.24 This criticism of DR and DA does not extend to FA, which is still considered to represent a valid measure of the degree to which water diffusion is directional. Therefore, although we report DR and DA for consistency with previous studies, caution should be exercised in interpreting these data. Tract abnormalities were observed in all disease groups, although changes were only identified in FA and DR.
bvFTD was associated with widespread patterns of increased gray matter MD, particularly affecting bilateral temporal and frontal lobes, but also the parietal lobes. These changes closely mirrored the patterns of gray matter loss in the same subjects, suggesting a close spatial association between atrophy and increases in water diffusion and showing that the remaining tissue has abnormalities that can be detected using DTI. Patterns of predominantly frontal and temporal gray matter loss are typical for bvFTD.7,25–27 We also identified diffusivity changes in many white matter tracts in bvFTD. These were typically tracts that connected the regions of atrophic brain tissue. Diffusivity changes were identified in tracts located in the frontal lobes, such as the AC, GCC, and anterior SLF, and tracts that connect to the temporal lobes, such as the UNC and ILF. The changes observed in the ILF were particularly severe in anterior portions of the tract, which corresponds to the fact that gray matter loss was most severe in the anterior temporal lobe. However, changes in diffusivity were also identified in more posterior ROIs, such as the posterior SLF, and in the PC. Although bvFTD is typically considered to involve the anterior temporal and frontal lobes, the lateral and medial parietal lobes can be severely affected27 and usually become affected later in the disease course. It is also possible that our cohort consists of different anatomical variants of bvFTD,27 although we had too few subjects to allow further subdivision. A previous study similarly identified abnormal diffusivity in anterior corpus callosum, AC, and PC, and UNC in subjects with bvFTD, although they did not specifically identify and assess the ILF or SLF.13
The patterns of gray matter MD increase in SMD similarly matched well with the patterns of tissue loss. Both measures were associated with asymmetric patterns, with the most severe changes observed in the left hemisphere and particularly involving the temporal lobes. This pattern of atrophy is typical of subjects with SMD.6,7,28,29 Both gray matter loss and MD increases were also observed in the insula, frontal, parietal, and occipital lobes, with changes worse in the left hemisphere. Changes in white matter tract diffusivity were similarly identified in the left hemisphere, with the most significant changes in FA and DR identified in the left anterior and posterior ILF and left UNC, which both connect to the temporal lobes. The ILF seems to be particularly related to SMD because it was involved to a greater degree than in bvFTD and PNFA. The ILF connects the temporal and occipital lobes30 and has been suggested to play a role in visual object recognition and in linking object representations to their lexical labels.31 It is also likely that the ROI in the posterior ILF may contain fibers from the inferior fronto-occipital fasciculus, which has also been implicated in semantic processing,32 because these tracts overlap to a large degree. Although the UNC, which connects frontal and temporal lobes, has been suggested to be involved in semantic processing,31 the fact that it was also heavily involved in bvFTD supports the suggestion that it may not be essential for language33 but may instead be contributing to behavioral dyscontrol,9 which can be present in both bvFTD and SMD. We also observed some changes in FA in the ROI placed in the left anterior SLF, which is positioned in the SLF as it descends into the inferior frontal lobe. This ROI may contain fibers from the arcuate fasciculus, which has previously been shown to have reduced FA in SMD9 and has been thought to play a role in language function.31,34,35
Less severe gray matter changes were observed in PNFA. Increases in gray matter MD and gray matter loss were observed in left inferior and superior frontal lobe, insula, and supplemental motor area. Additional increases were observed in the left orbitofrontal cortex, medial frontal lobe, temporal pole, precentral gyrus, and right inferior frontal lobe. Previous studies have consistently found patterns of tissue loss in the inferior frontal lobes and insula in PNFA.5,29,36,37 The supplemental motor area has been shown to be associated with apraxia of speech (AOS),5 which is commonly found in patients with PNFA. Interestingly, the tract that showed the most severe changes in FA and DR was the SLF, with involvement of the anterior SLF tracts that descend into the inferior frontal lobes, the posterior SLF tracts that descend into the posterior temporal lobe, and the horizontal superior SLF tracts. In fact, PNFA was the only group to show significantly altered diffusivity in the superior SLF, and there was a trend for PNFA to show significantly lower FA in this tract compared with bvFTD. This result fits with the fact that the greatest regions of atrophy were identified in the inferior frontal lobes and suggests that damage to the SLF may play a role in the language deficits in PNFA. Abnormalities in the SLF have been previously reported in subjects with primary progressive aphasia.34 However, the superior SLF ROI is also likely to contain tracts that interconnect with motor and premotor regions.35 It is therefore possible that damage to these tracts contributes to dysarthria and AOS that can be found in PNFA.5 The presence of AOS is associated with corticobasal degeneration pathology5 and previous studies of corticobasal syndrome have similarly reported diffusivity changes in the supplemental motor area and frontoparietal fibers, which likely coincide with the superior SLF.38,39 Detailed speech and language assessments were not available for the subjects in this study, however, and therefore the contribution of these motor problems is presently unclear.
This study has demonstrated differences in patterns of gray and white matter diffusion across the syndromic variants of FTD. Not all the results survived correction for multiple comparisons because of small numbers of subjects, but interesting trends were still identified. Damage to certain white matter tracts was relatively disease specific, with the AC and GCC only affected in bvFTD, the ILF preferentially affected in SMD, and the SLF being most heavily affected in PNFA. These abnormal tracts interconnect with the regions of abnormal gray matter in each disease, supporting the hypothesis that these diseases involve different large-scale neural networks.40
AUTHOR CONTRIBUTIONS
Statistical analysis was performed by Stephen D. Weigand, MS.
STUDY FUNDING
Supported by grants P50 AG16574, U01 AG06786 and R01 AG11378 from the National Institute on Aging, Bethesda, MD; the NIH Roadmap Multidisciplinary Clinical Research Career Development Award Grant (K12/NICHD)-HD49078; the NIH/Paul Beeson Career Development Awards in Aging K23 AG030935; and the generous support of the Robert H. and Clarice Smith and Abigail Van Buren Alzheimer's Disease Research Program of the Mayo Foundation, USA, the Alexander Family Alzheimer's Disease Research Professorship of the Mayo Foundation, and the NIH Construction Grant (NIH C06 RR018898).
DISCLOSURE
Dr. Whitwell receives research support from the Dana Foundation (Coinvestigator) and the NIH (R01-AG11378). Dr. Avula serves as a consultant to Medical Imaging Solutions. Mr. Senjem reports no disclosures. Dr. Kantarci receives research support from the NIH (K23 AG030935 [PI], P50 AG16574/P1 [PI], and R01 AG11378 [Coinvestigator]). Mr. Weigand and Mr. Samikoglu report no disclosures. Dr. Edmonson holds, receives royalties from, and has received a license fee from Siemens for US Patent 6,472,872, issued 2002: Real-time shimming of polarizing field in magnetic resonance system; and receives research support from the NIH (NIA R01 AG11378[Coinvestigator], NCRR UL1 RR 24150 [Coinvestigator], NIBIB R01 EB00229 [Coinvestigator], and NIMH R01 MH79261 [Coinvestigator]). Dr. Vemuri receives support from the Robert H. Smith Family Foundation Research Fellowship and the NIH (R01-AG11378). Dr. Knopman serves as an Associate Editor for Neurology®; has served on data safety monitoring boards for sanofi-aventis, GlaxoSmithKline, and Eli Lilly and Company; is an investigator in clinical trials sponsored by Elan Corporation, Baxter International Inc., and Forest Laboratories, Inc.; and receives research support from the NIH (R01-AG023195 [PI], R01-AG11378 [Coinvestigator], P50 AG16574 [Coinvestigator], U01 AG 06786 [Coinvestigator], and R01 HL70825 [Coinvestigator]). Dr. Boeve has served as a consultant to GE Healthcare; has received travel expenses and/or honoraria for lectures or educational activities not funded by industry; receives royalties from the publication of Behavioral Neurology of Dementia (Cambridge Medicine, 2009); and receives research support from Myriad Genetics Inc., Cephalon, Inc., the NIH (P50 AG16574 [Coinvestigator], UO1 AG06786 [Coinvestigator, and RO1 AG15866 [Coinvestigator]), the Alzheimer's Association, and the Center for Inherited Disease Research (U24 AG026395 [Coinvestigator]). Dr. Petersen serves on scientific advisory boards for Elan Corporation, Wyeth, and GE Healthcare; receives royalties from the publication of Mild Cognitive Impairment (Oxford University Press, 2003); and receives research support from the NIH/NIA (U01 AG 06786 [PI], P50 AG 16574 [PI], U01 AG 024904 [Subcontract PI], and R01 AG11378 [Coinvestigator]). Dr. Josephs is funded by the NIH Roadmap Multidisciplinary Clinical Research Career Development Award Grant (K12/NICHD)-HD49078 (PI), the Morris K. Udall PD Research Center of Excellence NIH/NINDS P50 NS40256 (Coinvestigator), and the Dana Foundation (PI). Dr. Jack serves as a consultant for Elan Corporation; receives research support from Pfizer Inc., the NIH/NIA (R01-AG11378 [PI], P50-AG16574 [Coinvestigator], and U01 AG024904-01 [Coinvestigator]), and the Alexander Family Alzheimer's Disease Research Professorship of the Mayo Foundation; and holds stock in GE Healthcare.
Supplementary Material
Address correspondence and reprint requests to Dr. Jennifer L. Whitwell, Department of Radiology, Mayo Clinic, 200 First St. SW, Rochester MN, 55905 whitwell.jennifer@mayo.edu
Supplemental data at www.neurology.org
Study funding: Funding information is provided at the end of the article.
Disclosure: Author disclosures are provided at the end of the article.
Received November 20, 2009. Accepted in final form February 2, 2010.
REFERENCES
- 1.Basser PJ, Mattiello J, LeBihan D. Estimation of the effective self-diffusion tensor from the NMR spin echo. J Magn Reson B 1994;103:247–254. [DOI] [PubMed] [Google Scholar]
- 2.Basser PJ, Mattiello J, LeBihan D. MR diffusion tensor spectroscopy and imaging. Biophys J 1994;66:259–267. [DOI] [PMC free article] [PubMed] [Google Scholar]
- 3.Conturo TE, Lori NF, Cull TS, et al. Tracking neuronal fiber pathways in the living human brain. Proc Natl Acad Sci USA 1999;96:10422–10427. [DOI] [PMC free article] [PubMed] [Google Scholar]
- 4.Grossman M, McMillan C, Moore P, et al. What's in a name: voxel-based morphometric analyses of MRI and naming difficulty in Alzheimer's disease, frontotemporal dementia and corticobasal degeneration. Brain 2004;127:628–649. [DOI] [PubMed] [Google Scholar]
- 5.Josephs KA, Duffy JR, Strand EA, et al. Clinicopathological and imaging correlates of progressive aphasia and apraxia of speech. Brain 2006;129:1385–1398. [DOI] [PMC free article] [PubMed] [Google Scholar]
- 6.Josephs KA, Whitwell JL, Vemuri P, et al. The anatomic correlate of prosopagnosia in semantic dementia. Neurology 2008;71:1628–1633. [DOI] [PMC free article] [PubMed] [Google Scholar]
- 7.Rosen HJ, Gorno-Tempini ML, Goldman WP, et al. Patterns of brain atrophy in frontotemporal dementia and semantic dementia. Neurology 2002;58:198–208. [DOI] [PubMed] [Google Scholar]
- 8.Neary D, Snowden JS, Gustafson L, et al. Frontotemporal lobar degeneration: a consensus on clinical diagnostic criteria. Neurology 1998;51:1546–1554. [DOI] [PubMed] [Google Scholar]
- 9.Agosta F, Henry RG, Migliaccio R, et al. Language networks in semantic dementia. Brain 2010;133(pt 1):286–299. [DOI] [PMC free article] [PubMed] [Google Scholar]
- 10.Borroni B, Brambati SM, Agosti C, et al. Evidence of white matter changes on diffusion tensor imaging in frontotemporal dementia. Arch Neurol 2007;64:246–251. [DOI] [PubMed] [Google Scholar]
- 11.Matsuo K, Mizuno T, Yamada K, et al. Cerebral white matter damage in frontotemporal dementia assessed by diffusion tensor tractography. Neuroradiology 2008;50:605–611. [DOI] [PubMed] [Google Scholar]
- 12.Yoshiura T, Mihara F, Koga H, et al. Cerebral white matter degeneration in frontotemporal dementia detected by diffusion-weighted magnetic resonance imaging. Acad Radiol 2006;13:1373–1378. [DOI] [PubMed] [Google Scholar]
- 13.Zhang Y, Schuff N, Du AT, et al. White matter damage in frontotemporal dementia and Alzheimer's disease measured by diffusion MRI. Brain 2009;132:2579–2592. [DOI] [PMC free article] [PubMed] [Google Scholar]
- 14.Jack CR Jr, Lowe VJ, Weigand SD, et al. Serial PIB and MRI in normal, mild cognitive impairment and Alzheimer's disease: implications for sequence of pathological events in Alzheimer's disease. Brain 2009;132:1355–1365. [DOI] [PMC free article] [PubMed] [Google Scholar]
- 15.Ashburner J, Friston KJ. Voxel-based morphometry: the methods. Neuroimage 2000;11:805–821. [DOI] [PubMed] [Google Scholar]
- 16.Ashburner J, Friston KJ. Unified segmentation. Neuroimage 2005;26:839–851. [DOI] [PubMed] [Google Scholar]
- 17.Zhang Y, Brady M, Smith S. Segmentation of brain MR images through a hidden Markov random field model and the expectation-maximization algorithm. IEEE Trans Med Imaging 2001;20:45–57. [DOI] [PubMed] [Google Scholar]
- 18.Jiang H, van Zijl PC, Kim J, et al. DtiStudio: resource program for diffusion tensor computation and fiber bundle tracking. Comput Methods Programs Biomed 2006;81:106–116. [DOI] [PubMed] [Google Scholar]
- 19.Tzourio-Mazoyer N, Landeau B, Papathanassiou D, et al. Automated anatomical labeling of activations in SPM using a macroscopic anatomical parcellation of the MNI MRI single-subject brain. Neuroimage 2002;15:273–289. [DOI] [PubMed] [Google Scholar]
- 20.Meltzer CC, Kinahan PE, Greer PJ, et al. Comparative evaluation of MR-based partial-volume correction schemes for PET. J Nucl Med 1999;40:2053–2065. [PubMed] [Google Scholar]
- 21.Shoukri MM, Colak D, Kaya N, Donner A. Comparison of two dependent within subject coefficients of variation to evaluate the reproducibility of measurement devices. BMC Med Res Methodol 2008;8:24. [DOI] [PMC free article] [PubMed] [Google Scholar]
- 22.Benjamini Y, Hochberg Y. Controlling the false discovery rate: practical and powerful approach to multiple testing. J R Stat Soc Series B Methodol 1995;57:289–300. [Google Scholar]
- 23.Song SK, Sun SW, Ramsbottom MJ, et al. Dysmyelination revealed through MRI as increased radial (but unchanged axial) diffusion of water. Neuroimage 2002;17:1429–1436. [DOI] [PubMed] [Google Scholar]
- 24.Wheeler-Kingshott CA, Cercignani M. About “axial” and “radial” diffusivities. Magn Reson Med 2009;61:1255–1260. [DOI] [PubMed] [Google Scholar]
- 25.Boccardi M, Sabattoli F, Laakso MP, et al. Frontotemporal dementia as a neural system disease. Neurobiol Aging 2005;26:37–44. [DOI] [PubMed] [Google Scholar]
- 26.Fukui T, Kertesz A. Volumetric study of lobar atrophy in Pick complex and Alzheimer's disease. J Neurol Sci 2000;174:111–121. [DOI] [PubMed] [Google Scholar]
- 27.Whitwell JL, Przybelski SA, Weigand SD, et al. Distinct anatomical subtypes of the behavioural variant of frontotemporal dementia: a cluster analysis study. Brain 2009;132:2932–2946. [DOI] [PMC free article] [PubMed] [Google Scholar]
- 28.Chan D, Fox NC, Scahill RI, et al. Patterns of temporal lobe atrophy in semantic dementia and Alzheimer's disease. Ann Neurol 2001;49:433–442. [PubMed] [Google Scholar]
- 29.Rohrer JD, Warren JD, Modat M, et al. Patterns of cortical thinning in the language variants of frontotemporal lobar degeneration. Neurology 2009;72:1562–1569. [DOI] [PMC free article] [PubMed] [Google Scholar]
- 30.Catani M, Jones DK, Donato R, Ffytche DH. Occipito-temporal connections in the human brain. Brain 2003;126:2093–2107. [DOI] [PubMed] [Google Scholar]
- 31.Catani M, Mesulam M. The arcuate fasciculus and the disconnection theme in language and aphasia: history and current state. Cortex 2008;44:953–961. [DOI] [PMC free article] [PubMed] [Google Scholar]
- 32.Mandonnet E, Nouet A, Gatignol P, et al. Does the left inferior longitudinal fasciculus play a role in language? A brain stimulation study. Brain 2007;130:623– 629. [DOI] [PubMed] [Google Scholar]
- 33.Duffau H, Gatignol P, Moritz-Gasser S, Mandonnet E. Is the left uncinate fasciculus essential for language? A cerebral stimulation study. J Neurol 2009;256:382–389. [DOI] [PubMed] [Google Scholar]
- 34.Catani M, Piccirilli M, Cherubini A, et al. Axonal injury within language network in primary progressive aphasia. Ann Neurol 2003;53:242–247. [DOI] [PubMed] [Google Scholar]
- 35.Makris N, Kennedy DN, McInerney S, et al. Segmentation of subcomponents within the superior longitudinal fascicle in humans: a quantitative, in vivo, DT-MRI study. Cereb Cortex 2005;15:854–869. [DOI] [PubMed] [Google Scholar]
- 36.Rosen HJ, Kramer JH, Gorno-Tempini ML, et al. Patterns of cerebral atrophy in primary progressive aphasia. Am J Geriatr Psychiatry 2002;10:89–97. [PubMed] [Google Scholar]
- 37.Gorno-Tempini ML, Dronkers NF, Rankin KP, et al. Cognition and anatomy in three variants of primary progressive aphasia. Ann Neurol 2004;55:335–346. [DOI] [PMC free article] [PubMed] [Google Scholar]
- 38.Borroni B, Garibotto V, Agosti C, et al. White matter changes in corticobasal degeneration syndrome and correlation with limb apraxia. Arch Neurol 2008;65:796–801. [DOI] [PubMed] [Google Scholar]
- 39.Erbetta A, Mandelli ML, Savoiardo M, et al. Diffusion tensor imaging shows different topographic involvement of the thalamus in progressive supranuclear palsy and corticobasal degeneration. AJNR 2009;30:1482–1487. [DOI] [PMC free article] [PubMed] [Google Scholar]
- 40.Seeley WW, Crawford RK, Zhou J, et al. Neurodegenerative diseases target large-scale human brain networks. Neuron 2009;62:42–52. [DOI] [PMC free article] [PubMed] [Google Scholar]
Associated Data
This section collects any data citations, data availability statements, or supplementary materials included in this article.