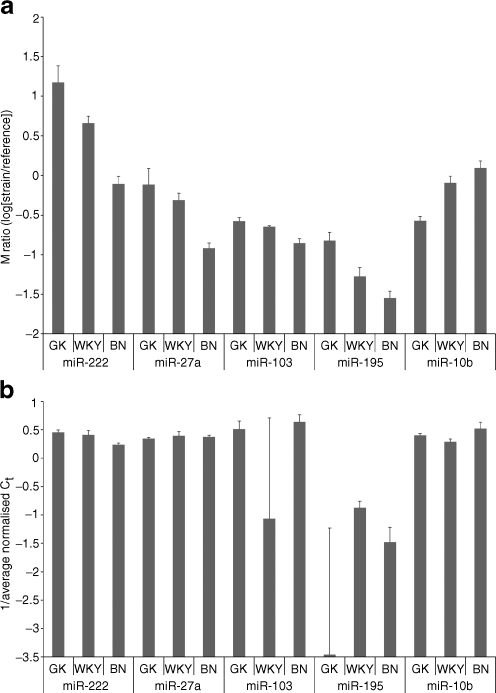
Fig. 4.
Signal intensity ratios between strains GK, WKY and BN for array data (a) and quantitative reverse transcriptase PCR (b) for miR-222 and miR-27a in adipose tissue, miR103 and miR-195 in liver and miR-10b in muscle. a Microarray log-ratio intensities for array data for each sample relative to the common reference. Positive values indicate higher expression in the experimental sample relative to the common reference, and vice versa for negative values. Error bars show the SE. The larger the mean log-ratio for a given strain, the more highly expressed the corresponding miRNA. b Expression of miRNAs detected using qRT-PCR. Data are presented as the inverse of the Ct score. Columns indicate expression relative to the control genes (snoRNA and 4.5S RNA) and error bars show the SE

