Abstract
Retinal nerve fiber layer (RNFL) thickness, a measure of glaucoma progression, can be measured in images acquired by spectral domain optical coherence tomography (OCT). The accuracy of RNFL thickness estimation, however, is affected by the quality of the OCT images. In this paper, a new parameter, signal deviation (SD), which is based on the standard deviation of the intensities in OCT images, is introduced for objective assessment of OCT image quality. Two other objective assessment parameters, signal to noise ratio (SNR) and signal strength (SS), are also calculated for each OCT image. The results of the objective assessment are compared with subjective assessment. In the subjective assessment, one OCT expert graded the image quality according to a three-level scale (good, fair, and poor). The OCT B-scan images of the retina from six subjects are evaluated by both objective and subjective assessment. From the comparison, we demonstrate that the objective assessment successfully differentiates between the acceptable quality images (good and fair images) and poor quality OCT images as graded by OCT experts. We evaluate the performance of the objective assessment under different quality assessment parameters and demonstrate that SD is the best at distinguishing between fair and good quality images. The accuracy of RNFL thickness estimation is improved significantly after poor quality OCT images are rejected by automated objective assessment using the SD, SNR, and SS.
Keywords: Retinal nerve fiber layer, glaucoma, optical coherence tomography, image assessment, image quality
1. INTRODUCTION
Glaucoma is the second leading cause of blindness in the world1. Glaucoma patients have progressive loss of retinal ganglion cells (RGC) that cause irreversible damage. Although surgical and pharmacological treatments are available, the detection of glaucoma at the early stage is the best way to control the disease. Retinal Nerve Fiber Layer (RNFL) thickness, denoted as Δz, can be used to obtain a measure of glaucoma progression since Δz gradually decreases with increased severity of visual field defects.
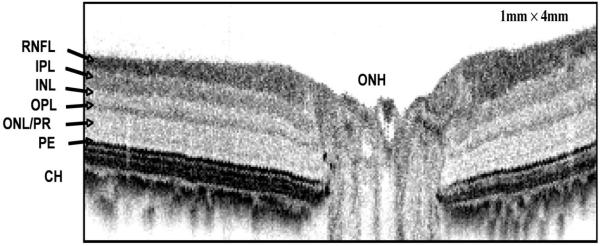
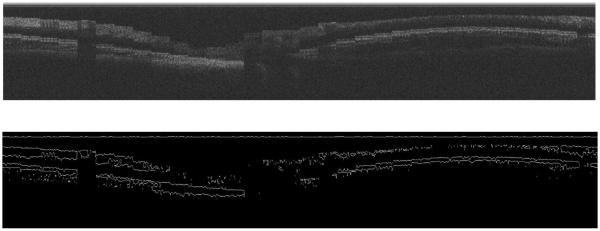
The difference in RNFL thickness between normal and glaucomatous eyes can be quantitatively measured by optical coherence tomography OCT. In order to measure the RNFL thickness in OCT images, the boundaries of the Retinal Nerve Fiber Layer (RNFL), the first layer as shown in figure 1, can be detected by edge detection algorithms. OCT image quality, however, varies among different subjects, and impacts the performance of edge detection algorithms. A poor quality image generates a poor edge detection result (Figure 2). In order to eliminate poor quality images from consideration, one approach is to assess the image quality before applying the edge detection algorithm. Most previous studies of OCT for glaucoma diagnosis use a subjective rating method or an objective assessment based on two parameters, signal to noise ratio (SNR) and signal strength (SS), for OCT image quality assessment 2,3,4. In this paper, we introduce a new parameter, signal deviation (SD) for objective assessment of OCT image quality. The new parameter SD is compared to SNR and SS in terms of their agreement with the subjective assessment of image quality.
Figure 1.
High resolution OCT image of in vivo primate retina demonstrating morphological features. Retinal nerve fiber layer (RNFL), ganglion cell layer (GCL), inner plexiform layer (IPL), inner nuclear layer (INL), outer plexiform layer (OPL), outer nuclear layer (onl/pr), pigment epithelium (PE), choroid (CH) and optic nerve head (ONH) are shown in this image. The system probes the eye to a depth of 1mm over a field 4mm wide.
Figure 2.
Edge detection results of a poor quality image. The top image is the original OCT intensity image. The bottom image is the result of the edge detection of the top image.
2. METHODS
2.1 Subjects and data collection
There were 6 healthy subjects (4 males and 2 female) enrolled in this study. All of the subjects gave informed consent. We collected 10 images of scans around the optic nerve head from the left eye of each subject by using the Spectral Domain Optical Coherence Tomography (OCT) system developed by the Biomedical Engineering Laser Laboratory at The University of Texas at Austin.
We used the OCT system to take 10 ring scans of the eye of the subjects around the optic nerve head (ONH) from the innermost ring to the outermost ring. Each ring scan is referred to as an OCT B scan and contains 3200 A-scans.
2.2 Image preprocessing
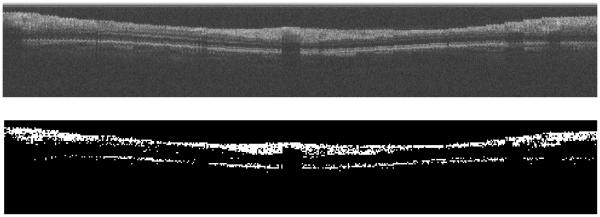
In order to find the location of the retina, an adaptive threshold is applied across the OCT image (Figure 4). The window for the local threshold selection is 60 by 60 pixels.
Figure 4.
The top panel is the original OCT image. The bottom panel is the binary mask from adaptive thresholding.
2.3 Objective assessment
2.3.1 Signal to noise ratio (SNR) and Signal strength (SS)
The signal to noise ratio of an OCT image is defined as the ratio of the energy of the object of interest, the signal, to the energy of the background. This ratio can be calculated using the following equation:
| (1), |
where
and Ns and Nn are the number of signal pixels and number of noise pixels, respectively. The signal strength (SS) is defined as the averaged intensity value of the signal pixels in the OCT image. We calculate SS by the following equation:
| (2), |
where Ns is the number of signal pixels in the binary image.
2.3.2 Signal deviation (SD)
We introduce a new parameter, which we refer to as the signal deviation, to characterize OCT images. In the OCT B scan image, each column is an A-scan. In a good quality OCT B scan image, the variation of the numbers of the signal pixels in each A-scan is small. The signal deviation (SD) is calculated as,
| (3), |
where NB is the total number of A-scans within one B scan, NAi is the number of signal pixels in each A scan, is the average number of signal pixels in each A-scan. Therefore, better quality images have lower SD values. The objective assessment is implemented using Labview 8.5 development system (National Instruments, Austin, Texas).
2.4 Subjective assessment
The environment of the subjective assessment is developed in MATLAB (The Mathworks, Natick, MA) using Psychophysics Toolbox extensions5,6. One expert, who was blinded to the results of the objective assessment, subjectively rated the OCT image quality. During the subjective assessment, different quality images were displayed randomly in a full screen model. The expert judged images and entered a score for each image based on a 3-level scale. Level 1 images are poor quality images. Level 2 images are fair quality images. Level 3 images are good quality images. The score of each image was compared with the results of the objective assessment.
2.5 Data Analysis
Results of the subjective assessment are used as reference for evaluating the new objective measures of image quality. All the objective image quality parameters were evaluated in terms of their ability to distinguish ability between good, fair, and poor image qualities. The agreement of the objective parameters and subjective assessment results were analyzed using kappa statistic.
3. RESULTS
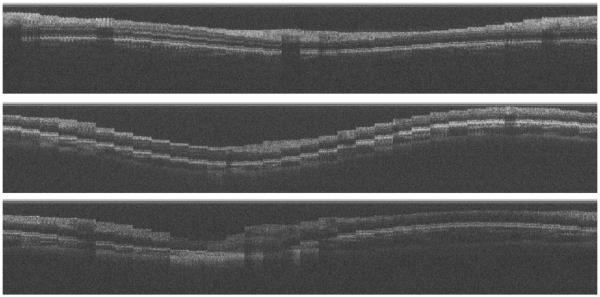
We analyzed 60 images from six subjects objectively assessed based on the SNR, SS, and SD parameters. From the subjective assessment, we determined that 36 / 60 images are good quality images, 11 / 60 images are fair quality images, and 13 / 60 images are poor quality images (Table 1). Using each of the three objective parameters, we obtained good separations between the rejected images (poor quality images) and acceptable images (good and fair quality images) (Figure 5, Table 2). The agreement between the objective and subjective assessment for classifying poor quality and acceptable quality images were good (Table 3). Note that the parameter SD provided a clearer separation between the good quality images and fair quality images (Table 4).
Table 1.
Results of the subjective assessment
| Image quality | Good | Fair | Poor |
|---|---|---|---|
| Number of images | 36(60%) | 11(18.3%) | 13(21.7%) |
Figure 5.
Example of good, fair, and poor quality OCT images. The top one is good quality image: SNR=6.61, SS=104.85, and SD=7.50. The middle one is fair quality image: SNR=5.69, SS=97.49, and SD=10.70. The bottom one is poor quality image SNR=4.01, SS=75.66, and SD=15.70.
Table 2.
Results of the objective assessment
| Image quality | Good | Fair | Poor |
|---|---|---|---|
| SNR | 5.98 | 4.82 | 3.90 |
| SS | 99.18 | 85.86 | 77.11 |
| SD | 9.10 | 11.29 | 13.47 |
Table 3.
Agreement of the objective assessment and subjective assessment for classifying poor and acceptable quality images
| Agreement between subjective and objective assessment (kappa) |
|
|---|---|
| SNR | 0.67 |
| SS | 0.63 |
| SD | 0.61 |
Table 4.
Agreement of the objective assessment and subjective assessment for classifying good and fair quality images
| Agreement between subjective and objective assessment (kappa) |
|
|---|---|
| SNR | 0.35 |
| SS | 0.49 |
| SD | 0.57 |
4. CONCLUSION
The proposed method for objective assessment of OCT image quality separates the poor quality images from the acceptable images. The new parameter SD can distinguish among the good quality images, fair quality images, and the poor quality images. The objective assessment of OCT image quality using SNR, SS, or SD is effective for automatically distinguishing different levels of OCT image quality. In the future work, more OCT images will be evaluated and we will develop a model to combine the objective assessment parameters SNR, SS, and SD.
Figure 3.
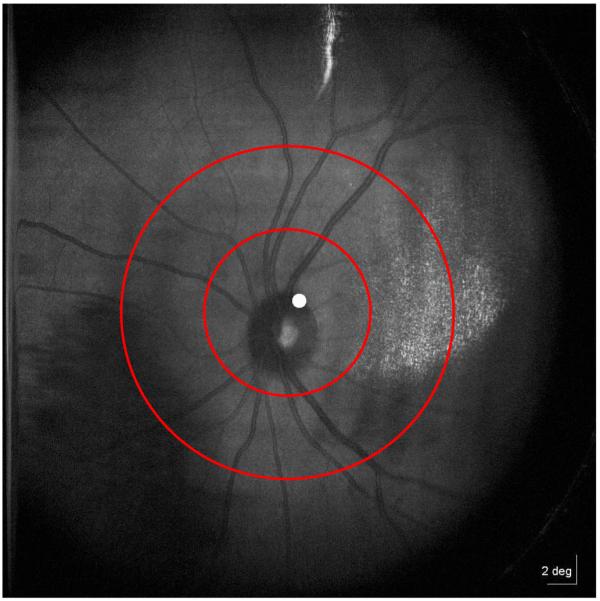
Line-scanning laser ophthalmoscope (LSLO) image of an eye. Spectral domain OCT system is used to take ring scans within the ring region between two red circles.
ACKNOWLEDGMENTS
This research is supported by the National Eye Institute.
REFERENCES
- [1].Quigley HA. Number of people with glaucoma worldwide. British Journal of Ophthalmology. 1996;80(5):389–393. doi: 10.1136/bjo.80.5.389. [DOI] [PMC free article] [PubMed] [Google Scholar]
- [2].Ginesu G, Massidda F, Giusto DD. A multi-factors approach for image quality assessment based on a human visual system model. Signal Processing: Image Communication. 2006;21:316–333. [Google Scholar]
- [3].Stein DM, Ishikawa H, Hariprasad R, Wollstein G, Noecker RJ, Fujimoto JG, Schuman JS. A new quality assessment parameter for optical coherence tomography. British Journal of Ophthalmology. 2006;90:186–190. doi: 10.1136/bjo.2004.059824. [DOI] [PMC free article] [PubMed] [Google Scholar]
- [4].Guedes V, Schuman JS, Hertzmark E, Wollstein G, Correnti A, Mancini R, Lederer D, Voskanian S, Velazquez L, Pakter HM, Pedut-Kloizman T, Fujimoto JG, Mattox C. Optical coherence tomography measurement of macular and nerve fiber layer thickness in normal and glaucomatous human eyes. Ophthalmology. 2003;110:177–89. doi: 10.1016/s0161-6420(02)01564-6. [DOI] [PMC free article] [PubMed] [Google Scholar]
- [5].Brainard DH. The Psychophysics Toolbox. Spatial Vision. 1997;10:433–436. [PubMed] [Google Scholar]
- [6].Pelli DG. The Video Toolbox software for visual psychophysics: Transforming numbers into movies. Spatial Vision. 1997;10:437–442. [PubMed] [Google Scholar]


