

Abstract
Background
Liver stiffness measurement is associated with portal hypertension in patients with chronic liver disease. However, the relationship between spleen stiffness and clinically significant portal hypertension remains unknown.
Aims
To determine the feasibility of measuring spleen stiffness with magnetic resonance (MR) elastography and to prospectively test this technique in healthy volunteers and patients with liver fibrosis.
Methods
Following Institutional Review Board approval, spleen stiffness was measured with MR elastography in 12 healthy volunteers (mean age, 37 years; age range, 25-82 years) and 38 patients with various etiologies of chronic liver disease (mean age, 56 years; age range, 36–60 years). Various statistical analyses were performed to assess all measurements.
Results
MR elastography of the spleen was successfully performed in all volunteers and patients. The mean spleen stiffness was significantly lower in volunteers (mean, 3.6 kPa ± 0.3) than it was in patients with liver fibrosis (mean, 5.6 kPa ± 5.0, range, 2.7–19.2 kPa; p < .001). In addition, a significant correlation between liver and spleen stiffness was observed for the entire cohort (r2=.75, p<0.001). Predictors of spleen stiffness were splenomegaly, spleen volume, and platelet count. In the setting of cirrhosis, the presence of esophageal varices was observed in 100% of patients with mean spleen stiffness values ≥ 10.5 kPa.
Conclusion
MR elastography of the spleen is feasible and shows promise as a quantitative method for predicting the presence of esophageal varices in patients with advanced hepatic fibrosis.
The development of portal hypertension in chronic liver disease is related to architectural changes from progressive hepatic fibrosis. This includes formation of regenerative nodules and intrahepatic shunting of arterial blood flow (1). Splenomegaly is also a common finding in patients with advanced hepatic fibrosis and portal hypertension (2). The relationship between splenomegaly and portal hypertension, however, remains poorly understood. In fact, studies to date have not identified a consistent relationship between spleen size and portal venous pressure (3-5). This is despite evidence for increased splenic red pulp blood volume from congestion with blood in affected patients (6). Notably, there are additional changes in spleen morphology noted among patients with cirrhosis including hyperplasia of splenic histiocytes (6), lengthening of arterial terminals (7), increased white pulp volume (8), and even fibrosis between splenic trabeculae (9). However, the in vivo significance of these alterations and their contribution to clinically significant portal hypertension remains unknown.
Recently, the ability to measure liver tissue elasticity (or stiffness) in vivo has been of great clinical relevance in the management of patients with chronic liver disease. Both ultrasound-based transient elastography (10) and magnetic resonance (MR) elastography (11-14) have demonstrated the ability to detect advanced hepatic fibrosis including occult cirrhosis based on liver stiffness measurement. Previous studies with ultrasound-based transient elastography (i.e. Fibroscan) have also demonstrated a systematic association between liver stiffness and portal hypertension measured by quantitative pressures measurements (15,16). In contrast, liver stiffness has been inconsistently associated with the formation of esophageal varices (17). Given the relationship between splenomegaly and esophageal varices in selected patients with cirrhosis, we hypothesized that spleen stiffness may have a unique association with esophageal varices given its anatomic relationship to the portal vein. Furthermore, it would be expected that spleen stiffness would increase with the development of cirrhosis and esophageal varices. Therefore, we sought to assess the feasibility of measuring spleen stiffness by MRE in human subjects with and without evidence of chronic liver disease including compensated cirrhosis.
Materials and Methods
Patient Population
The study was approved following review by the Institutional Review Board. Individual patients undergoing clinical evaluation and management for chronic liver disease at the Mayo Clinic and Foundation (Rochester, MN) between January 2005 and January 2007 were eligible for study participation. Inclusion criteria were 1) age ≥ 18 years, 2) percutaneous liver biopsy within 1 year of study enrollment and/or 3) a diagnosis of compensated cirrhosis supported by liver histology or compatible clinical and imaging criteria. Exclusion criteria were 1) history of hepatocellular carcinoma or cholangiocarcinoma, 2) history of prior liver resection or transplantation, and 3) absolute contraindications to MR examination including aneurysm clip, deep brain stimulator, metallic foreign bodies, cardiac pacemaker, implantable defibrillator, ventriculoperitoneal shunt, and vagal nerve stimulator. Recruitment was performed by a combination of prospective subject identification and recall of patients with recent liver biopsy and/or clinical evaluation within 12 months by contact letter.
Healthy individuals serving as normal controls were recruited prospectively on a volunteer basis. Inclusion criteria were 1) age ≥ 18 years, 2) no prior history of chronic liver disease, and 3) the presence of normal serum liver enzymes when tested on physical examination for employment purposes. Both verbal and written consent was obtained from all volunteers and patients after the nature of the procedure had been fully explained to them.
MR Elastography Technique
All MR elastography experiments were performed using a 1.5-T whole-body imager (Signa, GE Medical System) using the transmit/receive body coil (Figure 1).
Figure 1.

System for applying shear waves to the abdomen for MR elastography of the liver. Acoustic pressure waves (at 60 Hz) are generated by an active audio driver, located away from the magnetic field of the MR imaging unit, and transmitted via a flexible tube to a passive pneumatic driver placed over the anterior body wall. The left diagram is a coronal illustration of the location of the passive pneumatic driver (circle) with respect to the liver (adapted from Yin M, Talwalkar JA, Glaser KJ, Manduca A, Grimm RC, Rossman PJ, et al. Assessment of hepatic fibrosis with magnetic resonance elastography. Clin Gastroenterol Hepatol 2007;5:1207-13).
All volunteers and patients were imaged in the supine position with a 19-cm diameter, 1.5-cm–thick cylindric passive longitudinal shear wave driver placed against the anterior body wall. The driver was placed over the right lobe of the liver on the chest wall below the breast. Continuous longitudinal vibrations at 60 Hz were generated by varying acoustic pressure waves transmitted from an active driver device via a vinyl tube (2.5-cm inside diameter, 7.6-m length).
A 2-dimensional gradient echo MR elastography sequence was used to collect axial wave images with the following parameters: 60-Hz continuous sinusoidal vibration, field of view = 32–42 cm, matrix = 256 × 64, flip angle = 30°, slice thickness = 10 mm, repetition time/echo delay time = 50/23 ms, 4 evenly spaced phase offsets, and 1 pair of 60-Hz trapezoidal motion-encoding gradients with zeroth and first-moment nulling along the through-plane direction. Two spatial presaturation bands were applied on each side of the selected slice to reduce motion artifacts from blood flow. The total acquisition time was 40 seconds, split into 4 periods of suspended respiration. To obtain a consistent position of the liver and spleen for each phase offset, individual subjects were asked to hold their breath at the end of expiration (14,18,19).
Magnetic resonance elastograms
MR elastograms of the liver and spleen were obtained by processing the acquired images of propagating shear waves with a previously described local frequency estimation inversion algorithm (20). The local frequency estimation algorithm combines local estimates of instantaneous spatial frequency over several scales to provide robust estimates of stiffness. A Gaussian band-pass filter was applied to the original wave data to remove low-frequency wave information caused by longitudinal waves and bulk motion, and high-frequency noise. The cut-off frequencies of the band-pass filter were chosen carefully to be far away from the dominant spatial frequencies observed in the liver data. The high-end spatial frequency cut-off value is 1.25 cm−1, which corresponds to stiffness values of less than .5 kPa, whereas the low-end cut-off value is .08 cm−1, which corresponds to stiffness values greater than 100 kPa. Before applying the local frequency estimation inversion algorithm, we used 8 motion direction filters evenly spaced between 0° and 360° and combined in a weighted least-square method to improve the performance of the algorithm because complex interference of shear waves from all directions might produce areas with low-shear displacement amplitude. All of these steps in processing were applied automatically, without human intervention, to yield quantitative images of tissue shear stiffness, in units of kilopascals. We have used the designation shear stiffness, rather than shear modulus to indicate that the measurements may include a viscous component, although this is likely to be very small at the low driving frequency used. The elastograms were analyzed by measuring mean shear stiffness within a large, manually specified region of interest that included an entire cross-sectional image of hepatic parenchyma (excluding major blood vessels such as hepatic veins, main portal veins, and branches that have a width greater than 8 mm) or spleen. MR elastography interpretation was performed in a blinded fashion without knowledge of clinical information for all patients.
Data Collection
The abstraction of relevant demographic and clinical information from electronic medical record systems was performed for all subjects by one investigator (J.A.T.). Variables of interest for patients with chronic liver disease included age; sex; body mass index; etiology of chronic liver disease; presence or absence of compensated cirrhosis by clinical criteria; laboratory tests including serum platelet and leukocyte count; presence or absence of splenomegaly (defined by craniocaudal length ≥ 12 cm measured by ultrasound); spleen volume (cm3) by MRI; presence or absence of esophageal varices; fibrosis stage on liver histology assessed by accepted techniques (21-23); mean liver stiffness measurement by MRE; and mean spleen stiffness measurement by MRE. The method used for calculating spleen volume used linear interpolation to identify 2.5 mm slices from available images. The area for each slice was determined manually, excluding large arteries and veins seen on anatomic images. Volume was then calculated as the summation of all slice volume areas. For healthy volunteers, the variables age, sex, body mass index, mean liver stiffness measurement, and mean spleen stiffness measurement were recorded.
Statistical Analysis
Continuous variables were expressed as mean (standard deviation) or medians, where appropriate. Categorical variables were expressed as a proportion or percentage. Mean spleen stiffness values were compared between patients and healthy volunteers using a Kruskal-Wallis test followed by a nonparametric Dunnett's test with control. Comparisons between mean spleen stiffness values for patients with mild fibrosis (F0-1-2) and those with severe fibrosis (F3-4) were also performed using the same methods. The correlation between the mean spleen and mean liver shear stiffness values was assessed using Spearman's correlation coefficient technique. Univariate logistic regression analysis was performed to identify predictors of spleen stiffness and esophageal varices. All statistical analyses were performed with the software JMP 6.0 (Statistical Discovery ™ From SAS Institute, Cary, NC, USA).
Results
Feasibility of in vivo Spleen Stiffness Measurement in Healthy Volunteers
Twelve healthy volunteers were recruited for this study. The mean age was 37 years (range: 25 – 82 years) with 25% women. Excellent shear wave illumination was seen throughout the liver and spleen in all subjects_(Figure 2). Calculation of mean spleen stiffness was possible in all subjects. The mean spleen stiffness value for healthy individuals was 3.6 ± 0.3 kPa.
Figure 2.
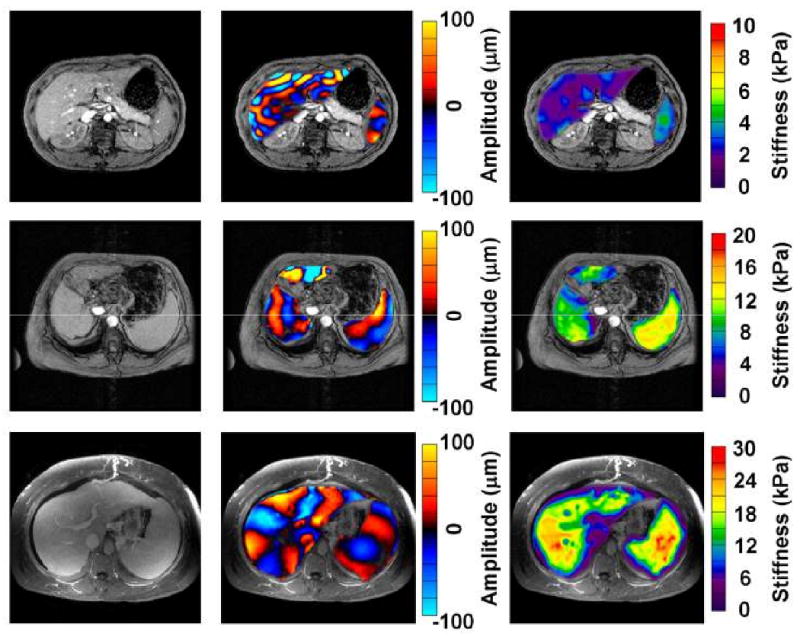
MR elastography of the liver and spleen in a normal volunteer and two patients with cirrhosis. Anatomic images are shown in the far left column. The middle column of images shows wave image data in the liver and spleen, superimposed on the corresponding anatomic images. The resulting elastograms are shown in the far right column. The wave images show that the shear wavelength for both liver and spleen was higher in the patients with cirrhosis (rows 2 and 3) in contrast to the normal volunteer (row 1). The elastograms show that the mean spleen stiffness of the fibrotic livers was much higher than that of the normal liver (11.5 ± 1.1 kPa and 19.6 ± 3.3 kPa vs 3.6 ± 0.4 kPa, respectively). Mean liver stiffness is also higher in the patients with cirrhosis (8.3 ± 1.5 kPa and 18.9 ± 2.9 kPa than that of the normal volunteer (2.1± 0.3 kPa).
Feasibility of in vivo Spleen Stiffness Measurement in Patients with CLD
Thirty-eight patients with chronic liver disease consented to undergo MR elastography. The mean age of this group was 56 years (range, 21 to 75) with 50 % women. The mean BMI for all subjects was 29.7 ± 5.5 kg/m2. Major etiologies of chronic liver disease included chronic hepatitis C (20%), nonalcoholic fatty liver disease (20%), alcoholic liver disease (11%), autoimmune hepatitis (11%), and primary biliary cirrhosis (11%). The histological stage of fibrosis was noted as 0 (32%) I (5%), II (5%) III (13%), and IV (45%). The average Model for End-Stage Liver Disease (MELD) score for all patients was 6 (range, 6-7).
Excellent shear wave illumination throughout the liver and spleen in all subjects (100%) who were examined (Figure 2). Calculation of mean spleen stiffness was possible in all subjects. For the entire group of patients with varying degrees of chronic liver disease, the mean spleen stiffness value was 5.6 kPa ± 5.0 (range, 2.7–19.2 kPa). The difference in mean spleen stiffness between patients with chronic liver disease and healthy individuals was statistically significant (p<0.001).
Relationship between Mean Spleen and Liver Stiffness Values
When assessed by stage of fibrosis, the mean spleen stiffness value also increased systematically (p=0.0007) in patients with chronic liver disease (6.0 kPa for stage 0, 4.4 kPa for stage I, 5.4 kPa for stage II, 9.0 kPa for stage III, and 10.5 kPa for stage IV). For both healthy individuals and patients with liver disease, a significant linear correlation between mean liver and spleen stiffness values was observed (Figure 3) (r2 = 0.75, p< 0.001). Higher spleen stiffness values were also noted for patients with cirrhosis and collateral splenic varices (n=7) compared to patients with cirrhosis and no collateral splenic varices (n=10) (11.2 kPa vs. 9.9 kPa, p=0.2). There was no significant correlation between mean liver or spleen stiffness values with age, sex, and BMI in both patient subgroups.
Figure 3.

Significant correlation between mean liver and mean spleen stiffness values was observed among healthy volunteers and patients with varying degrees of chronic liver disease. (r2 = 0.75, p< 0.001).
Association between Mean Spleen Stiffness Value and Esophageal Varices in Patients with Compensated Cirrhosis
Among patients with histological and/or clinical evidence for compensated cirrhosis (n=17), the mean liver stiffness value in this patient subgroup was 8.1 ± 2.3 kPa (range, 3.6-12.0 kPa). The frequency of splenomegaly was 65% and the mean spleen volume in these subjects was 518 ± 302/cm3 (range, 196-1236 cm3). The mean serum platelet count was 135,000/mm3 and nine patients (53%) with cirrhosis had serum platelet counts below 140,000/mm3. All 17 patients with cirrhosis underwent diagnostic esophagogastroduodenoscopy (EGD) prior to MRE with esophageal varices noted in seven (41%) of the 17 patients. Small esophageal varices were observed in 5 patients, while large esophageal varices were detected in 2 patients. The average number of time between EGD and MRE was 10 months (range, 1 day-37 months).
The mean spleen stiffness value for patients with compensated cirrhosis and esophageal varices was 12.6 ± 2.0 kPa. Univariate analysis identified splenomegaly (p=0.003), mean spleen stiffness (p=0.03), and serum platelet count (p=0.05) as potential variables associated with the presence of esophageal varices. There was no observed association between mean liver stiffness value (p=0.63) or mean spleen volume (p=0.14) and the presence of esophageal varices. Of note, the frequency of esophageal varices in patients with cirrhosis and a mean spleen stiffness ≥ 10.5 kPa was 100%.
Discussion
In this preliminary study, we have demonstrated the feasibility of measuring in vivo spleen stiffness by MR elastography in patients with chronic liver disease as well as healthy individuals. In addition to observing that spleen stiffness increases with higher degrees of hepatic fibrosis, we also noted a strong linear relationship between liver and spleen stiffness values in the entire cohort. Furthermore, a preliminary observation suggested that a mean spleen stiffness value ≥10.5 kPa with compensated cirrhosis was associated with esophageal varices in 100% of cases
The anatomy and microcirculation of the spleen is well-characterized (7, 24). Splenic tissue is comprised primarily of red pulp tissue with lesser degrees of white pulp. Within the red pulp, blood is received by the penicillar arterioles which then open directly into venous sinuses and trabecular veins. Blood then exits via the splenic vein into the splanchnic venous circulation. White pulp is comprised of a central artery surrounded by lymphoid tissue. Penicillar arterioles originate form the central arteries outside the white pulp and drain into venous sinuses and the red pulp. In this study, healthy individuals were observed to have a consistently narrow range of spleen stiffness values. Spleen stiffness was unrelated to age, sex, or body mass index. It could be expected that spleen stiffness in normal adults retains its elasticity throughout life, as is observed with spleen volume when measured by cross-sectional imaging techniques (25-27). However, the effect of normal tissue architecture on dynamic or elastic properties of splenic tissue over time remains unknown.
For patients with chronic liver disease, a greater mean spleen stiffness value was observed compared to healthy individuals. Furthermore, the mean spleen stiffness was observed to be significantly increased as the degree of hepatic fibrosis also increased. the greatest values were seen among patients with histological stages III and IV hepatic fibrosis. In chronic liver disease, the spleen undergoes architectural and dynamic circulatory alterations including pulp hyperplasia, congestion from increased blood flow, and even fibrosis (6-10,24). This has led to hypotheses implicating portal venous hypertension as a cause of these morphologic changes observed in with cirrhosis. Studies to date suggest that portal venous pressure remains within physiological values until architectural changes from bridging (or stage 3) fibrosis ensues (28). Whether local alterations in splenic hemodynamics preceding the development of clinically significant portal hypertension are responsible for increased spleen stiffness remains speculative at this point.
Despite the association between splenomegaly and portal hypertension, previous studies have failed to demonstrate a consistent relationship between splenomegaly and quantitative portal venous pressure measurement (2-5). Mean splenic blood flow by Doppler ultrasound (5,29) has not correlated with portal venous pressure. Furthermore, an inverse relationship between splenic arterial blood flow and hepatic venous pressure gradient (HVPG) using CT imaging is reported (30). The finding of increased splenic blood flow supports the hypothesis, however, that splenic hemodynamics are not characterized only by passive congestion alone (24,31). Increased phagocytic cell mass within the spleen, which corresponds with volumetric growth in patients with chronic liver disease, may also play a role in determining tissue stiffness (32).
The relationship between liver stiffness measurement by ultrasound-based transient elastography and clinically significant portal hypertension assessed by HVPG has been reported (15,16,33). A strong relationship between HVPG < 10 mm Hg and liver stiffness consistent with mild to moderate degrees of liver fibrosis (15,16). However, there has been a less than robust correlation between liver stiffness value and the presence of esophageal varices in patients with cirrhosis (17). Similarly, our preliminary results did not identify a significant relationship between mean liver stiffness value and esophageal varices. In contrast, we did observe a statistically significant relationship between mean spleen stiffness and the presence of esophageal varices. With a mean spleen stiffness values ≥ 10.5 kPa, we also noted a detection rate of 100%. for esophageal varices in patients with compensated cirrhosis This observation remained independent of serum platelet count including values < 140,000/mm3 which is known to have modest ability for predicting esophageal varices (34). While liver stiffness measurement appears to capture the effect of elevated intrahepatic vascular resistance from advanced fibrosis (35), it is possible that spleen stiffness provides additional information about the hemodynamic alterations within splenic and splanchnic arterial circulations as portal venous pressure increases over time.
Our study was recognized to have some limitations. Mean liver and spleen stiffness measurements were performed in 2-dimensions using cross-sectional images in all subjects. Greater accuracy in tissue stiffness measurement may be possible with the availability of 3-dimensonal wave analysis in MRE which is awaited. The correlation between mean spleen stiffness and portal venous pressure measurement by HVPG was not performed in this preliminary study. Based on preliminary results suggesting a relationship between spleen stiffness and esophageal varices, the measurement of HVGP and comparison with spleen and liver stiffness is being pursued. Finally, our results concerning the predictive ability of mean spleen stiffness for detecting esophageal varices in patients with compensated cirrhosis remains preliminary. In turn, we did not examine the performance of other non-invasive detection methods for esophageal varices such as platelet count/spleen diameter ratio which has some evidence of external validity among independent populations (36).
In conclusion, our results demonstrate the feasibility of spleen stiffness measurement in healthy individuals and patients with chronic liver disease with MRE. Among patients with advanced fibrosis and compensated cirrhosis, mean spleen stiffness could serve a potential role to improve the appropriate selection of patients for endoscopic screening to detect esophageal varices. Further studies, however, are needed to define the feasibility and diagnostic performance of mean spleen stiffness measurement in clinical practice.
Abbreviations
- MRE
magnetic resonance elastography
- kPa
kiloPascal
- BMI
body mass index
- MELD
Model for End Stage Liver Disease
- EGD
esophagogastroduodenoscopy
References
- 1.Groszmann RJ, Abraldes JG. Portal hypertension: from bedside to bench. J Clin Gastroenterol. 2005;39(4 Suppl 2):S125–30. doi: 10.1097/01.mcg.0000155552.14396.3d. [DOI] [PubMed] [Google Scholar]
- 2.Gibson PR, Gibson RN, Ditchfield MR, Donlan JD. Splenomegaly--an insensitive sign of portal hypertension. Aust N Z J Med. 1990;20:771–4. doi: 10.1111/j.1445-5994.1990.tb00421.x. [DOI] [PubMed] [Google Scholar]
- 3.Merkel C, Gatta A, Arnaboldi L, Zuin R. Splenic haemodynamics and portal hypertension in patients with liver cirrhosis and spleen enlargement. Clin Physiol. 1985:5531–9. doi: 10.1111/j.1475-097x.1985.tb00766.x. [DOI] [PubMed] [Google Scholar]
- 4.Sheth SG, Amarapurkar DN, Chopra KB, Mani SA, Mehta PJ. Evaluation of splenomegaly in portal hypertension. J Clin Gastroenterol. 1996;22:28–30. doi: 10.1097/00004836-199601000-00008. [DOI] [PubMed] [Google Scholar]
- 5.Shah SH, Hayes PC, Allan PL, Nicoll J, Finlayson ND. Measurement of spleen size and its relation to hypersplenism and portal hemodynamics in portal hypertension due to hepatic cirrhosis. Am J Gastroenterol. 1996;91:2580–3. [PubMed] [Google Scholar]
- 6.Manenti A, Botticelli A, Gibertini G, Botticelli L. Experimental congestive splenomegaly: histological observations in the rat. Pathologica. 1993;85:721–4. [PubMed] [Google Scholar]
- 7.Cavalli G, Re G, Casali AM. Red pulp arterial terminals in congestive splenomegaly. A morphometric study. Pathol Res Pract. 1984;178:590–4. doi: 10.1016/S0344-0338(84)80092-8. [DOI] [PubMed] [Google Scholar]
- 8.Re G, Casali AM, Cavalli D, Guida G, Cau R, Cavalli G. Histometric analysis of white pulp arterial vessels in congestive splenomegaly. Appl Pathol. 1986;4:98–103. [PubMed] [Google Scholar]
- 9.Terayama N, Makimoto KP, Kobayashi S, Nakanuma Y, Sasaki M, Saito K, Katayanagi K. Pathology of the spleen in primary biliary cirrhosis: an autopsy study. Pathol Int. 1994;44:753–8. doi: 10.1111/j.1440-1827.1994.tb02922.x. [DOI] [PubMed] [Google Scholar]
- 10.Talwalkar JA, Kurtz DM, Schoenleber SJ, West CP, Montori VM. Ultrasound-based transient elastography for the detection of hepatic fibrosis: systematic review and meta-analysis. Clin Gastroenterol Hepatol. 2007;5:1214–20. doi: 10.1016/j.cgh.2007.07.020. [DOI] [PubMed] [Google Scholar]
- 11.Rouviere O, Yin M, Dresner MA, Rossman PJ, Burgart LJ, Fidler JL, Ehman RL. MR elastography of the liver: preliminary results. Radiology. 2006;240:440–8. doi: 10.1148/radiol.2402050606. [DOI] [PubMed] [Google Scholar]
- 12.Huwart L, Peeters F, Sinkus R, Annet L, Salameh N, ter Beek LC, Horsmans Y, Van Beers BE. Liver fibrosis: non-invasive assessment with MR elastography. NMR Biomed. 2006;19:173–9. doi: 10.1002/nbm.1030. [DOI] [PubMed] [Google Scholar]
- 13.Klatt D, Asbach P, Rump J, Papazoglou S, Somasundaram R, Modrow J, Braun J, Sack I. In vivo determination of hepatic stiffness using steady-state free precession magnetic resonance elastography. Invest Radiol. 2006;41:841–8. doi: 10.1097/01.rli.0000244341.16372.08. [DOI] [PubMed] [Google Scholar]
- 14.Yin M, Talwalkar JA, Glaser KJ, Manduca A, Grimm RC, Rossman PJ, et al. Assessment of hepatic fibrosis with magnetic resonance elastography. Clin Gastroenterol Hepatol. 2007;5:1207–13. doi: 10.1016/j.cgh.2007.06.012. [DOI] [PMC free article] [PubMed] [Google Scholar]
- 15.Vizzutti F, Arena U, Romanelli RG, Rega L, Foschi M, Colagrande S, Petrarca A, Moscarella S, Belli G, Zignego AL, Marra F, Laffi G, Pinzani M. Liver stiffness measurement predicts severe portal hypertension in patients with HCV-related cirrhosis. Hepatology. 2007;45:1290–7. doi: 10.1002/hep.21665. [DOI] [PubMed] [Google Scholar]
- 16.Bureau C, Metivier S, Peron JM, Selves J, Robic MA, Gourraud PA, Rouquet O, Dupuis E, Alric L, Vinel JP. Transient elastography accurately predicts presence of significant portal hypertension in patients with chronic liver disease. Aliment Pharmacol Ther. 2008;27:1261–8. doi: 10.1111/j.1365-2036.2008.03701.x. [DOI] [PubMed] [Google Scholar]
- 17.Kazemi F, Kettaneh A, N'kontchou G, Pinto E, Ganne-Carrie N, Trinchet JC, Beaugrand M. Liver stiffness measurement selects patients with cirrhosis at risk of bearing large oesophageal varices. J Hepatol. 2006;45:230–5. doi: 10.1016/j.jhep.2006.04.006. [DOI] [PubMed] [Google Scholar]
- 18.Muthupillai R, Lomas DJ, Rossman PJ, Greenleaf JF, Manduca A, Ehman RL. Magnetic resonance elastography by direct visualization of propagating acoustic strain waves. Science. 1995;269:1854–1857. doi: 10.1126/science.7569924. [DOI] [PubMed] [Google Scholar]
- 19.Kruse SA, Smith JA, Lawrence AJ, et al. Tissue characterization using magnetic resonance elastography: preliminary results. Phys Med Biol. 2000;45:1579–1590. doi: 10.1088/0031-9155/45/6/313. [DOI] [PubMed] [Google Scholar]
- 20.Manduca A, Oliphant TE, Dresner MA, Mahowald JL, Kruse SA, Amromin E, et al. Magnetic resonance elastography: non-invasive mapping of tissue elasticity. Med Image Anal. 2001;5:237–254. doi: 10.1016/s1361-8415(00)00039-6. [DOI] [PubMed] [Google Scholar]
- 21.The French METAVIR Cooperative Study Group. Intraobserver and interobserver variations in liver biopsy interpretation in patients with chronic hepatitis C. Hepatology. 1994;20(1 Pt 1):15–20. [PubMed] [Google Scholar]
- 22.Brunt EM, Janney CG, Di Bisceglie AM, Neuschwander-Tetri BA, Bacon BR. Nonalcoholic steatohepatitis: a proposal for grading and staging the histological lesions. Am J Gastroenterol. 1999;94:2467–74. doi: 10.1111/j.1572-0241.1999.01377.x. [DOI] [PubMed] [Google Scholar]
- 23.Batts KP, Ludwig J. Chronic hepatitis. An update on terminology and reporting. Am J Surg Pathol. 1995;19:1409–17. doi: 10.1097/00000478-199512000-00007. [DOI] [PubMed] [Google Scholar]
- 24.Bolognesi M, Merkel C, Sacerdoti D, Nava V, Gatta A. Role of spleen enlargement in cirrhosis with portal hypertension. Dig Liver Dis. 2002;34:144–50. doi: 10.1016/s1590-8658(02)80246-8. [DOI] [PubMed] [Google Scholar]
- 25.Meier JM, Alavi A, Iruvuri S, Alzeair S, Parker R, Houseni M, Hernandez-Pampaloni M, Mong A, Torigian DA. Assessment of age-related changes in abdominal organ structure and function with computed tomography and positron emission tomography. Semin Nucl Med. 2007;37:154–72. doi: 10.1053/j.semnuclmed.2007.02.001. [DOI] [PubMed] [Google Scholar]
- 26.Geraghty EM, Boone JM, McGahan JP, Jain K. Normal organ volume assessment from abdominal CT. Abdom Imaging. 2004;29:482–90. doi: 10.1007/s00261-003-0139-2. [DOI] [PubMed] [Google Scholar]
- 27.Prassopoulos P, Daskalogiannaki M, Raissaki M, Hatjidakis A, Gourtsoyiannis N. Determination of normal splenic volume on computed tomography in relation to age, gender and body habitus. Eur Radiol. 1997;7:246–8. doi: 10.1007/s003300050145. [DOI] [PubMed] [Google Scholar]
- 28.Nagula S, Jain D, Groszmann RJ, Garcia-Tsao G. Histological-hemodynamic correlation in cirrhosis-a histological classification of the severity of cirrhosis. J Hepatol. 2006;44:111–7. doi: 10.1016/j.jhep.2005.07.036. [DOI] [PubMed] [Google Scholar]
- 29.Choi YJ, Baik SK, Park DH, Kim MY, Kim HS, Lee DK, Kwon SO, Kim YJ, Park JW. Comparison of Doppler ultrasonography and the hepatic venous pressure gradient in assessing portal hypertension in liver cirrhosis. J Gastroenterol Hepatol. 2003;18:424–9. doi: 10.1046/j.1440-1746.2003.02992.x. [DOI] [PubMed] [Google Scholar]
- 30.Tsushima Y, Koizumi J, Yokoyama H, Takeda A, Kusano S. Evaluation of portal pressure by splenic perfusion measurement using dynamic CT. AJR Am J Roentgenol. 1998;170:153–5. doi: 10.2214/ajr.170.1.9423623. [DOI] [PubMed] [Google Scholar]
- 31.Luca A, Miraglia R, Caruso S, Milazzo M, Gidelli B, Bosch J. Effects of splenic artery occlusion on portal pressure in patients with cirrhosis and portal hypertension. Liver Transpl. 2006;12:1237–43. doi: 10.1002/lt.20762. [DOI] [PubMed] [Google Scholar]
- 32.Hoefs JC, Wang FW, Lilien DL, Walker B, Kanel G. A novel, simple method of functional spleen volume calculation by liver-spleen scan. J Nucl Med. 1999;40:1745–55. [PubMed] [Google Scholar]
- 33.Carrion JA, Navasa M, Bosch J, Bruguera M, Gilabert R, Forns X. Transient elastography for diagnosis of advanced fibrosis and portal hypertension in patients with hepatitis C recurrence after liver transplantation. Liver Transpl. 2006;12:1791–8. doi: 10.1002/lt.20857. [DOI] [PubMed] [Google Scholar]
- 34.Schepis F, Camma C, Niceforo D, Magnano A, Pallio S, Cinquegrani M, D'amico G, Pasta L, Craxi A, Saitta A, Raimondo G. Which patients with cirrhosis should undergo endoscopic screening for esophageal varices detection? Hepatology. 2001;33:333–8. doi: 10.1053/jhep.2001.21410. [DOI] [PubMed] [Google Scholar]
- 35.Lim JK, Groszmann RJ. Transient elastography for diagnosis of portal hypertension in liver cirrhosis: is there still a role for hepatic venous pressure gradient measurement? Hepatology. 2007;45:1087–90. doi: 10.1002/hep.21731. [DOI] [PubMed] [Google Scholar]
- 36.Giannini EG, Zaman A, Kreil A, Floreani A, Dulbecco P, Testa E, Sohaey R, Verhey P, Peck-Radosavljevic M, Mansi C, Savarino V, Testa R. Platelet count/spleen diameter ratio for the noninvasive diagnosis of esophageal varices: results of a multicenter, prospective, validation study. Am J Gastroenterol. 2006;101:2511–9. doi: 10.1111/j.1572-0241.2006.00874.x. [DOI] [PubMed] [Google Scholar]