

Abstract
Multidrug resistance is a major impediment to the success of cancer chemotherapy. The overproduced P-glycoprotein that extrudes anticancer drugs from cells, is the most common mechanism detected in multidrug-resistant cancers. Direct measurement of cellular efflux of tumors in vivo, rather than estimation of MDR1 mRNA and P-glycoprotein levels in samples stored or embedded, can functionally characterize the mechanism of drug resistance and determine the choice of anticancer drugs for cancer patients. Herewith, we introduce a new approach to directly determine P-glycoprotein efflux of tumors. Employing Flutax-2 (Oregon green-488 paclitaxel) and fluorescence spectrophotometry, this method has successfully measured cellular transportability including efflux and accumulation in diverse cancer cell lines, tumors and other tissues with high reproducibility. With this method, we have quantitatively determined cellular efflux that is correlated with P-glycoprotein levels and the reversal effects of agents in cell lines of breast, ovarian, cervical and colon cancers, and in tumor-bearing mice. It has sensitively detected these alterations of P-glycoprotein efflux in approximately 5 mg tumor or other tissues with high confidence. This direct and quick functional assessment has a potential to determine drug resistance in different types of cancers after surgical resection. Further validation of this method in clinic settings for the diagnosis of drug resistance purpose is needed.
Supplementary key words: drug resistance, paclitaxel, efflux, accumulation, P-glycoprotein, fluorescence, cancer
1. Introduction
Multidrug resistance (MDR) of cancer cells continues to be a major impediment to a successful chemotherapy in cancer patients. Inherited or acquired MDR defects the therapeutic efficacies of anticancer drugs and furthermore cancer cells hibernate for recurrence [1-3]. MDR severely limits chemotherapy success in any type of advanced malignancy, particularly in solid cancers [2, 3]. MDR is an outcome of sophisticated cellular processes involved drug transport, detoxification, proliferation arrest, apoptosis and interaction with microenvironment. Mutants of p53 and elevated levels of Bcl-2, Her2 and glucosylceramide synthase (GCS) contribute cellular resistance for varies of cancers [4-6]. Among these mechanisms underlying drug resistance, the alteration of cellular transportability including uptake and efflux is an essential step for cancer cells eliminating chemotherapy toxins. Efflux of drugs, due to the overexpression of ATP-binding cassette transporters (ABC-transporters) has been found in almost all cancers displaying drug resistance [5, 7, 8]. These ABC-transporters are located on plasma membrane and extrude xenobiotic substances including cytotoxic drugs [5, 7, 9]. The transporters mainly involved in the mediation of clinical drug resistance are MDR protein 1 (MDR1, ABCB1, or P-glycoprotein, P-gp), MDR-related protein 1 (MRP1, ABCC1) and breast cancer resistance protein (BCRP, ABCG2) [10, 11]. The overexpression of MDR1 that encodes a large amount of P-glycoprotein 170 (P-gp) and extrudes anticancer drugs from cells, is the most common mechanism detected in MDR cancers [5, 10]. MDR1, MRP1 and BCRP all exhibit substrate “polyspecificity” and lead cell resistance to hundreds of structurally diverse agents. Overexpression of these transporters in cancers substantially defects therapeutic efficacies of agents mainly categorized into anthracyclines, taxanes, Vinca alkaloids, anthracenestaxotes and tyrosine kinase inhibitors including genitinib and imatinib mesylate [11].
Determining the resistance mechanism, once cancer is diagnosed, is a critical step to improve chemotherapy for patients. It can predict patient responsiveness to anticancer drugs and lead to choice of more rational treatment regimens [12]. Employing more efficient anticancer drugs, instead of potential resistant ones, can eliminate tumors with minimal side effects in cancer patients [13, 14]. Chemotherapy sensitivity and resistance assays (CSRAs) offer the potential of selecting cancer treatments based on responsiveness of individual tumor measured in vitro [15, 16]. Extreme drug resistance assay (EDR) that tests the sensitivity of isolated cancer cells exposed to extreme high concentrations of a panel of drugs for a long period of time has been used to identify regimens for cancer patients [15-18]. The in-vitro culture conditions limit EDR assay in evaluation of factors that exist in the patient and affect chemo-responsiveness, such as drug bioavailability and drug metabolism [19]. Use of CSRAs including EDR to select chemotherapeutic agents for individual is promising, but current evidence from patients do not support to recommend it outside of the clinical trial setting [12, 15, 16].
Characterizing cancer resistance in alteration of cellular transportability, such as increased efflux due to MDR1 overexpression and decreased accumulation, is needed in clinical setting [13, 18, 20]. Employing quantitative RT-PCR, microarray and immunohistochemistry assays can sensitively assess the expression levels of MDR1 [21-25]. However, due to polymorphisms, N-linked glycosylation and hyperphosphorylation frequently occur in P-gp and others, the expression levels of these transporters always are not consistent with cellular effluxing [26-29]. Several approaches have been developed to evaluate the function of P-gp efflux [13, 30, 31]. 99mTc-methoxyisobutylisonitrile (99mTc-MIBI), as a substrate recognized by ABC transporters, has been applied in in-vivo imaging to predict response to chemotherapy in patients with lung cancer [13, 32]. This functional assay can successfully identify 94% responders to chemotherapy in lung cancer, even through it needs in vivo injection of the 99mTc-MIBI and expensive equipment [13].
In the present study, we report a direct and reliable method to determine cellular efflux of P-gp to assess individual cancer responsiveness to chemotherapy. This method can be employed to quickly identify cellular efflux and accumulation of tumors after surgery.
2. Materials and methods
2.1 Cell culture and treatments
Drug resistant NCI/ADR-RES and drug-sensitive MCF-7 human breast cancer cells were kindly provided by Dr. Kenneth Cowan (UNMC Eppley Cancer Center, Omaha, NE) and Dr. Merrill Goldsmith (National Cancer Institute, Bethesda, MD) [33]. Drug resistant A2780-AD human ovarian cancer cell line and its drug-sensitive counterpart A-2780 [34] were kindly provided by Dr. Thomas C. Hamilton (Fox Chase Cancer Center, Philadelphia, PA). Drug-sensitive KB-3-1 human cervical carcinoma cell line and its resistant KB-A1 subline [35] were provided by Dr. Michael M. Gottesman (National Cancer Institute). The SW620 human colon cancer cell line and the doxorubicin-selected SW620AD cells [36] were kindly provided by Drs. Susan Bates and Antonio Fojo (National Cancer Institute). All cell lines were cultured in RPMI-1640 medium containing 10% fetus bovine serum (FBS), 100 units/ml penicillin, 100 μg/ml streptomycin and 584 mg/liter L-glutamine. Cells were maintained in an incubator humidified with 95% air and 5 % CO2 at 37 °C. FBS was purchased from Thermo Scientific (HyClone, Waltham, MA), and RPMI-1640 medium and other supplements were purchased from Invitrogen (Carlsbad, CA).
For MBO-asGCS (mixed backbone oligonucleotide against glucosylceramide synthase) treatment, NCI/ADR-RES cells (2 × 10⁶ cells/100-mm dish) were growth in 10% FBS RPMI-1640 medium overnight and increasing concentrations of MBO-asGCS (50-200 nM) were introduced into cells with the facility of Lipofectamine 2000, as described previously [37]. Cells were cultured with MBO-asGCS in 10% FBS RPMI-1640 medium for 6 days, as an additional transfection of MBO-asGCS with the same conditions was conducted at day 3. MBO-asGCS was synthesized to target the ORF 18-37 of human glucosylceramide synthase (GCS) and purified by reverse-phase HPLC and desalting in Integrated DNA Technologies (Coralville, IA) [37]. The Lipofectamine 2000 and Opti-MEM I reduced-serum medium were purchased from Invitrogen for MBO-asGCS transfection.
2.2 Measurement of cellular transportability-accumulation and efflux
The measurements were performed as described previously [38] with modification. Flutax-2 (Oregon green 488 paclitaxel) was purchased from Invitrogen (Cat. P22310). Cells (50,000 cells/well) were plated in 24-well plates and grew in 10% FBS RPMI-1640 medium overnight. After PBS rinsing, cells were incubated with Flutax-2 (0.01-1.0 μM for kinetics, 500 nM for other assays) in Opti-MEM I reduced-serum medium, at 37 °C for 120 min. Following removal of Flutax-2 medium, the cells were rinsed with 1 ml of ice-cold PBS, trypsinized and collected into 1.5 ml of Ependorf tubes. Cells were centrifuged for 5 min at 2500 rpm (Ependorf microcentrifuge) and washed with 1 ml ice-cold PBS three times to remove extracellular Flutax-2, and then resuspended in 300 μl medium. A portion of cell suspension (100 μl) was transferred into 96-well black plates to measure fluorescence. Fluorescence intensity was measured at λexcitation 485 nm and λemission 529 nm (sensitivity at 100) using Synergy HT multi-detection microplate reader (BioTek, Winnooski, VT). For efflux, after 2 hr Flutax-2 incubation, the cells were rinsed with ice-cold PBS three times and incubated with 250 μl fresh medium at 37 °C for additional 2 hr. After incubation, the 250 μl medium was transferred into 96-well black plates to measure Flutax-2 extruded.
To inhibit P-gp function, NCI/ADR-RES cells were exposed to verapamil (2.5-50 μM) in 5% RPMI-1640 at 37 °C for 2 hr, before the analysis of accumulation and efflux. Verapamil hydrochloride was purchased from Sigma-Aldrich (St. Louis, MO). To repress MDR1 expression, NCI/ADR-RES cells were transfected with MBO-asGCS (50-200 nM) twice and grown in 10% FBS RPMI-1640 medium for 6 days.
The data for accumulation or efflux were normalized against total proteins. Efflux was calculated as the fluorescence intensity of Flutax-2 extruded into medium (extrusion) divided by the fluorescence intensity accumulated in cells (accumulation) in the same condition. All data represents the mean ± SD from triplets and experiments were repeated at least 3 times. Two-tailed student's t test was used to compare mean values. Cellular accumulation and efflux of Flutax-2 were simplified as enzymatic processing (nonlinear regression, Michaelis-Menten constant) and calculated using Prism V4 program (GraphPad software, San Diego, CA).
To analyze accumulation and efflux close to in-vivo condition, tumors or tissues resected were immediately pieced with straight microscissor in RPMI-1640 medium (100 mg/100μl) containing collagenase IV (500 units/ml; from Sigma-Aldrich) and dispersed with incubation at 37 °C for 30 min. Tissue suspension for each sample was divided into three parts (10 mg each in 10 μl medium), and an equal value of Flutax-2 medium (2 μM) was added to reach 1 μM concentration of Flutax-2 for accumulation incubation. For kinetic study, NCI/ADR-RES tumor suspensions were incubated increasing concentrations of Flutax-2 (0.05-1.0 μM, final). The suspensions were continuously incubated at 37°C for 2 hr. The accumulation of Flutax-2 in tissue suspensions was observed on smear slides during incubation period and photomicrographed using Nickon microscope (Eclipse-TS100). The accumulation of tissues was measured after centrifugation and ice-cold PBS washing three times as described above. For efflux of tissues, after 2 hr of Flutax-2 incubation, the suspension cells were centrifuged and rinsed with ice-cold PBS twice, and incubated in fresh medium at 37 °C for additional 2 hr; the medium after incubation was transferred into 96-well black plates to measure Flutax-2 efflux.
To test the influence of storage condition in cellular transportability, the pieces of NCI/ADR-RES tumor (∼50 mg) resected were put into 1.5 ml Ependorf tubes and stored in refrigerator about 4 °C for further measurements. After the storage intervals, the tumor pieces were warmed in RPMI-1640 medium (100 mg/100μl) containing collagenase IV (500 units/ml) at 37 °C for 5 min and pieced with straight microscissor. After 30 min incubation, tumor suspensions were divided, mixed with equal value of Flutax-2 medium (2 μM, to reach 1 μM final concentration) and then incubated at 37 °C to analyze accumulation and extrusion, as described above.
2.3 Western blot
Western blot analysis was performed as described previously [6, 9]. Briefly, Drug-resistant and drug-sensitive cancer cells (3 × 10⁶ per 100-mm dish) were cultured in 10 % FBS RPMI-1640 medium for 48 hr and harvested using the NP40 cell lysis buffer (Biosource, Camarillo, CA). The amounts of detergent-soluble proteins were measured using a bicinchoninic acid (BCA) protein assay kit (Pierce, Rockford, IL, USA). Equal amount of total detergent-soluble proteins (50 μg/lane) were resolved using 4-20% gradient SDS-PAGE (Invitrogen). The transferred blots were blocked with 5% fat-free milk in PBS and then incubated with primary antibodies (anti-P-gp antibody, C219 or anti-GADPH antibody; 1:1,000 dilution) at 4 °C for overnight. The antigen-antibody in blots was detected by using horseradish peroxidase (HRP) and enzyme-linked chemiluminescence (ECL) plus substrate (GE Healthcare, Piscataway, NJ) Anti-human P-gp antibody (C219) was purchased from Zymed (Carlsbad, CA). Endogenous GAPDH was used as internal control. The levels of P-gp were represented by the ratios of optical densities in P-gp bands normalized against GAPDH. To repress MDR1 expression, NCI/ADR-RES cells were treated with MBO-asGCS (50-200 nM) for 6 days as described above.
2.4 Tumor-bearing mice and treatment
The animal study was approved by the IACUC of University of Louisiana at Monroe (ULM) and conducted as described previously [37]. Athymic nude mice (Foxn1nu/Foxn1+, 4-5 weeks, female) were purchased from Harlan (Indianapolis, IN) and maintained in the ULM vivarium. NCI/ADR-RES and SW620AD cell suspensions (3-5 passages, 1 × 10⁶ cells in 20 μl per mouse) were injected into the left flank of each mouse. When tumors reached ∼5 mm in diameter, mice were randomly allotted to different groups (6 mice per group). MBO-asGCS treatments (1 mg/kg every three days) were administered intratumorally in mice with NCI/ADR-RES or SW620AD xenografts for 3 times. Saline groups were intratumorally injected the same volume of serum-free medium. Tumors and other tissues were resected in the second day following last injection. Verapamil treatment (15 mg/kg/day) was intraperitoneally administered in mice with NCI/ADR-RES tumors for 2 days; tissues were resected in 7 hr following last injection of verapamil.
3. Results
3.1 Quantitation of the accumulation and efflux of cells using Flutax-2
We used commercially available florescent substrate of P-gp, Flutax-2 (Oregon green-488 paclitaxel) to measure cellular accumulation and efflux in cancer cell lines and tumors. Fluorescence Oregon green-488 is attached by derivatizing the 7β-hydroxy group of native paclitaxel. Paclitaxel is a specific substrate of P-gp and is broadly used in standard treatment for several solid cancers [11, 39]. Therefore, the cellular efflux of paclitaxel represents P-gp function as well as potential tumor responsiveness to anticancer drugs [40]. With high cell permeability, Flutax-2 has been used as a tubulin tracker for live-cell imaging and kinetics study of paclitaxel in cells [38, 40, 41]. To examine whether Flutax-2 is a suitable tracker for cellular transportability, we examined the kinetics of Flutax-2 and its association with the P-gp in NCI/ADR-RES cancer cells that overexpress P-gp and display MDR [33]. After 2 hr incubation, cellular fluorescent intensities of Flutax-2 (accumulation) were lineally correlated to the Flutax-2 concentrations (0.01-1.0 μM; γ2 = 0.99) added in medium (Fig. 1A, Table 1). The accumulation constant of Flutax-2 (Km-accumulation) is 2.49 μM (Table 1). The extruded amounts of Flutax-2 (extrusion) were linearly correlated to the concentrations of Flutax-2 added in medium (γ2 = 0.99). In these conditions, the extrusion constant of Flutax-2 (Km-extrusion) is 1.31 μM and the efflux of Flutax-2 is 0.53 (Fig. 1A, Table 1). The Flutax-2 Km-extrusion in NCI/ADR-RES cells is about 12-fold lower than the Km reported for human intestinal epithelial Caco-2 cells using [3H]paclitaxel (1.31 vs. 16.5 μM) [42].
Fig. 1.

Quantitation of cellular accumulation and efflux using Flutax-2. (A) Cellular accumulation and extrusion. Human NCI/ADR-RES cells were incubated with increasing concentrations of Flutax-2 for 2 hr. Cellular Flutax-2 was measured to evaluate cellular accumulation (dashed line). After additional 2 hr incubation, the extruded Fluta-2 in medium was measured to evaluate cellular extrusion (solid line). (B) Detection of cellular efflux after P-gp inhibition. After verapamil pre-treatments (2 hr), NCI/ADR-RES cells were incubated with Flutax-2 (500 nM) for the accumulation and extrusion. *, p<0.001 compared with vehicle control in accumulation; **, p<0.001 compared with vehicle control in efflux; efflux#, efflux (efflux/accumulation) is presented as percents in solid circles and line.
Table 1.
Kinetics of Flutax-2 accumulation and efflux in NCI/ADR-RES cells and tumors.
| Accumulation | Extrusion | Efflux (extrusion/accumulation) |
|||
|---|---|---|---|---|---|
| Km-accumulation | γ2 | Km-extrusion | γ2 | ||
| Cells | 2.49 ± 0.45 μM | 0.999 | 1.31 ± 0.25 μM | 0.996 | 0.526 |
| Tumors | 2.70 ± 1.03 μM | 0.994 | 1.16 ± 0.25 μM | 0.995 | 0.429 |
γ2, correlation coefficient analyzed using nonlinear regression or sigmoid does-response with variable slope model. Km-accumulation and Km-extrusion, Michaelis-Menten constants of accumulation and extrusion.
To examine whether this new method can precisely describe cellular transportability in vivo, we measured accumulation and efflux of Flutax-2 in NCI/ADR-RES cells after verapamil treatment. Verapamil, a specific inhibitor of P-gp can effectively decrease cellular efflux in cells overexpressing MDR1 [42, 43]. We found that verapamil inhibited P-gp effluxing in NCI/ADR-RES cells. As showed in Fig. 1B, this method detected cellular accumulation increased and extrusion decreased in dose-dependent fashion, particularly at 10 to 50 μM concentrations of verapamil. Verapamil treatment (50 μM) significantly increased cellular accumulation by approximately 10-fold (192,425 vs. 19,775 fluorescence intensity, FI) and decreased the efflux (extrusion/accumulation) by 2-fold (0.58 vs. 0.24). These data indicate that this Flutax-2 spectrophotometry method can quantitatively detect cellular efflux of P-gp.
3.2 Validation of cellular efflux with P-gp levels in MDR cancer cells
To further validate this method, we examined the correlation of cellular transportability and MDR1 expression in 4 paired drug-resistant and drug-sensitive-cell cancer lines. MDR1 was overexpressed in all of these drug-resistant human cancer cell lines. As compared with drug-sensitive counterparts, P-gp protein levels were approximately 3- to 13 fold greater in drug-resistant NCI/ADR-RES, KB-A1, SW620AD and A2780AD cell lines (Fig. 2A). The cellular accumulation was substantially decreased and cellular efflux was increased in drug-resistant cells due to MDR1 overexpression (Fig. 2A, 2B). The amounts of Flutax-2 accumulation were decreased by 11-fold in NCI/ADR-RES, 11-fold in A2780AD, 6-fold in KB-A1, and 8-fold in SW620AD cells, as compared to drug-sensitive cells, respectively. In contrast, the efflux of Flutax-2 were increased to 150% (0.58 vs. 0.39) in NCI/ADR-RES, 255% (0.49 vs. 0.19) in A2780AD, 175% (0.69 vs. 0.39) in KB-A1 and 147% (0.53 vs. 0.36) in SW620AD cells, as compared to drug-sensitive counterpart.
Fig. 2.
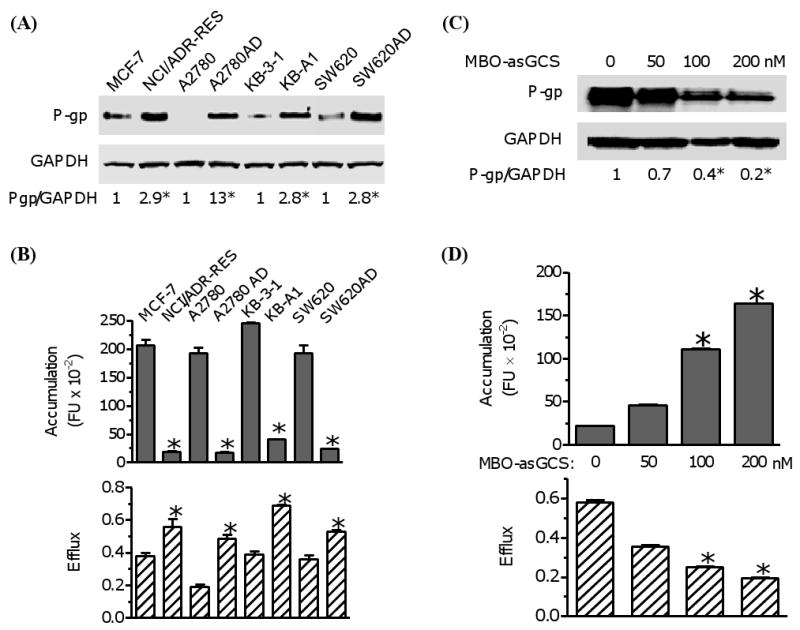
Examination of cellular accumulation and efflux in diverse cancer cell lines. (A) P-gp protein levels. Equal amount of detergent-soluble cell proteins (50 μg/lane) were resolved using SDS-PAGE and were immunoblotted with anti-P-gp antibody. The levels of P-gp were presented in the ratios of P-gp/GAPDH densities. *, p<0.001 compared with drug-sensitive counterpart. (B) Cellular accumulation and efflux of cancer cells. Cells were incubated with Flutax-2 (0.5 μM) for 2 hr to measure the accumulation. After washing, the cells were incubated in fresh medium for additional 2 hr to measure the efflux. *, p<0.001 compared with drug-sensitive counterpart. (C) P-gp in cells after MBO-asGCS treatment. NCI/ADR-RES cells were treated with MBO-asGCS for 6 days. Equal amount of detergent-soluble proteins (50 μg/lane) were resolved and were immunoblotted with anti-P-gp antibody. *, p<0.001 compared with vehicle control. (D) The accumulation and efflux of cells after MBO-asGCS treatment. After MBO-asGCS treatments, NCI/ADR-RES cells were incubated with Flutax-2 (0.50 μM) for accumulation and efflux assay. *, p<0.001 compared with vehicle control.
We also examined the cellular transportability in cells that MDR1 expression was suppressed. GCS, converting ceramide to glucosylceramide, is associated with drug resistance in cancer; suppressing GCS represses MDR1 expression [6, 9]. MBO-asGCS is an novel oligonucleotide to specifically silence human GCS expression [37]. As showed in Fig. 2C, MBO-asGCS treatments (50-200 nM, 6 days) significantly inhibited MDR1 expression in NCI/ADR-RES cells. The P-gp levels decreased to 65%, 39% and 22% at 50, 100 and 200 nM concentrations of MBO-asGCS. With the decreases of P-gp, the amounts of Flutax-2 accumulation were increased by 2-fold (4,620 vs. 2,178 FI), 5-fold (11,128 vs. 2,178 FI), and 7.5-fold (16,400 vs. 2,178 FI) in cells after these treatments (Fig. 2D). The cellular efflux in NCI/ADR-RES cells was decreased in dose-dependent fashion after MBO-asGCS treatment (Fig. 2D). The efflux reduced to 43% and 33% at 100 nM and 200 nM concentrations of MBO-asGCS, as compared to vehicle treatment, respectively (Fig. 2D). These data indicate this functional assay can be used to measure cellular efflux and accumulation in diverse cell lines and in status that MDR1 expression manipulated by other agents.
3.3 Quantitation of the accumulation and efflux of Flutax-2 in tissues
After examined in different conditions, we found that incubation of Flutax-2 with freshly prepared cell suspension of tissues would be a reliable approach to assess cellular transportability in vivo. Suspending tissues have been frequently used to isolate stem cells and to measure enzyme activity in vivo recently [44, 45]. However, it is barely tested whether tissue suspension is applicable for cellular transportability analysis. To ensure that freshly prepared suspension of tissues could retain transportability, we pieced tissues and dispersed them with collagenase immediately after resection and conducted the measurement of accumulation and extrusion. As showed in Fig. 3A, the cell suspensions of tumor (NCI/ADR-RES), small intestine and liver substantially took Flutax-2 up (green fluorescence) after 2 hr incubation. The cellular accumulation and extrusion of Flutax-2 in these tissues are dependent on the amounts of tissues; the correlation coefficients of accumulation and extrusion are 0.95-0.99 in the suspensions of tumor, small intestine and liver (Fig. 3B). We found that the capacities of accumulation and extrusion of tumor were significantly less than small intestine and liver. The accumulation capacity of tumor is 11-fold less than small intestine (6,621 vs. 580 FI/mg) and 9-fold less than liver (5,244 vs. 580 FI/mg); the extrusion capacity of tumor is 10-fold less than small intestine (2,366 vs. 238 FI/mg) and 9-fold less than liver (2,169 vs. 238 FI/mg). Efflux values are 0.41 in tumor, 0.36 in small intestine and 0.41 in liver, respectively. This method is able to detect cellular efflux confidently in approximately 5 mg of tissues or tumors (Fig. 3B).
Fig. 3.
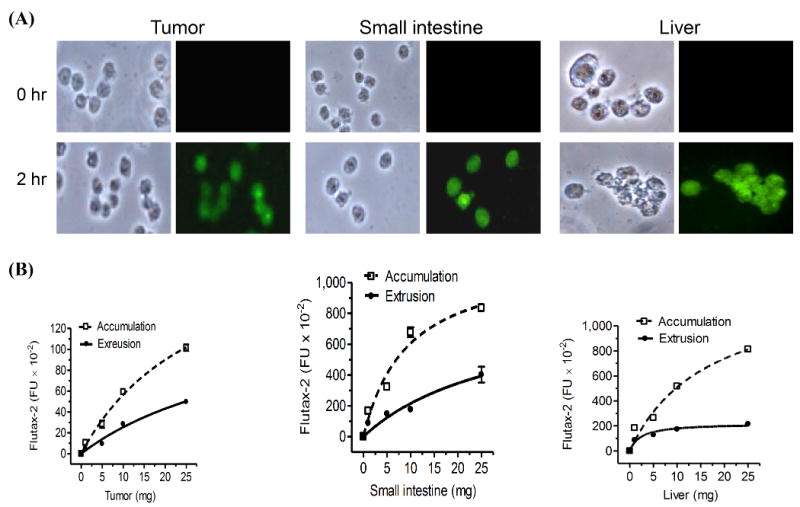
Accumulation and extrusion of Flutax-2 in tissues. (A) Flutax-2 accumulation in cell suspension of tissues. Cell suspensions of NCI/ADR-RES tumor, small intestine and liver of athymic mice were incubated with Flutax-2 (1 μM) in medium containing collagenase IV. The smear slides from each incubation condition were observed under microscope (left side, bright field; right side, fluorescence filed). (B) Accumulation and extrusion of Flutax-2 in cell suspensions of tumor, small intestine and liver. Increasing amounts of cell suspensions were incubated with Flutax-2 (1 μM) in medium containing collagenase. After 2 hr, cellular Flutax-2 was measured to evaluate accumulation (dashed line). The extrusion of the suspensions was measured after 2 hr additional incubation (solid line).
3.4 Validation of cellular efflux with P-gp in tumors
To test whether tumor suspensions can be used for cellular transportability assay, we measured the kinetics of Flutax-2 in tumors generated from NCI/ADR-RES cells. As showed in Fig. 4, cellular fluorescence intensities were lineally correlated to the Flutax-2 concentrations added in the medium (0.01-1.0 μM, γ2 = 0.99). The accumulation constant of Flutax-2 (Km-accumulation) in tumor suspension is 2.70 μM. The extruded Flutax-2 amounts were linearly correlated to Flutax-2 concentrations added in medium (γ2 = 0.99). In these conditions, the extrusion constant of Flutax-2 (Km-extrusion) in tumor suspensions is 1.16 μM and the efflux value of the tumors is 0.43. The values of Km-accumulation, Km-extrusion and efflux of tumor suspensions are close to these in NCI/ADR-RES cells that are used to generate these tumors (Table 1). These data indicate that cell suspensions of tumors, possible of other tissues prepared in this study are proper source for transportability assay.
Fig. 4.

Kinetics of Flutax-2 accumulation and extrusion in tumors. Cell suspensions of NCI/ADR-RES tumors were incubated with Flutax-2 (1 μM) in medium containing collagenase. After 2 hr incubation, cellular Flutax-2 was measured to evaluate accumulation (dashed line). The efflux of tumor cell suspension was measured after 2 hr additional incubation (solid line). The parameters of kinetics were evaluated and presented in Table 1.
We examined whether this method can detect the alterations of cellular efflux in different types of tumors after treatments. Mice bearing tumor xenografts of NCI/ADR-RES and SW620AD were treated with MBO-asGCS, since both coincidently overexpress MDR1 and GCS [36, 46] and MBO-asGCS represses MDR1 expression (Fig. 2C). MBO-asGCS treatments (1 mg/kg every 3 days) significantly decreased MDR1 expression as detected using Western blotting (Fig. 5). The levels of P-gp were decreased by approximately 4 times in drug-resistant NCI/ADR-RES and SW620AD xenografts (Fig. 5). Employing Flutax-2 spectrophotometry assay, we found that MBO-asGCS treatments substantially increased cellular accumulation and decreased extrusion in both models (Table 2). The amounts of accumulation were 7-fold greater (36,061 vs. 5,193 FI) in the NCI/ADR-RES, and 6-fold (35,925 vs. 5,865 FI) greater in the SW620AD xenografts, as compared with saline groups, respectively (Table 2). MBO-asGCS treatments considerably decreased P-gp effluxing, and the values of efflux were decreased by more than 2-fold in NCI/ADR-RES (0.42 vs. 0.18) and in SW620AD xenografts (0.40 vs. 0.17), as compared with each saline group. Moreover, this method detected alteration of efflux in NCI/ADR-RES tumors after verapamil treatment (15 mg/kg, Table 2). Verapamil significantly increased the accumulation by approximately 8-fold (40,995 vs. 5,193) and decreased the efflux by 2.4-fold (0.42 vs. 0.17) in NCI/ADR-RES tumors.
Fig. 5.
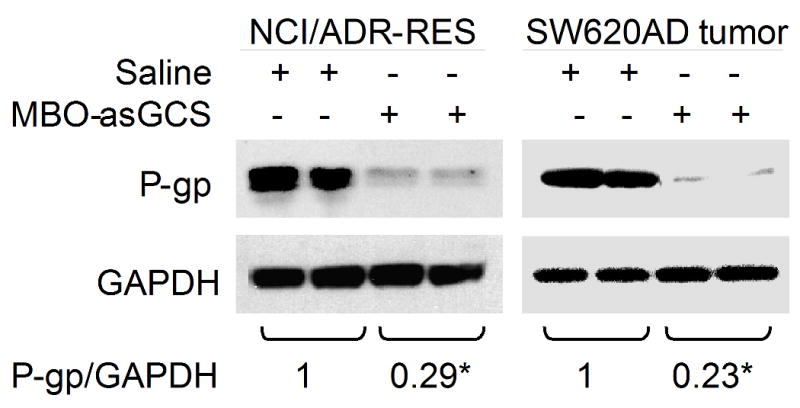
Alterations of P-gp in tumors of mice after treatments in vivo. After MBO-asGCS treatments, NCI/ADR-RES and SW620AD tumors were removed and used to extract proteins. Equal amount of detergent-soluble proteins (50 μg/lane) were resolved using SDS-PAGE and were immunoblotted with anti-P-gp antibody. P-gp levels were presented in the ratios of P-gp/GAPDH densities. *, p<0.001 compared with saline treatments.
Table 2.
Cellular accumulation and efflux of tumors after P-gp inhibition in vivo.
| NCI/ADR-RES tumors (6 mice/group) | SW620AD tumors (6 mice/group) | |||||
|---|---|---|---|---|---|---|
| Accumulation | Extrusion | Efflux | Accumulation | Extrusion | Efflux | |
| Saline | 5,193 ± 179 | 2,206 ± 56 | 0.420 | 5,865 ± 43 | 2,350 ± 8 | 0.401 |
| MBO-asGCS | 36,061 ± 204* | 6,300 ± 98* | 0.175* | 35,925 ± 288* | 6,153 ± 283* | 0.171* |
| Verapamil | 40,995 ± 901* | 7,081 ± 437* | 0.172* | N/A | ||
P<0.001 compared with saline treatment in corresponding condition.
We tested cellular transportability of NCI/ADR-RES tumors that were stored at 4 °C. The accumulation, extrusion and efflux of tumors were stable after 2 to 6 hr storage. However, the accumulation was decreased to 65% (3,415 vs. 5,242 FI) and 24% (1,255 vs. 5,242 FI) after 12 and 24 hr of storage, as compared to fresh tumor tissues (Fig. 6). The values of efflux were dropped to approximately 84% (0.35 vs. 0.414) after 12 hr and 24 hr of storage. It suggests that decrease of cell permeability for Flutax-2 reduces the detection sensitivity of this assay after sample storage.
Fig. 6.

Cellular transportability of tumor after storage. After resection, NCI/ADR-RES tumor tissues were stored in 4°C for indicated periods of time. The cell suspensions of tumors were incubated with Flutax-2 (1μM) in RPMI-1640 medium containing collagenase to measure cellular accumulation and extrusion. *, p<0.001 compared with fresh tumors. Efflux#, efflux (efflux/accumulation) is presented as percents in solid circles and line. Data represent mean ± SD of triplicates.
4. Discussion
We have developed a new functional assay using Flutax-2 and spectrometry to directly quantitate cellular efflux, thus determining the drug resistance of cancers that overproduce P-gp. Fluorescent dye Rodamine 123 has been used to quickly characterize P-gp and drug resistance in cancer cells [6, 47]. In this study we used Flutax-2, a fluorescent derivative of paclitaxel with high diffusion coefficient to cells and tumors [41, 48]. Besides being one of most effective drugs for solid tumor treatments, paclitaxel is a specific substrate of P-gp and [3H]paclitaxel has been broadly used to study the effluxing [49, 50]. Present study has demonstrated that measurement of Flutax-2 using fluorescence spectrometer can accurately assess cellular efflux. In NCI/ADR-RES cells, the accumulation and extrusion of Flutax-2 intensities are linearly increased with the Flutax-2 concentrations before both reach each saturation level in incubations. The constants of accumulation (Km-accumulation) and extrusion (Km-extrusion) are 2.49 μM and 1.31 μM in NCI/ADR-RES cells, respectively (Fig. 1A, Table 1). This method can precisely measure the alterations of cellular efflux mainly depending on P-gp levels. We have detected the increase of accumulation and decrease of efflux of NCI/ADR-RES cells treated with verapamil in a dose-dependent fashion (Fig. 1B). In four paired cell lines of human breast (MCF-7), ovarian (A2780), cervical (KB-3-1) and colorectal cancers (SW620), the alterations of cellular efflux as well as accumulation measured by using this method are consistent with P-gp protein levels and much sensitively represent P-gp status (Fig. 2A, 2B). Furthermore, this method has detected the decrease of efflux with P-gp suppression in NCI/ADR-RES cells treated with MBO-asGCS (Fig. 2C, 2D). Taken together, these results suggest that Flutax-2 can freely diffuse to different cancer cells and its extrusion as well as retention mainly depends on the levels of P-gp in cells. This method can be employed to determine drug resistance resulted from increased levels of P-gp and evaluate the effectiveness of agents in the reversal of cancer drug resistance.
Our examinations have proved that this method is suitable to assess drug resistance in tumors that overproduce P-gp. Flutax-2 has substantially accumulated in cell suspensions of tumor, small intestine and liver after 2 hr incubation (Fig. 3A). The accumulation and extrusion of Flutax-2 are linearly increased with the amounts of these tissues (Fig. 3). Flutax-2 spectrometry can sensitively measure the accumulation and extrusion in cell suspensions generated from approximately 5 mg tissues. In the tumor xenografts (NCI-ADR-RES), the intensities of accumulation and efflux are highly correlated with Flutax-2 concentrations in incubations (0.01-1.0 μM) (Fig. 4). The constant of accumulation (Km-accumulation) that represents accumulation rate of Flutax-2 depending on the diffusion and the efflux in tumors (NCI/ADR-RES) is close to that in NCI/ADR-RES cells (2.70 vs. 2.49 μM) (Table 1). The extrusion constant (Km-extrusion) that displays P-gp function in tumors (NCI/ADR-RES) is similar to that in NCI/ADR-RES cells (1.16 vs. 1.31 μM) (Table 1). MBO-asGCS treatments suppress P-gp protein and verapamil inhibits the efflux of P-gp in tumors (NCI/ADR-RES, SW620AD) (Fig. 2C, Fig. 5, Table 2). The values of efflux as well as accumulation detected are consistent with P-gp inhibition and precisely represent the reversal effects of these agents in vivo (Table 2). These demonstrate that applying this method measuring P-gp efflux in tumors can assess drug resistance and evaluate the reversal efficiency of agents.
The present method is advanced in several aspects, compared with other assays used to measure cellular efflux. Non-specific cytoplasmic esterase that converts intracellular calcein-AM into fluorescent calcein may limit the application of calcein-AM based assays in certain cancer cells or tumors [31]. Using Bodipy-FL-verapamil (even at low concentrations) to measure P-gp efflux [51] may underestimate the degree of drug resistance in some cases; since that verapamil is an effective blocker of P-gp. The accumulation of Flutax-2 in cancer cells or tumors directly indicates the pharmacokinetics of paclitaxel or drugs for cancer treatment. The efflux of Flutax-2 represents P-gp function extruding anticancer drugs and leading to drug resistance. Using fluorescence spectrometer to measure Flutax-2 is simple and can be easily conducted in clinic laboratory.
It is noted that solid tumors always have cells varying in expression of genes including MDR1 and this heterogeneity in sampled tumor tissues may affect the analysis results. The kinetic study of Flutax-2 shows that the tumor efflux is lower than in NCI/ADR-RES cell line that was used to generate the tumors (0.43 vs. 53, Table 1). However, the alterations of the efflux with P-gp inhibition in the tumors after MBO-asGCS and verapamil treatments (Fig. 5, Table 2) are consistent with the decreased degrees of the efflux in NCI/ADR-RES cells after these treatments (Fig. 3C, 3D). It may suggest that tumor heterogeneity has minimal effect on employing this method to assess drug resistance of tumors. This method can be used to precisely assess P-gp drug resistance in fresh tumor samples. However, further validation of this method in clinic settings for the diagnosis of drug resistance purpose, and improvement of the sample storage conditions are needed.
Acknowledgments
This work was supported by United State Public Health Service/NIH grant P20 RR16456 from the NCRR (Y.Y.L), and Department of Defense Breast Cancer Research Program DAMD17-01-1-0536 (Y.Y.L.).
Footnotes
Publisher's Disclaimer: This is a PDF file of an unedited manuscript that has been accepted for publication. As a service to our customers we are providing this early version of the manuscript. The manuscript will undergo copyediting, typesetting, and review of the resulting proof before it is published in its final citable form. Please note that during the production process errors may be discovered which could affect the content, and all legal disclaimers that apply to the journal pertain.
References
- 1.Hait WN, Yang JM. Clinical management of recurrent breast cancer: development of multidrug resistance (MDR) and strategies to circumvent it. Semin Oncol. 2005;32:S16–21. doi: 10.1053/j.seminoncol.2005.09.011. [DOI] [PubMed] [Google Scholar]
- 2.Perez-Tomas R. Multidrug resistance: retrospect and prospects in anti-cancer drug treatment. Curr Med Chem. 2006;13:1859–76. doi: 10.2174/092986706777585077. [DOI] [PubMed] [Google Scholar]
- 3.Gonzalez-Angulo AM, Morales-Vasquez F, Hortobagyi GN. Overview of resistance to systemic therapy in patients with breast cancer. Adv Exp Med Biol. 2007;608:1–22. doi: 10.1007/978-0-387-74039-3_1. [DOI] [PubMed] [Google Scholar]
- 4.Wilson TR, Johnston PG, Longley DB. Anti-apoptotic mechanisms of drug resistance in cancer. Curr Cancer Drug Targets. 2009;9:307–19. doi: 10.2174/156800909788166547. [DOI] [PubMed] [Google Scholar]
- 5.Szakacs G, Paterson JK, Ludwig JA, Booth-Genthe C, Gottesman MM. Targeting multidrug resistance in cancer. Nat Rev Drug Discov. 2006;5:219–34. doi: 10.1038/nrd1984. [DOI] [PubMed] [Google Scholar]
- 6.Liu YY, Han TY, Giuliano AE, Cabot MC. Ceramide glycosylation potentiates cellular multidrug resistance. Faseb J. 2001;15:719–30. doi: 10.1096/fj.00-0223com. [DOI] [PubMed] [Google Scholar]
- 7.Wu CP, Calcagno AM, Ambudkar SV. Reversal of ABC drug transporter-mediated multidrug resistance in cancer cells: Evaluation of current strategies. Curr Mol Pharmacol. 2008;1:93–105. doi: 10.2174/1874467210801020093. [DOI] [PMC free article] [PubMed] [Google Scholar]
- 8.Leonard GD, Fojo T, Bates SE. The role of ABC transporters in clinical practice. Oncologist. 2003;8:411–24. doi: 10.1634/theoncologist.8-5-411. [DOI] [PubMed] [Google Scholar]
- 9.Gouaze V, Liu YY, Prickett CS, Yu JY, Giuliano AE, Cabot MC. Glucosylceramide synthase blockade down-regulates P-glycoprotein and resensitizes multidrug-resistant breast cancer cells to anticancer drugs. Cancer research. 2005;65:3861–7. doi: 10.1158/0008-5472.CAN-04-2329. [DOI] [PubMed] [Google Scholar]
- 10.Gottesman MM, Fojo T, Bates SE. Multidrug resistance in cancer: role of ATP-dependent transporters. Nat Rev Cancer. 2002;2:48–58. doi: 10.1038/nrc706. [DOI] [PubMed] [Google Scholar]
- 11.Eckford PD, Sharom FJ. ABC efflux pump-based resistance to chemotherapy drugs. Chem Rev. 2009;109:2989–3011. doi: 10.1021/cr9000226. [DOI] [PubMed] [Google Scholar]
- 12.Schrag D, Garewal HS, Burstein HJ, Samson DJ, Von Hoff DD, Somerfield MR. American Society of Clinical Oncology Technology Assessment: chemotherapy sensitivity and resistance assays. J Clin Oncol. 2004;22:3631–8. doi: 10.1200/JCO.2004.05.065. [DOI] [PubMed] [Google Scholar]
- 13.Mohan HK, Miles KA. Cost-effectiveness of 99mTc-sestamibi in predicting response to chemotherapy in patients with lung cancer: systematic review and meta-analysis. J Nucl Med. 2009;50:376–81. doi: 10.2967/jnumed.108.055988. [DOI] [PubMed] [Google Scholar]
- 14.Claret L, Girard P, Hoff PM, Van Cutsem E, Zuideveld KP, Jorga K, et al. Model-based prediction of phase III overall survival in colorectal cancer on the basis of phase II tumor dynamics. J Clin Oncol. 2009;27:4103–8. doi: 10.1200/JCO.2008.21.0807. [DOI] [PubMed] [Google Scholar]
- 15.Kern DH, Weisenthal LM. Highly specific prediction of antineoplastic drug resistance with an in vitro assay using suprapharmacologic drug exposures. J Natl Cancer Inst. 1990;82:582–8. doi: 10.1093/jnci/82.7.582. [DOI] [PubMed] [Google Scholar]
- 16.Samson DJ, Seidenfeld J, Ziegler K, Aronson N. Chemotherapy sensitivity and resistance assays: a systematic review. J Clin Oncol. 2004;22:3618–30. doi: 10.1200/JCO.2004.04.077. [DOI] [PubMed] [Google Scholar]
- 17.Kim HS, Kim TJ, Chung HH, Kim JW, Kim BG, Park NH, et al. In vitro extreme drug resistance assay to taxanes or platinum compounds for the prediction of clinical outcomes in epithelial ovarian cancer: a prospective cohort study. J Cancer Res Clin Oncol. 2009 doi: 10.1007/s00432-009-0598-0. [DOI] [PubMed] [Google Scholar]
- 18.Karam AK, Karlan BY. Extreme drug resistance assay does not influence survival in women with epithelial ovarian cancer. Gynecol Oncol. 2009 doi: 10.1016/j.ygyno.2009.02.022. [DOI] [PubMed] [Google Scholar]
- 19.DeVita VT, Hellman S, Rosenberg SA. Philadelphia: Lippincott Williams & Wilkins, 2009.
- 20.Arceci RJ. Clinical significance of P-glycoprotein in multidrug resistance malignancies. Blood. 1993;81:2215–22. [PubMed] [Google Scholar]
- 21.Olesen LH, Norgaard JM, Pallisgaard N, Bukh A, Hokland P. Validation and clinical implication of a quantitative real-time PCR determination of MDR1 gene expression: comparison with semi-quantitative PCR in 101 patients with acute myeloid leukemia. Eur J Haematol. 2003;70:296–303. doi: 10.1034/j.1600-0609.2003.00060.x. [DOI] [PubMed] [Google Scholar]
- 22.Punyammalee B, Manoromana S, Purisa W, Chariyalertsak S, Rerkamnuaychok B. Association of mdr1 gene expression with other prognostic factors and clinical outcome in human breast cancer. J Med Assoc Thai. 1997;80 1:S162–73. [PubMed] [Google Scholar]
- 23.Orina JN, Calcagno AM, Wu CP, Varma S, Shih J, Lin M, et al. Evaluation of current methods used to analyze the expression profiles of ATP-binding cassette transporters yields an improved drug-discovery database. Mol Cancer Ther. 2009;8:2057–66. doi: 10.1158/1535-7163.MCT-09-0256. [DOI] [PMC free article] [PubMed] [Google Scholar]
- 24.Fujimaki S, Funato T, Harigae H, Fujiwara J, Kameoka J, Meguro K, et al. Quantitative analysis of a MDR1 transcript for prediction of drug resistance in acute leukemia. Clin Chem. 2002;48:811–7. [PubMed] [Google Scholar]
- 25.Zhang JT. Use of arrays to investigate the contribution of ATP-binding cassette transporters to drug resistance in cancer chemotherapy and prediction of chemosensitivity. Cell Res. 2007;17:311–23. doi: 10.1038/cr.2007.15. [DOI] [PubMed] [Google Scholar]
- 26.van der Holt B, Van den Heuvel-Eibrink MM, Van Schaik RH, van der Heiden IP, Wiemer EA, Vossebeld PJ, et al. ABCB1 gene polymorphisms are not associated with treatment outcome in elderly acute myeloid leukemia patients. Clin Pharmacol Ther. 2006;80:427–39. doi: 10.1016/j.clpt.2006.07.005. [DOI] [PubMed] [Google Scholar]
- 27.Zhang JT, Ling V. Study of membrane orientation and glycosylated extracellular loops of mouse P-glycoprotein by in vitro translation. J Biol Chem. 1991;266:18224–32. [PubMed] [Google Scholar]
- 28.Kramer R, Weber TK, Arceci R, Ramchurren N, Kastrinakis WV, Steele G, Jr, et al. Inhibition of N-linked glycosylation of P-glycoprotein by tunicamycin results in a reduced multidrug resistance phenotype. Br J Cancer. 1995;71:670–5. doi: 10.1038/bjc.1995.133. [DOI] [PMC free article] [PubMed] [Google Scholar]
- 29.Yang JM, Chin KV, Hait WN. Interaction of P-glycoprotein with protein kinase C in human multidrug resistant carcinoma cells. Cancer research. 1996;56:3490–4. [PubMed] [Google Scholar]
- 30.Kannan P, John C, Zoghbi SS, Halldin C, Gottesman MM, Innis RB, et al. Imaging the function of P-glycoprotein with radiotracers: pharmacokinetics and in vivo applications. Clin Pharmacol Ther. 2009;86:368–77. doi: 10.1038/clpt.2009.138. [DOI] [PMC free article] [PubMed] [Google Scholar]
- 31.Homolya L, Hollo M, Muller M, Mechetner EB, Sarkadi B. A new method for a quantitative assessment of P-glycoprotein-related multidrug resistance in tumour cells. Br J Cancer. 1996;73:849–55. doi: 10.1038/bjc.1996.151. [DOI] [PMC free article] [PubMed] [Google Scholar]
- 32.Piwnica-Worms D, Chiu ML, Budding M, Kronauge JF, Kramer RA, Croop JM. Functional imaging of multidrug-resistant P-glycoprotein with an organotechnetium complex. Cancer research. 1993;53:977–84. [PubMed] [Google Scholar]
- 33.Fairchild CR, Ivy SP, Kao-Shan CS, Whang-Peng J, Rosen N, Israel MA, et al. Isolation of amplified and overexpressed DNA sequences from adriamycin-resistant human breast cancer cells. Cancer research. 1987;47:5141–8. [PubMed] [Google Scholar]
- 34.Rogan AM, Hamilton TC, Young RC, Klecker RW, Jr, Ozols RF. Reversal of adriamycin resistance by verapamil in human ovarian cancer. Science. 1984;224:994–6. doi: 10.1126/science.6372095. [DOI] [PubMed] [Google Scholar]
- 35.Akiyama S, Fojo A, Hanover JA, Pastan I, Gottesman MM. Isolation and genetic characterization of human KB cell lines resistant to multiple drugs. Somat Cell Mol Genet. 1985;11:117–26. doi: 10.1007/BF01534700. [DOI] [PubMed] [Google Scholar]
- 36.Lai GM, Chen YN, Mickley LA, Fojo AT, Bates SE. P-glycoprotein expression and schedule dependence of adriamycin cytotoxicity in human colon carcinoma cell lines. Int J Cancer. 1991;49:696–703. doi: 10.1002/ijc.2910490512. [DOI] [PubMed] [Google Scholar]
- 37.Patwardhan GA, Zhang QJ, Yin D, Gupta V, Bao J, Senkal CE, et al. A new mixed-backbone oligonucleotide against glucosylceramide synthase Sensitizes multidrug-resistant tumors to apoptosis. PLoS One. 2009;4:e6938. doi: 10.1371/journal.pone.0006938. [DOI] [PMC free article] [PubMed] [Google Scholar]
- 38.Diaz JF, Strobe R, Engelborghs Y, Souto AA, Andreu JM. Molecular recognition of taxol by microtubules. Kinetics and thermodynamics of binding of fluorescent taxol derivatives to an exposed site. J Biol Chem. 2000;275:26265–76. doi: 10.1074/jbc.M003120200. [DOI] [PubMed] [Google Scholar]
- 39.Rinaldi M, Cauchi C, Gridelli C. First line chemotherapy in advanced or metastatic NSCLC. Ann Oncol. 2006;17 5:v64–7. doi: 10.1093/annonc/mdj953. [DOI] [PubMed] [Google Scholar]
- 40.Marcus AI, O'Brate AM, Buey RM, Zhou J, Thomas S, Khuri FR, et al. Farnesyltransferase inhibitors reverse taxane resistance. Cancer research. 2006;66:8838–46. doi: 10.1158/0008-5472.CAN-06-0699. [DOI] [PMC free article] [PubMed] [Google Scholar]
- 41.Diaz JF, Barasoain I, Andreu JM. Fast kinetics of Taxol binding to microtubules. Effects of solution variables and microtubule-associated proteins. J Biol Chem. 2003;278:8407–19. doi: 10.1074/jbc.M211163200. [DOI] [PubMed] [Google Scholar]
- 42.Walle UK, Walle T. Taxol transport by human intestinal epithelial Caco-2 cells. Drug Metab Dispos. 1998;26:343–6. [PubMed] [Google Scholar]
- 43.Sela S, Husain SR, Pearson JW, Longo DL, Rahman A. Reversal of multidrug resistance in human colon cancer cells expressing the human MDR1 gene by liposomes in combination with monoclonal antibody or verapamil. J Natl Cancer Inst. 1995;87:123–8. doi: 10.1093/jnci/87.2.123. [DOI] [PubMed] [Google Scholar]
- 44.Al-Hajj M, Wicha MS, Benito-Hernandez A, Morrison SJ, Clarke MF. Prospective identification of tumorigenic breast cancer cells. Proc Natl Acad Sci U S A. 2003;100:3983–8. doi: 10.1073/pnas.0530291100. [DOI] [PMC free article] [PubMed] [Google Scholar]
- 45.Gupta V, Patwardhan GA, Zhang QJ, Cabot MC, Jazwinski SM, Liu YY. Direct quantitative determination of ceramide glycosylation in vivo: a new approach to evaluate cellular enzyme activity of glucosylceramide synthase (GlcT-1) J Lipid Res. 2009 doi: 10.1194/jlr.D002949. [DOI] [PMC free article] [PubMed] [Google Scholar]
- 46.Liu YY, Yu JY, Yin D, Patwardhan GA, Gupta V, Hirabayashi Y, et al. A role for ceramide in driving cancer cell resistance to doxorubicin. Faseb J. 2008;22:2541–51. doi: 10.1096/fj.07-092981. [DOI] [PubMed] [Google Scholar]
- 47.Kessel D, Beck WT, Kukuruga D, Schulz V. Characterization of multidrug resistance by fluorescent dyes. Cancer research. 1991;51:4665–70. [PubMed] [Google Scholar]
- 48.Jang SH, Wientjes MG, Au JL. Determinants of paclitaxel uptake, accumulation and retention in solid tumors. Invest New Drugs. 2001;19:113–23. doi: 10.1023/a:1010662413174. [DOI] [PubMed] [Google Scholar]
- 49.Jang SH, Wientjes MG, Au JL. Kinetics of P-glycoprotein-mediated efflux of paclitaxel. J Pharmacol Exp Ther. 2001;298:1236–42. [PubMed] [Google Scholar]
- 50.Gottesman MM, Pastan I. Biochemistry of multidrug resistance mediated by the multidrug transporter. Annu Rev Biochem. 1993;62:385–427. doi: 10.1146/annurev.bi.62.070193.002125. [DOI] [PubMed] [Google Scholar]
- 51.Rosati A, Candussio L, Crivellato E, Klugmann FB, Giraldi T, Damiani D, et al. Bodipy-FL-verapamil: a fluorescent probe for the study of multidrug resistance proteins. Cell Oncol. 2004;26:3–11. doi: 10.1155/2004/576173. [DOI] [PMC free article] [PubMed] [Google Scholar]