

Abstract
We have identified organophosphorus agent (OP)-tyrosine adducts on 12 different proteins labeled with 6 different OP. Labeling was achieved by treating pure proteins with up to 40-fold molar excess of OP at pH 8–8.6. OP-treated proteins were digested with trypsin, and peptides were separated by HPLC. Fragmentation patterns for 100 OP-peptides labeled on tyrosine were determined in the mass spectrometer. The goals of the present work were 1) to determine the common features of the OP-reactive tyrosines, and 2) to describe non-sequence MSMS fragments characteristic of OP-tyrosine peptides. Characteristic ions at 272 amu and 244 amu for tyrosine-OP immonium ions were nearly always present in the MSMS spectrum of peptides labeled on tyrosine by chlorpyrifos oxon. Characteristic fragments also appeared from the parent ions that had been labeled with diisopropylfluorophosphate (216 amu), sarin (214 amu), soman (214 amu) or FP-biotin (227, 312, 329, 691 and 708 amu). In contrast to OP-reactive serines, which lie in the consensus sequence GXSXG, the OP-reactive tyrosines have no consensus sequence. Their common feature is the presence of nearby positively charged residues that activate the phenolic hydroxyl group. The significance of these findings is the recognition of a new binding motif for OP to proteins that have no active site serine. Modified peptides are difficult to find when the OP bears no radiolabel and no tag. The characteristic MSMS fragment ions are valuable because they are identifiers for OP-tyrosine, independent of the peptide.
Keywords: tyrosine, organophosphorus, covalent bond, mass spectrometry, characteristic ions
1. Introduction
Organophosphates (OP) have long been known to react with enzymes of the serine esterase family [1,2]. The high reactivity of acetylcholinesterase [AChE, EC 3.1.1.7] with a variety of OP is the basis for the acute toxicity of these compounds [3]. Covalent reaction of the OP with the catalytic serine of AChE inactivates the enzyme causing a myriad of cholinergic symptoms, including death [4]. Other enzymes can be covalently labeled by OP [5]. Reaction of OP with some of these may explain non-cholinergic effects of OP.
Recent studies have demonstrated that OP can also react in vitro with tyrosine on a variety of proteins [6–11]. To date, we have found OP-tyrosine adducts on 12 different proteins (transferrin, serum albumin, kinesin 3C, alpha 2-glycoprotein 1 zinc, pro-apolipoprotein A-I, keratin, tubulin, actin, ATP synthase, adenine nucleotide translocase I, chymotrypsinogen and pepsin), from 4 different species (human, cow, mouse and pig) labeled with 6 different OP (the chemical warfare agents soman and sarin, the pesticides chlorpyrifos-oxon and dichlorvos, and research compounds FP-biotin and diisopropylfluorophosphate).
Reaction of OP with tyrosine on serum albumin has been detected in vivo. Mice that were treated with 5 mg/kg of FP-biotin showed no signs of OP-toxicity, and still showed 1000-times more OP-labeled serum albumin than OP-labeled butyrylcholinesterase [BChE, EC 3.1.1.8] [12]. BChE is a classical, high-reactivity OP target. In another experiment, guinea pigs treated with either 0.5 LD50 amounts of sarin or 2–5 LD50 amounts of soman (together with medical countermeasures against intoxication) survived and were found to have substantial amounts of the OP bound to serum albumin [13].
The fact that a variety of proteins have been found to react with OP at tyrosine, coupled with the fact that this reaction can occur under relatively mild conditions in vivo, makes tyrosine an attractive candidate for a new, physiologically relevant target of OP intoxication.
To further explore the role of tyrosine as a physiological target for OP reaction, markers for the reaction products are of value.
Mass spectrometry is an excellent tool for identifying markers of protein modification. Three mass spectral features can be used for the identification: 1) the appearance of a mass in the MS spectrum that is consistent with a known peptide mass plus the mass of the modification, 2) the presence of a gap in the b-ion or y-ion sequence from an MSMS spectrum that is consistent with the mass of a modified amino acid, 3) the presence of fragments in the MSMS spectrum that are characteristic of the modification.
We have employed tandem quadrupole electrospray ionization mass spectrometry in conjunction with collision induced dissociation (CID) to study tyrosine-OP containing peptides. All three types of markers have been found. In all cases, the mass of the parent ion in the MS spectrum was consistent with the presence of the OP label. Manual analysis of the MSMS spectra from the labeled peptides often revealed gaps between b- and/or y-ions that were consistent with the mass of modified tyrosine. These gaps confirmed the presence of the OP and yielded the location of the labeled residue in the peptide sequence. Though each marker provides valuable information for the identification of modified peptides, the characteristic fragments are of particular value because they are specific identifiers for the type of modification, independent of the peptide.
The use of characteristic MSMS fragments for the detection of post-translational modifications was introduced by Huddleston for phosphorylation, glycosylation and sulfonylation [14]. Subsequently, characteristic fragments for a wide variety of modifications have been identified. Characteristic fragments are frequently immonium ions, immonium ion-derived fragments, or side chain fragments [15]. Such fragments can be used for precursor ion scanning or for post-acquisition analysis using extracted ion chromatography. Additional fragments resulting from neutral loss reactions involving the modified amino acid are also common [15].
We have found sets of characteristic fragments for tyrosine adducts with soman, sarin, chlorpyrifos-oxon, dichlorvos, FP-biotin, and diisopropylfluorophosphate. Characteristic fragments include ions that are parts of the labeled tyrosine (immonium ions and immonium ion derived fragments); ions that appear as the result of neutral loss (neutral bits of the OP that are removed from the parent ion or sequence ions); and ions that there are unique fragments of the OP itself (found for FP-biotin).
This presentation has three goals. The first goal is to describe the characteristic ions for the various OP labels, along with the frequency at which each appears and the relative intensity of the signals. The second goal is to explore the environment of the labeled peptides in an attempt to establish factors that could promote the reaction of tyrosine with OP. We have found that tyrosines which are susceptible to reaction with OP frequently lie within 6 angstroms of a positively-charged group (lysine, arginine, or histidine). This suggests that charge-charge, through-space ion-pairing may be lowering the pKa for these tyrosines, making them better nucleophiles that are more capable of reacting with OP. The third goal is to establish tyrosine as a site for reaction of OP with proteins. This is consistent with the wide distribution of proteins that contain tyrosines which react with OP.
2. Methods and Materials
The majority of the OP-labeled peptides reported in this article were taken from previously published reports, but a few were never before described. Preparation of the unreported peptides is described below.
2.1. Sample preparation for mass spectrometry
Bovine actin was purchased from Sigma (St. Louis, MO, cat# 3653). It was dissolved in 130 µl of 10 mM ammonium bicarbonate, pH 8.3, to give a final concentration of 48 µM. Then it was incubated with 48, 240 or 2400 µM chlorpyrifos-oxon (CPO) at 37°C for 24 hours. The samples were boiled for 10 minutes to denature the protein then reduced with 10 mM dithiothreitol (Fisher Biotech, Fair Lawn, NJ, cat # BP172-25, electrophoresis grade), alkylated with 50 mM iodoacetamide (Sigma cat# I6125), and dialyzed against 4 liters of 10 mM ammonium bicarbonate, pH 8.3, for 18 hours with one change of buffer. The dialyzed proteins were digested with trypsin (porcine, sequencing grade modified trypsin cat# V5113, reductively methylated, TPCK treated from Promega, Madison, WI) at 37°C overnight. This preparation was used directly for MALDI mass spectrometry. A portion of the sample was dried in a vacuum centrifuge and redissolved in 5% acetonitrile/95% water/0.1% formic acid to yield approximately 3–5 pmole of peptide/µl (assuming no losses during processing) for analysis via electrospray-ionization, tandem triple-quadrupole mass spectrometry. Labeled peptides were identified using the MALDI TOF mass spectrometer. Theoretical peak lists were generated for the masses of the tryptic peptides from actin plus the added mass of CPO. These masses were compared to the observed masses. Observed masses that matched the theoretical masses were taken as candidates for CPO labeled peptides. Peptides identified in this manner were confirmed by manual analysis of the MSMS spectrum.
Human epidermal keratin was purchased from Sigma (St Louis, MO) (cat# K0253) as a denatured mixture of keratins in 8 M urea plus 0.l mM beta-mercaptoethanol. It was renatured by dialysis against 25 mM Tris/Cl, pH 7.5 overnight [16]. Then it was treated with 2 mM CPO and analyzed in the same manner as described for bovine actin.
Human pro-apolipoprotein A-I was identified from a human serum sample. A 200 µl aliquot of serum was separated into high abundance and low abundance proteins using the Beckman Coulter Proteome IgY spin column depletion kit (Beckman Coulter, Fullerton, CA, cat# 24331). The high abundance fraction (240 µl containing 7.9 µg protein/µl) was incubated with 1.25 mM diisopropylfluorophosphate (DFP from Sigma cat# D0879) at 37°C overnight. The sample was denatured in 8 M urea, reduced with 5 mM dithiothreitol, alkylated with 40 mM iodoacetamide, dialyzed against 4 liters of 10 mM ammonium bicarbonate overnight (with two changes of buffer) and digested with trypsin (porcine, sequencing grade) at 37°C for 48 hours. The product, containing 4.4 µg protein/µl, was fractionated by strong cation exchange chromatography using a Polysulfoethyl A column (200 mm long × 2.1 mm diameter from PolyLC, Columbia, MD) on a Waters HPLC system (Waters, Milford, MA) with a 40 minute gradient starting at 100% solvent A and ending at 50% solvent A and 50% solvent B, where solvent A was 10 mM ammonium formate, pH 3.0, plus 25% acetonitrile and solvent B was 500 mM ammonium formate, pH 6.8, plus 25% acetonitrile. Fractions were dried in a vacuum centrifuge and resuspended in 5% acetonitrile/95% water/0.1% formic acid for analysis by electrospray-ionization triple-quadrupole mass spectrometry.
The preparation of the human serum samples from which the unassigned peptides were obtained, was very similar to that used for pro-apolipoprotein A-I. The first major difference was that the serum was reacted with 200 µM FP-biotin for 48 hours at 37°C. Then after denaturation, reduction, alkylation, dialysis and tryptic digestion, the FP-biotinylated peptides were extracted using monomeric avidin-agarose beads (Pierce, Rockford, IL cat# 20228). The beads were washed with 0.5 M sodium chloride in 0.1 M Tris/Cl buffer, pH 8.6, followed by 20 mM Tris/Cl, pH 7.5. The FP-biotinylated peptides were eluted with 10% acetic acid. The eluate was dried in a vacuum centrifuge and resuspended in 5% acetonitrile/95% water/0.1% formic acid in preparation for analysis by electrospray-ionization triple-quadrupole mass spectrometry. Labeled peptides were identified by extracted ion chromatography utilizing the characteristic masses of 227, 312 and 329 amu derived from FP-biotin.
2.2. MALDI mass spectrometry
Generally, 1 microliter of tryptic digest (20–50 pmole/µl, assuming no losses during processing) was air dried onto a 384 well Opti-TOF sample plate (Applied Biosystems, Foster City, CA, #1016491) and then overlaid with 1 µl of alpha-cyano-4-hydroxy cinnamic acid solution (CHCA, 10 mg/ml from Fluka cat# 70990). CHCA was recrystallized before use then dissolved to 10 mg/ml in 50% acetonitrile/50%water/0.1% trifluoroacetic acid. Mass spectra and collision induced MSMS spectra were collected in positive ion reflector mode with a MALDI TOF TOF 4800 mass spectrometer (Applied Biosystems). The final spectrum was the average of 500 laser shots. The mass spectrometer was calibrated before each use with CalMix 5 (Applied Biosystems).
2.3. Quadrupole mass spectrometry
Ten microliters of tryptic digest (30–50 pmole) were injected onto an HPLC nanocolumn (218MS3.07515 Vydac C18 polymeric reverse phase, 75 micron I.D. - 150 mm long; P.J. Cobert Assoc, St. Louis, MO). Peptides were separated with a 90 minute linear gradient from 5 to 60% acetonitrile at a flow rate of 0.3 µl/min and electrosprayed through a fused silica emitter (360 micron O.D., 75 micron I.D., 15 micron taper, New Objective, Woburn, MA) directly into the QTRAP 2000, a hybrid quadrupole linear ion trap mass spectrometer (Applied Biosystems). An ion-spray voltage of 1900 V was maintained between the emitter and the mass spectrometer. Information dependent acquisition was used to collect MS, high resolution MS, and MSMS spectra. All spectra were collected in the enhanced mode, using the trap function. The three most intense MS peaks in each cycle having masses between 200 and 1700 m/z, charge of +1 to +4, and intensities greater than 10,000 counts per second were selected for high resolution MS and MSMS analysis. Precursor ions were excluded for 30 s after one MSMS spectrum had been collected. MSMS fragmentation was obtained by collision induced dissociation (CID). The collision cell was pressurized to 40 µTorr with pure nitrogen. Collision energies between 20 and 40 eV were determined automatically by the software, based on the mass and charge of the precursor ion. The mass spectrometer was calibrated on selected fragments from the MSMS spectrum of human Glu-fibrinopeptide B (Sigma cat# F3261).
2.4. Strategies for finding OP-labeled peptides
The discovery that tyrosines could be labeled by OP arose from a general search for proteins capable of reacting with OP. The strategy for the initial part of that search was taken from Cravatt and co-workers [17,18], and employed the OP probe that they introduced (FP-biotin). One advantage of using FP-biotin as a probe is that the biotin tag allowed purification of the labeled protein. In general, the strategy consisted of the following: A crude protein preparation was labeled with 10 µM FP-biotin in pH 8.0 buffer. The labeled proteins were extracted from the crude mixture using avidin-agarose. The extracted proteins were separated by SDS PAGE. The presence of the FP-biotinylated proteins was confirmed by staining a blot of the PAGE gel with streptavidin-Alexa 680 (a fluorescent dye). Proteins present in sufficient quantity for mass spectral analysis were identified by staining a second gel with Coomassie Blue. Stained bands were cut from the gel and subjected to in-gel tryptic digestion. Finally, the tryptic digests were subjected to mass spectral analysis to identify the proteins that were present in the stained bands. This process is described in more detail by [12,19,20].
The primary difficulty with the search strategy described above is that the labeled peptides were not observed, so that proof for covalent binding of OP to proteins was indirect. Indirect evidence was acceptable for serine hydrolases, but not for proteins that had no active site serine. To find and characterize the labeled peptides, purified preparations of proteins that were identified in the initial screening were studied. This second-stage strategy consisted of the following: Purified proteins were labeled with FP-biotin. Labeled protein was proteolyzed. Labeled peptides were extracted with monomeric avidin-agarose. Finally, the peptides were subjected to mass spectral analysis. Description of this process can be found in [9,10]. In another strategy a crude preparation of human plasma was labeled with FP-biotin, digested with trypsin and the labeled peptides extracted with monomeric avidin-agarose [10,21]. With this process, labeled peptides could be successfully retrieved and characterized.
The third stage of the strategy tested the reactivity of pure proteins with OP that had no biotin tag. The OP-treated preparation was digested, and the peptides were analyzed mass spectrally. The masses of the known OP-reactive peptides plus the added mass from the new OP could be calculated and the MS spectrum searched for their presence. Characteristic ion masses provided means of searching through the MSMS data to locate peptides expected to become labeled, and to locate new peptides that might have become labeled. For most OP, the characteristic ion masses are too small and not sufficiently unique to serve as satisfactory search criteria for MSMS spectra from complex mixtures, unless a mass spectrometer of high mass accuracy is used, but they are fully adequate for searching MSMS spectra from pure protein digests. This means the protein of interest has to be purified from a complex mixture such as brain in order to find the OP-labeled peptide. Support for the conclusion that a peptide is labeled with OP on tyrosine comes from the presence in an MSMS spectrum of the characteristic OP-tyrosine immonium ions identified in this report.
3. Results and Discussion
3.1. Distribution of OP labels
We found OP-labeled tyrosines on 60 different tryptic peptides. These peptides included 2 from human transferrin; 6 from human serum albumin; 1 from human kinesin KIF3C motor domain; 4 from unidentified proteins in human plasma; 3 from human alpha 2-glycoprotein 1, zinc; 1 from human pro-apolipoprotein A-I; 4 from human keratin 1; 1 from human keratin 2; 1 from human keratin 9; 2 from human keratin 10; 1 from bovine serum albumin; 9 from bovine tubulin alpha; 7 from bovine tubulin beta; 6 from bovine actin alpha, skeletal muscle; 1 from bovine chymotrypsinogen; 5 from mouse transferrin; 1 from mouse ATP synthase; 1 from mouse adenine nucleotide translocase I; 1 from mouse tubulin beta; 1 from pig pepsin and 2 synthetic peptides (See Table 1). There were 11 peptides that contained more than one tyrosine. Of these, 6 could be labeled on more than one tyrosine, and two of those (EEY*NGY*TGAFR and LY*LGHNY*VTAIR from mouse transferrin) could be labeled on two tyrosines simultaneously, though double labeling was not always observed.
Table 1.
OP-Labeled Tyrosine-Containing Peptides Observed in Tryptic Digests
|
# |
Species | Protein | Peptide a | gi: number c |
OP d | reference |
|---|---|---|---|---|---|---|
| 1 | Human | Transferrin | KPVDEY*K | 136191 | FPB, DFP, DCV, CPO, soman |
[10] |
| 2 | Human | Transferrin | KPVEEY*ANCHLAR | 136191 | FPB, DFP, CPO, sarin, soman |
[10] |
| 3 | Human | Serum Albumin | Y*TK | 28592 | FPB, CPO, DFP | [7,13,21] |
| 4 | Human | Serum Albumin | HPY*FY*APELLFFAK | 28592 | FPB, CPO | [21] |
| 5 | Human | Serum Albumin | Y*LYEIAR | 28592 | FPB, CPO | [21] |
| 6 | Human | Serum Albumin | QNCELFEQLGEY*K | 28592 | FPB, CPO | [21] |
| 7 | Human | Serum Albumin | MPCAEDY*LSVVLNQLCLHEK | 28592 | FPB, CPO | [21] |
| 8 | Human | Serum Albumin | Y*KAAFTECCQAADK | 28592 | CPO | [21] |
| 9 | Human | Kinesin 3C motor domain 5 |
ASYY*LEIYQEEIR | 41352705 | FPB | [20] |
| 10 | Human | Serum Unknown | AY*PR | - | FPB | this work |
| 11 | Human | Serum Unknown | Y*PR | - | FPB | this work |
| 12 | Human | Serum Unknown | Y*L/IK | - | FPB | this work |
| 13 | Human | Serum Unknown | Y*K | - | FPB | this work |
| 14 | Human | α2-Glycoprotein 1, zinc |
WEAEPVY*VQR | 51094610 | FPB | [20] |
| 15 | Human | α2-Glycoprotein 1, zinc |
AY*LEEECPATLR | 51094610 | FPB | [20] |
| 16 | Human | α2-Glycoprotein 1, zinc |
YY*YDGKDYIEFNK b | 51094610 | FPB | [20] |
| 17 | Human | Pro-apolipoprotein A-I |
DY*VSQFEGSALGK | 178775 | DFP | this work |
| 18 | Human | Keratin 1 renatured | LLRDY*QELMNTK | 119395750 | CPO | this work |
| 19 | Human | Keratin 1 renatured | SGGGFSSGSAGIINY*QR | 119395750 | CPO | this work |
| 20 | Human | Keratin 1 renatured | THLEPY*FESFINNLR | 119395750 | FPB, CPO | [20] |
| 21 | Human | Keratin 1 renatured | Y*EELQITAR | 119395750 | CPO | this work |
| 22 | Human | Keratin 2 renatured | Y*LDGLTAER | 181402 | CPO | this work |
| 23 | Human | Keratin 9 renatured | QFSSSY*LSR | 435476 | CPO | this work |
| 24 | Human | Keratin 10 renatured | LKY*ENEVALR | 47744568 | CPO | this work |
| 25 | Human | Keratin 10 renatured | LASY*LDK | 47744568 | CPO | this work |
| 26 | Bovine | Serum albumin | Y*TR | 30794280 | FPB, CPO, DFP | [6] |
| 27 | Bovine | Tubulin alpha | TGTY*R | 73586894 | FPB, DFP, CPO | [9] |
| 28 | Bovine | Tubulin alpha | AFVHWY*VGEGMEEGEFSEAR | 73586894 | CPO | [23] |
| 29 | Bovine | Tubulin alpha | EDAANNY*AR | 73586894 | CPO | [23] |
| 30 | Bovine | Tubulin alpha | IHFPLATY*APVISAEK | 73586894 | CPO | [23] |
| 31 | Bovine | Tubulin alpha | FDGALNVDLTEFQTNLVPY*PR | 73586894 | CPO | [23] |
| 32 | Bovine | Tubulin alpha | GHY*TIGK | 73586894 | CPO | [23] |
| 33 | Bovine | Tubulin alpha | VGINY*QPPTVVPGGDLAK | 73586894 | CPO | [23] |
| 34 | Bovine | Tubulin alpha | FDLMY*AK | 73586894 | CPO | [23] |
| 35 | Bovine | Tubulin alpha | LSVDY*GK | 73586894 | CPO | |
| 36 | Bovine | Tubulin beta | Y*VPR | 75773583 | FPB, DFP, CPO, soman |
[9] |
| 37 | Bovine | Tubulin beta | GSQQY*R | 75773583 | FPB, DFP, CPO, sarin, soman |
[9] |
| 38 | Bovine | Tubulin beta | EEY*PDR | 75773583 | FPB, DFP, CPO | [9] |
| 39 | Bovine | Tubulin beta | Y*LTVAAVFR | 75773583 | CPO | [23] |
| 40 | Bovine | Tubulin beta | GHY*TEGAELVDSVLDVVR | 75773583 | CPO | [23] |
| 41 | Bovine | Tubulin beta | INVY*Y*NEATGGK | 75773583 | CPO | [23] |
| 42 | Bovine | Tubulin beta | NSSY*FVEWIPNNVK | 75773583 | CPO | [23] |
| 43 | Bovine | Actin alpha skeletal muscle |
GY*SFVTTAER | 62287933 | FPB, CPO | [20] this work |
| 44 | Bovine | Actin alpha skeletal muscle |
DSY*VGDEAQSK | 62287933 | FPB | [20] |
| 45 | Bovine | Actin alpha skeletal muscle |
SY*ELPDGQVITIGNER | 62287933 | CPO | this work |
| 46 | Bovine | Actin alpha skeletal muscle |
IWHHTFY*NELR | 62287933 | CPO | this work |
| 47 | Bovine | Actin alpha skeletal muscle |
QEY*DEAGPSIVHR | 62287933 | CPO | this work |
| 48 | Bovine | Actin alpha skeletal muscle |
DLTDY*LMK | 62287933 | CPO | this work |
| 49 | Bovine | Chymotrypsinogen | Y*TNANTPDR | 194674931 | FPB | [20] |
| 50 | Mouse | Transferrin | KPVDQY*EDCY*LAR | 21363012 | FPB, DFP, CPO, sarin, soman |
[10] |
| 51 | Mouse | Transferrin | LY*LGHNY*VTAIR | 21363012 | FPB, CPO | [10] |
| 52 | Mouse | Transferrin | EEY*NGY*TGAFR | 21363012 | FPB, CPO | [10] |
| 53 | Mouse | Transferrin | FDEFFSQGCAPGY*EK | 21363012 | FPB, CPO | [10] |
| 54 | Mouse | Transferrin | GY*Y*AVAVVK | 21363012 | FPB, CPO, DFP, sarin, soman |
[10] |
| 55 | Mouse | ATP Synthase | ILQDY*K | 20455479 | FPB | [20] |
| 56 | Mouse | Adenine Nucleotide Translocase I |
Y*FPTQALNFAFK | 902008 | FPB | [20] |
| 57 | Mouse | Tubulin beta | INVY*Y*NEAAGNK | 21746161 | CPO | this work |
| 58 | Porcine | Pepsin | QYY*TVFDR | 1302650 | FPB | [20] |
| 59 | Synthetic | peptide | RY*TR | CPO | [10] | |
| 60 | Synthetic | peptide | SY*SM | DCV | [10] |
Y* indicates the labeled tyrosine. For peptides showing two Y*, either one or the other tyrosine was labeled.
The position of the label is unclear for this peptide. Either the first or second Y from the N-terminus could have been labeled.
The gi number is the NCBI accession number for the protein in PubMed.
FPB= FP-biotin; CPO= chlorpyrifos oxon; DFP=diisopropyl fluorophosphate; DCV=dichlorvos
Each labeled peptide exhibited the mass expected of the OP-adduct (to within 0.1 amu). The sequence of each peptide was confirmed by manual analysis of the CID MSMS spectrum. The location of the labeled amino acid could generally be established directly from the observed sequence. Finally, characteristic, non-sequence masses were identified that supported the proposed labeling.
Proteins for which we could find no FP-biotin-labeled peptides included porcine gelatin, bovine RNase, chicken lysozyme, bovine DNase I, human IgG and bovine insulin. Our inability to find OP-labeled peptides in these pure proteins treated with a 20-fold molar excess of FP-biotin does not rule out the possibility that these proteins can be labeled by OP. For example, hen egg white lysozyme incorporates 1 mole of DFP per mole of lysozyme (on tyrosine) at pH 9.5 when the DFP concentration is in 300-fold molar excess [22]. The OP-labeled lysozyme does not lose its esterase activity with p-nitrophenyl acetate.
3.2. OP Characteristic Fragments
We employed 6 different organophosphorus agents in these studies: soman and sarin (chemical warfare agents), chlorpyrifos-oxon and dichlorvos (commercial pesticides), and FP-biotin and diisopropylfluorophosphate (research reagents). Table 2 gives the OP structures and their added masses, after the OP have made a covalent bond with tyrosine.
Table 2.
Structures of Organophosphorus Agents Bound to Tyrosine
| Structure of the added mass | Added Mass (amu) |
Organophosphorus Agent |
|---|---|---|
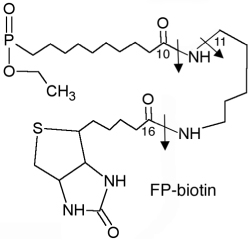 |
572 | FP-biotin |
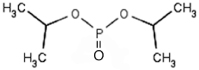 |
164 | Diisopropylfluorophosphate (DFP) |
| 136 | Chlorpyrifos-oxon (CPO) | |
| 108 | Dichlorvos (DCV) | |
| 120 | Sarin | |
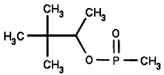 |
162 | Soman |
The arrows in the FP-biotin structure indicate fragmentation sites. A 227 amu ion is produced by cleavage between carbon 16 and the adjacent nitrogen. A 329 amu ion is produced by cleavage between carbon 10 and the adjacent nitrogen. The 312 amu ion is produced by loss of amine from the 329 amu ion.
Added mass refers to the mass of the OP that remains covalently attached to the target amino acid after the reaction is complete.
All OP were attached to the phenolic oxygen of tyrosine through the phosphorus atom.
The reaction between OP and tyrosine is illustrated in Figure 1. Soman makes a covalent bond with the phenolic oxygen of tyrosine and simultaneously releases fluoride. The reaction product has an added mass of 162 amu. The OP-tyrosine adduct is stable and does not undergo the dealkylation reaction called "aging" that is typical of soman adducts on acetylcholinesterase.
Figure 1.

Modification of tyrosine by soman to make a stable covalent bond.
Many of the 60 peptides described in Table 1 were labeled with more than one OP. Consequently, a total of 100 variously-labeled peptides could be assembled: 6 labeled with soman, 4 with sarin, 45 with chlorpyrifos-oxon, 2 with dichlorvos, 32 with FP-biotin, and 11 with diisopropylfluorophosphate. Each peptide was labeled on tyrosine. Each type of labeled tyrosine generated characteristic non-sequence ions upon low-energy, collision induced dissociation (CID) in the mass spectrometer (QTRAP 2000, Applied Biosystems). Collision energies were set at 20–60 eV and nitrogen was used as the collision gas, at 4×10⁻⁵ Torr.
The non-sequence fragments can be divided into three categories: 1) those that arise by neutral loss of a side-chain from an OP-tyrosine adduct of the parent ion or a fragment ion, 2) those that are OP-tyrosine immonium ions or derivatives of OP-tyrosine immonium ions, and 3) those that arise by fragmentation that is specific to FP-biotin (329.4, 312.4 and 227.2 amu, see Table 3 or reference [6]).
Table 3.
OP-Tyrosine Characteristic Product Ions a
| Mass amu b |
Name | Structure | Per Cent c |
Relative Intensity d |
|---|---|---|---|---|
| Dichlorvos 2 tryptic peptide analyzed | ||||
| 244.0 | dimethoxyphospho Tyr immonium | 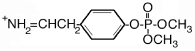 |
100 | 100 |
| Chlorpyrifos-oxon 45 tryptic peptides analyzed | ||||
| 272.3 | diethoxyphospho Tyr immonium | 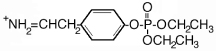 |
92 | 6–100 |
| 253.5 | diethoxyphospho Tyr immonium -NH3 | 5 | 4 | |
| 254.2 | diethoxyphospho Tyr immonium -H2O | 2 | 4 | |
| 244.3 | monoethoxyphospho Tyr immonium | 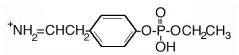 |
75 | 30–100 |
| 226.1 | monoethoxyphospho Tyr immonium -H2O | 16 | 2–38 | |
| 216.1 | phospho Tyr immonium | 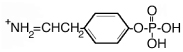 |
30 | 3–77 |
| 198.1 | phospho Tyr immonium -H2O | 2 | 16 | |
| Diisopropylfluorophosphate 11 tryptic peptides analyzed | ||||
| 328.8 | diisopropoxyphospho Tyr | 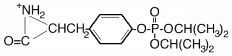 |
9 | 23 |
| 311.8 | diisopropoxyphospho Tyr -NH3 | 9 | 9 | |
| 286.2 | monoisopropoxyphospho Tyr | 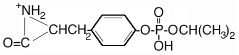 |
9 | 6 |
| 258.1 | monoisopropoxyphospho Tyr immonium | 9 | 4 | |
| 244.2 | phospho Tyr | 9 | 60 | |
| 226.0 | phospho Tyr -H2O | 18 | 8–100 | |
| 216.1 | phospho Tyr immonium | 91 | 4–100 | |
| 199.2 | phospho Tyr immonium - NH3 | 9 | 24 | |
| 198.1 | phospho Tyr immonium -H2O | 27 | 6–22 | |
| Sarin 4 tryptic peptides analyzed | ||||
| 214.1 | methylphospho Tyr immonium | 100 | 100 | |
| Soman 6 tryptic peptides analyzed | ||||
| 214.2 | methylphospho Tyr immonium | 83 | 10–95 | |
| FP-Biotin 32 tryptic peptides analyzed | ||||
| 329.4 | FPB fragment | 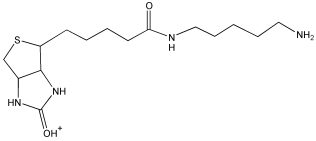 |
100 | 6–100 |
| 312.4 | FPB fragment | 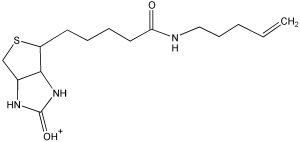 |
100 | 7–100 |
| 227.2 | FPB fragment | 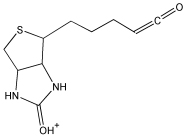 |
89 | 4–100 |
| 708.5 | Tyr-FPB immonium | 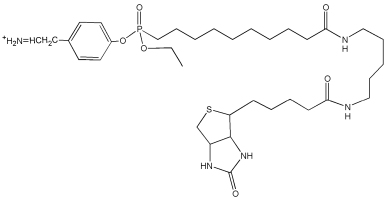 |
86 | 5–100 |
| 691.4 | Tyr-FPB immonium -NH3 | 86 | 5–80 | |
| 482.5 | Tyr-(FPB-226) immonium | 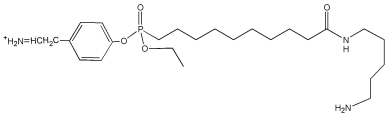 |
31 | 10–15 |
| 465.5 | Tyr-(FPB-226) immonium-NH3 | 20 | 5–20 | |
| 397.0 | Tyr-(FPB-311) immonium | 3 | 14 | |
| 380.4 | Tyr-(FPB-328) immonium | 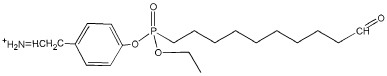 |
40 | 15–25 |
| 379.3 | Tyr-(FPB-329) immonium | 17 | 10–20 | |
| 362.8 | Tyr-(FPB-328) immonium-NH3 | 3 | 27 | |
| 355.0 | Tyr-FPB immonium (+2 charge) | 43 | 2–100 | |
| 346.5 | Tyr-FPB immonium -NH3 (+2 charge) | 20 | 10–35 | |
All masses are for the protonated, dehydro form of the amino acid.
Masses are given as the average of all measurements made from the quadrupole tandem mass spectrometer.
“Per Cent” refers to the fraction of the tryptic peptides that exhibited this mass.
“Relative intensity” is given as a range, which refers to the intensity of the mass relative to the most intense peak in the MSMS spectrum. This value is given as a percentage. Entries without a range represent masses which appeared only once, except for the 214.1 amu entry for sarin which appeared for all 3 peptides as the most intense peak of the spectrum.
3.3. Neutral loss of a side-chain from CPO, DFP, soman and sarin adducts
In the context of these experiments, neutral loss from CPO, DFP, soman and sarin refers to the loss of an alkyl side-chain from an OP-tyrosine adduct. It does not refer to loss of the entire OP from the tyrosine. None of the 100 OP-tyrosine peptide MSMS spectra we examined showed loss of the entire OP from tyrosine. In contrast, phosphorylated-tyrosine can lose the entire phosphate, though in low yield [24].
The neutral loss of alkyl side-chains from OP in the gas phase can be attributed to McLafferty rearrangement [25]. This rearrangement (Figure 2) requires the availability of a proton on a carbon atom beta to the phosphorus oxygen. Loss of the alkyl group occurs with concomitant transfer of the beta-proton to the phosphyl-oxygen, via a six-membered transition state, and formation of a carbon-carbon double bond between the alpha and beta carbons in the alkyl group. Under low-energy CID conditions, this is a facile reaction.
Figure 2.

McLafferty rearrangement of a tyrosyl-soman adduct resulting in neutral loss of the pinacolyl side chain. The pinacolyl side-chain is lost during MSMS under CID conditions. Soman-tyrosine adducts do not lose the pinacolyl group outside of the mass spectrometer.
McLafferty rearrangement is sometimes referred to as beta-elimination, by analogy with the hydroxide-catalyzed elimination of phosphate from phosphoserine and phosphothreonine in solution chemistry. McLafferty rearrangement/beta elimination is responsible for the well-documented release of phosphate from phosphoserine and phosphothreonine during CID [24]. This mechanism also provides the primary justification for why release of phosphate (or organophosphate) from phosphotyrosine is chemically unfavorable, i.e. the beta proton in phosphotyrosine is on an aromatic ring and therefore not readily released.
Most of the alkoxy side-chains on the OP given in Table 2 are susceptible to McLafferty rearrangement. Methoxy derivatives, such as are found in dichlorvos, do not have a beta-carbon and therefore are not susceptible to McLafferty rearrangement. Alkyl ligands that attach directly to the phosphorus, without the intervention of an oxygen molecule, are also not susceptible to McLafferty rearrangement, i.e. phosphonyl esters. Ligands of this latter type are found on soman and sarin (methyl) and FP-biotin (biotinylated arm).
McLafferty rearrangements generate neutral losses of 28 amu for ethoxy side-chains (CPO and FP-biotin), 42 amu for isopropoxy side-chains (DFP and sarin), and 84 amu for the pinacolyl side-chain of soman.
Neutral loss of OP side-chains was observed in two contexts. In the first context, loss was directly from the parent ion. This could be detected if the peptide was small enough for the diminished parent ion mass to fall within the mass range of the QTrap 2000 mass spectrometer (upper limit 1500 m/z). An example of this sort of neutral loss is shown in Figure 3 where a doubly-charged form of the parent ion minus the pinacolyl side-chain of the soman label can be found at 524.2 amu. A second example is found in Figure 6 where the singly-charged, DFP-labeled, YTR parent ion (603.4 amu) loses one isopropyl group (42 amu) to yield the 561.4 ion, and then a second isopropyl group (a total of 84 amu) to yield the 519.2 ion.
Figure 3.

A CID fragmentation spectrum of the soman-labeled mouse transferrin, tryptic peptide GYY*AVAVVK. The 214.1 value enclosed in the box is the mass of the methylphosphotyrosine immonium ion, the characteristic fragment for soman-labeled tyrosine. The doubly-charged parent ion at 566.5 m/z includes 162 amu from soman. Loss of the pinacolyl group results in the doubly-charged methylphosphonate parent ion at 524.2 m/z. The mass at 135.8 is the immonium ion of tyrosine. The mass at 193.0 amu is the a2 ion, also described as the GlyTyr immonium ion.
Figure 6.

A CID mass spectrum of the DFP-labeled bovine serum albumin tryptic peptide Y*TR. The 216.1 amu value enclosed in the box is the mass of the phosphotyrosine immonium ion. The singly-charged parent ion at 603.4 m/z includes 164 amu from DFP. Loss of one isopropylene yields the mass at 561.4 amu. Loss of both isopropylenes yields the mass at 519.2 amu. The tyrosine immonium ion, designated Y, has a mass of 136.1 amu.
In the second context, neutral loss was from OP-labeled tyrosine immonium ions. Loss from immonium ions was a common occurrence and is readily observable in several of the following figures.
The order of neutral loss susceptibility observed for peptides labeled with the various OP, correlated with the complexity of the alkyl chain. Thus, after CID fragmentation of soman-labeled peptides, ions carrying intact soman labels were never observed. Only masses associated with ions missing the pinacolyl group were found (see Figure 3). On the other hand, the MSMS spectra of DFP-labeled peptides showed ions carrying the intact DFP label as well as ions that had lost one or both of the isopropyl groups (see Figure 6). This distribution reflects the decreased susceptibility of the isopropoxy group to undergo neutral loss. Finally, the MSMS spectra of CPO-labeled peptides rarely showed parent ion masses consistent with the loss of an ethyl group. Loss of the ethyl group was only seen from the labeled tyrosine immonium ion which created a tyrosine-monoethylphosphate immonium ion at 244.0 amu (see Figure 5). Neutral loss of methyl was not detected from dichlorvos-labeled peptides (see Figure 7). Side-chain neutral losses have also been reported for the isolated OP, e.g. sarin, soman, cyclosarin, and analogs of DFP and CPO [26,27].
Figure 5.

A CID mass spectrum of the CPO-labeled human keratin 2 tryptic peptide Y*LDGLTAER. The values enclosed in boxes are the masses of the characteristic fragments for CPO-labeled tyrosine: diethoxyphospho-tyrosine immonium ion at 271.9, monoethoxyphospho-tyrosine immonium ion at 244.0, and phosphotyrosine immonium ion at 215.8 amu. The doubly-charged parent ion at 587.3 m/z includes 136 amu from chlorpyrifos oxon.
Figure 7.

A CID mass spectrum of the dichlorvos-labeled synthetic tryptic peptide SY*SM. The 244.3 value enclosed in the box is the mass of the dimethoxyphosphotyrosine immonium ion, the characteristic fragment for dichlorvos-labeled tyrosine. The singly-charged parent ion with a mass of 595.0 amu includes 108 amu from dichlorvos. The mass at 103.8 amu is the immonium ion of methionine.
A similar loss of the alkyl side-chain occurs when OP are bound to cholinesterases in solution. This process is referred to as aging. The gas phase side-chain loss is mechanistically distinct from the aging process and should not be confused with aging.
The observations on neutral loss can be summarized by saying that loss of a side-chain from alkoxy ligands to the phosphorus was the rule for soman-labeled tyrosine; was common for DFP- or sarin-labeled tyrosine; was constrained to tyrosine immonium ions for CPO-labeled tyrosine; and was not observed for the dichlorvos-labeled tyrosine.
3.4. OP-tyrosine immonium ions
With the exception of FP-biotinylated samples, the non-sequence masses that appeared most frequently were consistent with forms of OP-tyrosine immonium ions. This is in agreement with a recent review by Lehmann and coworkers, in which they reported that CID-generated characteristic ions (reporter ions) for peptides containing covalently modified amino acids are generally immonium ions or immonium ion-derived fragments [15]. The OP-tyrosine immonium ions and their derivatives appear in the list of characteristic ions in Table 3.
Two dichlorvos-labeled tryptic peptides were analyzed. A mass at 244 amu, consistent with the dimethoxyphospho-tyrosine immonium ion, was the most prominent peak in both MSMS spectra (see Figure 7 for an example). This mass did not contribute to the peptide sequence information. Though the 244 amu mass is identical to the mass for phospho-tyrosine, the anticipated difficulty in releasing methyl groups from methoxy-OP makes an immonium ion of dimethoxyphospho-tyrosine the more reasonable assignment.
The diethoxyphospho-tyrosine immonium ion, at 272 amu, was the most commonly observed non-sequence ion for chlorpyrifos-oxon labeled peptides. It appeared in 92% of the MSMS spectra (42 out of 45 peptides). In addition to being common, the mass was generally intense. It was the most intense ion in 7 spectra. The monoethoxyphospho-tyrosine immonium ion, at 244 amu, was nearly as abundant as the diethoxyphospho-tyrosine immonium ion, appearing in 75% of the spectra (34 out of 45 peptides). It was also intense, being the most intense ion in 2 spectra. For an example, refer to Figure 5. Though the 244 amu mass that we have taken to be the monoethoxyphospho-tyrosine immonium ion is the same as that for phospho-tyrosine, the prevalence of immonium ions in Table 3 makes the immonium ion assignment for this mass the more reasonable. Elimination of both ethyl groups to yield the phospho-tyrosine immonium ion, at a mass of 216 amu, was less common, occurring in 30% of the spectra (14 out of 45). The FP-biotin tyrosine adduct also includes an ethoxy substituent on the phosphorus, but no evidence for an FP-biotin tyrosine immonium ion with loss of the ethyl was detected (680 amu).
By far, the most common non-sequence ion seen in the spectra of the DFP-labeled peptides was the 216 amu mass attributable to the phospho-tyrosine immonium ion, i.e. loss of both isopropyl groups (see Table 3 and Figure 6). It appeared in 91% of the MSMS spectra (10 out of 11 peptides). Though its intensity varied widely, it was always at least 20% that of the most intense peak in the spectrum. On one occasion it was the most intense peak in the spectrum. Loss of a single isopropyl to generate the monoisopropoxyphospho-tyrosine immonium ion at 258 amu appeared in only 9% of the spectra (1 out of 11 peptides). The preponderance of species in which both isopropyl groups had been lost reflects the ease of eliminating the isopropyl under CID conditions. The next most common characteristic ion was the phospho-tyrosine immonium ion minus water at 198 amu, occurring in 27% of the spectra (3 out of 11). This species is a secondary fragmentation of the phospho-tyrosine immonium ion and supports the dominance of the isopropyl free form.
Tyrosine immonium ions from the four sarin-labeled peptides that were examined all had lost their isopropyl moieties (Figure 8). The resultant methylphospho-tyrosine immonium ion at 214 amu was the only non-sequence ion seen in the MSMS spectra, and it was always the most intense ion in the spectrum (see Table 3).
Figure 8.

A CID mass spectrum of the sarin-labeled mouse transferrin tryptic peptide KPVDQY*EDCYLAR. The 214.3 value enclosed in the box is the mass of the methylphosphotyrosine immonium ion, the characteristic fragment for sarin-labeled tyrosine. CAM indicates that the cysteine is carbamidomethylated. The triply-charged parent ion with 592.0 m/z includes 120 amu from sarin and 57 amu from iodoacetamide. Immonium ions for tyrosine at 136.0 and for arginine at 129.0 are indicated as Y and R.
Formation of the methylphospho-tyrosine immonium ion from soman-labeled tyrosine containing peptides was also commonplace, appearing in 83% of the MSMS spectra. However, when it did occur, the relative intensity of the peak was generally less than 20% that of the most intense peak in the spectrum (see Table 3 and Figure 3). By extrapolation of the trend developed from the smaller alkoxy ligands, one might have expected that this immonium ion would have been present for all soman-labeled peptides and that it would have dominated the spectra. A possible rationalization for the unexpected loss in prominence of the methylphospho-tyrosine immonium ion may lie in the extremely facile nature of the neutral loss of pinacolyl from the parent ion. In the same manner that facile loss of phosphate from the parent ions of phospho-peptides suppresses other fragmentation [28,29], facile loss of the pinacolyl group from the soman-labeled parent ions may suppress formation of the methylphospho-tyrosine immonium ion.
The FP-biotinylated tyrosine immonium ion, at 708.5 amu, appeared in 90% of the fragmentation spectra for FP-biotin-labeled tyrosine-containing peptides. It was generally accompanied by a 691.4 amu mass that was consistent with the loss of amine from the tyrosine-FP-biotin immonium ion (see Figure 4). Even the doubly-charged forms of these ions, at 355.0 and 346.5 amu were common, appearing in 40 and 17% of the spectra, respectively (see Table 3).
Figure 4.

A CID fragmentation spectrum of the FP-biotin labeled human alpha 2 glycoprotein 1, zinc tryptic peptide AY*LEEECPATLR. The 312.2 and 329.2 values enclosed in boxes are fragments of FP-biotin. The 708.5 and 691.6 values enclosed in boxes are the masses of the FP-biotinylated tyrosine immonium ion and of the FP-biotinylated tyrosine immonium ion minus NH3 respectively, the characteristic fragments for FP-biotin labeled tyrosine. CAM indicates that the cysteine is carbamidomethylated. The doubly-charged parent ion at 1012.7 m/z includes 572 amu from FP-biotin and 57 amu from iodoacetamide. Loss of water from the parent ion results in a mass at 1003.6 m/z. Neutral loss of a 328 amu portion of FP-biotin results in the 1696.3 amu fragment.
Observations on the OP-tyrosine immonium ions can be summarized by saying that they are major non-sequence ions in the MS/MS spectra, and that they are characteristic of OP-labeling of tyrosine.
3.5. Fragmentation specific to FP-biotin
In addition to OP-tyrosine immonium ions, fragmentation of FP-biotin labeled tyrosine yielded a unique set of ions. Elimination of the ethyl group from the ethoxy side-chain of the phosphorus was not seen. Rather, fragmentation of the amide linkages in the biotinyl side-chain of the FP-biotin generally dominated the MSMS spectrum. See Table 3 for a list of these fragments and Table 2 for a graphical presentation of the location of the break points.
An FP-biotinylated peptide is invariably multiply-charged. This appears to be due to protonation of the biotin. Thus, even two and three residue peptides are doubly-charged. Scission of FP-biotin’s alkyl chain releases the biotin end of the label, along with one charge. This generates positively-charged fragments, as well as creating a loss from the parent ion. A hallmark of FP-biotinylation on tyrosine is the presence of positively-charged fragments at 227, 312 and 329 amu [6], see Figure 4. Fragments at 329 and 312 amu appeared in 100% of the spectra, while fragments at 227 amu appeared in 89% (31 out of 35 peptides). All three fragments generally yielded very intense signals (see Table 3). The 329 amu mass was the most intense peak on 6 occasions, the 312 amu peak on 2 occasions, and the 227 amu peak on 3.
A corresponding neutral loss of 226, 311 and 328 amu from the parent ion was detected in 34%, 11% and 31% of the MSMS spectra, respectively. The 328 amu neutral loss peak always appeared as a doublet with the second peak representing loss of 329 amu. The parent ion minus 329 could be discriminated from the +1 isotopic form of the parent ion minus 328 on the basis of the relative intensities of the [M+H-328] and [M+H-329] peaks. The intensities of these two masses were always nearly equal.
Neutral loss directly from the parent ion was not observed as frequently as the corresponding positively-charged fragment ion. The parent ion minus 328 (and 329) appeared in 31% of the spectra (11 out of 35); the parent ion minus 311 appeared in 11% of the spectra (4 out of 35); and the parent ion minus 226 appeared in 34% of the spectra (12 out of 35). This can be attributed in part to the large size of the FP-biotin adduct, which has a 572 amu added mass. Since the upper mass limit for the QTrap 2000 is about1500 amu, neutral loss fragments from FP-biotinylated peptides larger than 7 residues were difficult to detect. Neutral loss fragments were occasionally accompanied by fragments consistent with loss of water (18 amu) or amine (17 amu) or carbon monoxide (28 amu).
Doubly-charged fragments corresponding to the parent ion minus 328, 329 or 226 amu were also detected, as well as fragments corresponding to loss of amine from these species. In addition, tyrosine-FPB immonium ions that had lost 329 amu to give a mass of 379 amu (17%) or 328 amu to give a mass of 380 amu (40%), 226 amu to give a mass of 482 amu (31%) were commonly seen (Table 3).
Ions at 227, 312 and 329 amu generally appear when either FP-biotinylated tyrosine or serine adducts are fragmented [6]. These three ions provide a fingerprint for FP-biotinylated peptides. Since they can be relied upon to appear as a triad and they have moderately large molecular weights, confusing this set of masses with sequence masses from the peptide is minimal. Discrimination between FP-biotinylated tyrosine and FP-biotinylated serine can also be accomplished on the basis of characteristic masses. The FP-biotinylated tyrosine immonium ions at 708 and 691 amu provide a diagnostic sub-set of masses that identify FP-biotinylated tyrosine, while a fragment at 591 amu is characteristic of FP-biotinylated serine [6]. This array of characteristic masses makes FP-biotin very useful in the discovery of unknown proteins that are susceptible to labeling by OP.
3.6. Illustration of CID Fragmentation for OP-Labeled Peptides
Figure 3 through Figure 8 show representative MSMS fragmentation spectra for peptides containing OP-labeled tyrosine. There is a spectrum for each of the six OP that were used in these studies. Fragmentation spectra from other OP-labeled, tyrosine-containing peptides can be found in the literature [6–9,21].
Figure 3 illustrates the CID fragmentation of a soman-labeled peptide. This peptide is GYY*AVAVVK from mouse transferrin, which is labeled on the second tyrosine from the N-terminus. The parent ion was doubly-charged with an m/z of 566.5 that includes an added mass of 162 amu from soman (O-pinacolyl methylphosphonate). Fragment y9 is consistent with the singly-charged parent ion less the mass of the pinacolyl side-chain (84 amu). This neutral loss leaves a methylphosphonate moiety attached to the peptide fragment (78 amu). The doubly-charged methylphosphonate parent ion was found at 524.2 amu. No fragment mass that included the O-pinacolyl methylphosphonate was detected, reflecting the extreme ease with which the pinacolyl group is eliminated under CID conditions. Fragments y1 to y9 represent the entire y-ion series, wanting only y8. Fragments y7 and y9 include the mass for the methylphosphonate as expected. The mass difference of 241.1 amu between y6 and y7 is consistent with tyrosine plus methylphosphonate (163.1 + 78 amu). A b-ion series from b3 to b7 is also present. The b3 mass, at 461.9 amu, and all subsequent b-ion masses include the mass of methylphosphonate. A tyrosine-glycine immonium ion at 193.0 amu does not include the methylphosphonate mass, indicating that the first tyrosine from the N-terminal is not labeled. This observation together with the fact that the b3-ion includes the methylphosphonate places the soman label on the second tyrosine from the N-terminal. The characteristic tyrosine methylphosphonate immonium ion appears at 214.1 amu, confirming the presence of soman on the original peptide.
Figure 4 illustrates the CID fragmentation of an FP-biotin labeled peptide. This peptide is AY*LEEECPATLR from human alpha 2 glycoprotein 1, zinc, which is labeled on the second residue from the N-terminus. The parent ion is doubly-charged with an m/z of 1012.7 that includes the 572 amu added mass from FP-biotin (10-(ethoxyphosphinyl)-N-(biotinamidopentyl) decanamide minus a proton) and a carbamidomethyl modification on cysteine (57 amu, due to alkylation by iodoacetamide). Another doubly-charged ion at 1003.6 amu is consistent with the parent ion minus water. A fragment at 1696.3 amu represents the neutral loss of a 328 amu portion of FP-biotin from the parent ion. A y-ion series from y1 to y10 is observed. The masses of all of these fragments fit the unlabeled sequence. A b-ion series from b2 to b7 is also observed. The b2 mass (807.5 amu) is consistent with the presence of alanine, tyrosine and the FP-biotin label (164 + 71 + 572 = 807 amu). Successive b-ion masses all include the mass of the FP-biotin label. Carbamidomethyl Cys (CAM; cysteine plus 57 amu, the result of alkylation of reduced cysteine with iodoacetamide) appears in both the y6 and y7 ions. Characteristic fragments of FP-biotin appear at 312.2 and 329.2 amu, while immonium ions for tyrosine FP-biotin and tyrosine FP-biotin minus amine appear at 708.5 and 691.6 amu, respectively. These are four of the most commonly observed characteristic ions from FP-biotin labeled, tyrosine-containing peptides.
Figure 5 illustrates the CID fragmentation of a chlorpyrifos-oxon labeled peptide. This peptide is Y*LDGLTAER from human keratin 2, which is labeled on the N-terminal residue. The parent ion is doubly-charged with an m/z of 587.3 that includes the 136 amu added mass from CPO (O,O-diethylphosphate). The 587.3 m/z ion is not seen in MSMS spectrum. However it was present in the MS spectrum (data not shown). Its absence from the MSMS spectrum indicates that an excessive amount of collision energy was requested by the information directed acquisition algorithm that controlled data acquisition. A y-ion series starts from 175.0 for y1 and ends at 874.1 amu for y8. Addition of 299 amu to y8, (O,O-diethylphosphate-labeled Tyr, 163 + 136 = 299 amu), yields a mass of 1173.1 amu, which is equal to the theoretical mass for the singly-charged parent ion mass (1173.6 = 587.3 × 2 − 1) This indicates the presence of the label on the N-terminus. A mass at 413.0 amu is consistent with the O,O-diethylphosphate-labeled tyrosine plus leucine, i.e. the b2-ion (164 + 136 + 113 = 413 amu), which confirms labeling of the N-terminal tyrosine. A strong signal at 385.1 amu corresponds to the labeled a2-ion. Characteristic fragments at 271.9, 244.0 and 215.8 amu are consistent with the O,O-diethylphosphate-labeled tyrosine immonium ion, the O-ethyl phosphate-labeled tyrosine immonium ion, and the tyrosine phosphate immonium ion, respectively. These are the most commonly observed characteristic ions derived from O,O-diethylphosphate-labeled, tyrosine-containing peptides and their presence fully establishes the existence of a labeled tyrosine in this peptide.
Figure 6 illustrates the CID fragmentation of a diisopropylfluorophosphate-labeled peptide. This peptide is Y*TR from bovine serum albumin, which is labeled on the N-terminal residue. The parent ion is singly-charged with an m/z of 603.4 that includes the 164 amu added mass from DFP (O,O-diisopropylphosphate). Loss of isopropylene (42 amu) yields the 561.4 amu peak, and subsequent loss of a second isopropylene yields the more intense peak at 519.2 amu, which is consistent with YTR-phosphate. These neutral losses are characteristic of a diisopropylphosphate-labeled tyrosine containing peptide. The relatively large intensities of these masses illustrate the ease with which the isopropylene is eliminated from diisopropylphosphate under CID conditions. The mass difference between 519.2 and 276.1 amu (y2) is consistent with loss of Tyr-phosphate, indicating that tyrosine was the labeled residue. Loss of 80 amu from 519.2 yields the y3 peak at 439.2 amu, which further supports labeling of the tyrosine. A complete y-ion series without phosphate is present. B2 and a2 ions that retain phosphate are seen at 345.0 and 317.0 amu, respectively. A characteristic ion at 216.1 amu, consistent with Tyr-phosphate is one of the most commonly observed characteristic ions derived from O,O-diisopropylphosphate-labeled, tyrosine containing peptides. Its presence is another strong indication of the presence of an O,O-diisopropylphosphate labeled tyrosine in the peptide.
Figure 7 illustrates the CID fragmentation of a dichlorvos-labeled peptide. This peptide is SY*SM, a synthetic peptide, which is labeled on the tyrosine. The parent ion is singly-charged with a mass of 595.0 amu that includes the 108 amu added mass from dichlorvos (O,O-dimethylphosphate). Complete y-ion and b-ion series are present. The mass difference between y2 (237.4 amu) and y3 (507.8 amu) is 271 amu, which is consistent with the presence of O,O-dimethylphosphate labeled tyrosine (163 + 108 = 271 amu), indicating that tyrosine is the labeled residue. The mass for the b2-ion (359.4 amu) is consistent with the presence of serine (N-terminal of a b-series) plus tyrosine-O,O-dimethylphosphate (88 + 163 + 108 = 359 amu), confirming that the label is on tyrosine. The majority of the remaining masses could be attributed to loss of water, amine or carbon monoxide from the fragments already described. A characteristic ion at 244.3 amu is consistent with the tyrosine-O,O-dimethylphosphate immonium ion. There is no evidence for release of methyl from the side-chain of the O,O-dimethylphosphate.
Figure 8 illustrates the CID fragmentation of a sarin-labeled peptide. This peptide is KPVDQY*EDCYLAR from mouse transferrin, which is labeled on the sixth residue from the N-terminus. The parent ion is triply-charged with an m/z of 592.0 that includes the 120 amu added mass from sarin (O-isopropyl methylphosphonate) and a carbamidomethyl modification on cysteine (57 amu). The 592.0 amu mass appeared in the MS spectrum (data not shown) but not in the MSMS spectrum. Its absence from the MSMS spectrum indicates that an excessive amount of collision energy was used during MSMS dat acquisition. A partial y-ion sequence from y1 to y6 includes one unlabeled tyrosine (y4); the mass difference between y3 and y4 is 163 (522.1 − 359.6). The b3 ion and its dehydration product are visible at 325.6 and 307.7 amu, respectively. There is no evidence for labeling of the lysine at b1. Having thus eliminated the lysine at b1 and the tyrosine at y4, the remaining tyrosine in the sequence (y8) has been assigned as the labeled residue; no other likely candidates exist in this peptide. The mass at 214.3 amu is consistent with the tyrosine-methylphosphonate immonium ion, which is a characteristic fragment for sarin labeled tyrosine. Absence of the isopropyl group from this characteristic fragment reaffirms the relative lability of the O-isopropyl moiety to fragmentation under CID conditions in the mass spectrometer.
3.7. Use of Characteristic Ions to Detect OP-Tyrosine Adducts in Unknown Samples
Characteristic ions are valuable tools for finding labeled peptides in an unknown sample, especially for those labels that yield more than one characteristic ion. The most productive strategy, in our hands, has been extracted ion chromatographic analysis of MSMS data performed after acquisition of the data. There are two major advantages to this approach. First, post acquisition analysis allows data to be taken using the trapping function of the QTrap mass spectrometer. This generally improves signal detection by 10-fold over acquisition methods that are restricted to the quadrupole mode. Second, the extracted ion algorithm in the QTrap software (Analyst) will generate separate extracted ion chromatograms for multiple ions, simultaneously. When overlaid, these chromatograms accent those MSMS spectra which include multiple characteristic ion masses, making data analysis more efficient. Once a candidate peptide has been identified, it is necessary to validate the identification by assigning the masses in the MSMS spectrum in order to determine the peptide sequence, to establish that the ions that appear to be characteristic are not part of the sequence, to locate a gap in the sequence that corresponds to a labeled amino acid, and to establish that the parent ion mass is equal to the mass of the peptide plus the mass of the label. Use of precursor ion scanning to look for peptides that generate characteristic fragments is a theoretically viable alternative to extracted ion chromatography. However, precursor ion scanning is a quadrupole function and is restricted to monitoring a single characteristic fragment per run. As such, it is less sensitive and less efficient.
3.8. OP-Reactivity of Tyrosine
Reaction of OP with tyrosine does not appear to be as specific as reaction of OP with the active site serine of the serine esterases. No consensus sequence around the labeled tyrosine was observed. Often, we were able to find multiple reactive tyrosines on a single protein. Sometimes we found more than one reactive tyrosine on a single peptide (see Table 1). Reactive tyrosines were typically on the surface of the protein, however not all surface tyrosines were reactive.
Of those tyrosines on a given protein that were reactive, one was generally much more reactive than the others. For example, five tyrosines from human serum albumin were found to react when plasma was treated with 200 µM FP-biotin at 37°C for 48 hours. However, only two labeled peptides, Y*TK and HPY*FYAPELLFFAK, were detected when 100 µM FP-biotin was incubated with 15 µM albumin at 22°C and pH 8 for 2 hours. Fifty-two percent of the YTK peptide was labeled while only 10% of the HPY*FYAPELLFFAK peptide was labeled. Thus Y*TK was the most reactive peptide on human serum albumin [21]. Support for this assignment comes from the observation that the Y*TR peptide from bovine serum albumin was the only labeled peptide detected after reaction of equimolar amounts of protein and FP-biotin (137 µM each, reacted at 37°C and pH 8.6 for 24 hours) [6].
Bovine alpha tubulin provides another example of selective reaction. Out of nine peptides that were labeled by 0.5 mM CPO (pH 8.3 for 24 hours at 37°C) only one, TGTY*R, was labeled by 0.01 mM CPO under the same conditions [23]. Bovine actin provides a third example. Out of five peptides found on incubation with 240 µM CPO, only one, GY*SFVTTAER, gave good signals with 48 µM CPO.
Such selective reaction strongly suggests that the reactive tyrosine is somehow activated. How might such activation be manifested?
3.9. Activation of tyrosine in general
Reaction of tyrosine with OP would be expected to involve nucleophilic attack by the phenolate anion of tyrosine on the phosphorus of the OP [30]. The pKa of the tyrosine phenolate is 10.1 [31]. Thus, at pH 8 only 1% of the typical tyrosine would be ionized. Activation could be manifested if the pKa value of selected tyrosines were lowered, thereby increasing the fraction of phenolate at pH 8.
Perturbation of pKa values can be accomplished by stabilizing or destabilizing the ionized component. A classical example is the increase in pKa for ionization of the second acidic group of a dicarboxylic acid [32,33]. The presence of the negative charge on the first carboxylic acid causes an unfavorable electrostatic interaction for the ionization of the second, thereby increasing its pKa. Westheimer and Kirkwood calculated that a 0.8 unit difference between pKa values for carboxyls of succinic acid corresponded to a distance between carboxylates of 5 to 6 angstroms [33].
By analogy with the carboxylate situation, the presence of a positive charge at a moderate distance from a developing anion could stabilize the anion and lower its pKa. Or, hydrogen-bond donors could stabilize a developing negative charge, thereby lowering the pKa.
This concept has been extended to enzymes. Shafer and coworkers demonstrated that when the active site cysteine of papain (Cys25) is deprotonated, the pKa of His159 increases by 4.2 units [34,35] with a comparable decrease in the pKa of Cys 25 [36]. They attributed this change to through-space, charge-charge interactions between Cys25 and His159 [36]. They argued that charge-charge interactions do not cause the decrease in nucleophilic reactivity that is seen when pKa values are perturbed by charge-dipole interactions [36]. The consequence of this change in pKa was an increase in the fraction of nucleophilic cysteine present in the active site. The 4.2 pH unit change in pKa corresponded to a distance of 3.4 angstrom between the cysteine thiol and N3 of the histidine [37].
This sort of pKa change is not limited to cysteines. Tyrosines with abnormally low pKa values are involved directly or indirectly in the catalytic activity of a number of enzymes including glutathione S-transferase [38], asparaginase [39], beta-lactamases [40], and albumin [41]. A lysine at the active center of acetoacetate decarboxylase was implicated in a 3.7 unit decrease in the pKa of a phenolic reporter group [42].
3.10. Activation of OP reactive tyrosines
In an effort to determine whether charge-charge interactions might be involved in the activation of the tyrosines that react with OP in our studies, we examined the x-ray structures for proteins on which OP-reactive tyrosines were found (Table 4). Protein structure files from the Protein Data Bank maintained by the Research Collaboratory for Structural Bioinformatics were examined using PyMOL (version 0.99rc6, DeLano, W.L. The PyMOL Molecular Graphics System, 2002, http://www.pymol.org). Forty-one tyrosines were evaluated. Two factors were considered: accessibility of the phenolic hydroxyl to solvent and the proximity of the tyrosine hydroxyl to positively charged residues. Solvent accessibility was evaluated visually using the surface feature of PyMOL. The surface that was displayed was defined by the Van der Waals surfaces of water atoms when in contact with the protein. If the phenolic hydroxyl was visible on the surface, it was considered to be solvent accessible. Positively charged groups were considered to be sufficiently close to the tyrosine hydroxyl to affect ion-pairing if they were within 6 angstroms. Choice of 6 angstrom was based on the calculations by Westheimer and Kirkwood which showed effects on the pKa of nearly 1 pK unit at this distance [33].
Table 4.
Ion-Pairing Analysis of Protein Crystal Structures: Evaluation of Interactions between OP-Labeled Tyrosines and Arginine, Lysine and/or Histidine Residues
| Peptide a | Labeled Residue b |
Exposed/ Buried c |
Ion-Pair Residue b |
Distance d Å |
|---|---|---|---|---|
| Human Serum Albumin [PDB file 1BM0, 2.50 angstrom resolution] | ||||
| There are two monomers in the unit cell for this human serum albumin structure. Measurements are given for both the alpha and beta monomers. | ||||
| Y*TK (A subunit) | Y411 | Exposed | K414 | 5.26 |
| R410 | 4.53 | |||
| Y*TK (B subunit) | Y411 | Exposed | K414 | 5.47 |
| R410 | 6.56 | |||
| HPY*FYAPELLFFAK (A subunit) | Y148 | Exposed | K106 | 5.27 |
| R197 | 3.58 | |||
| HPY*FYAPELLFFAK (B subunit) | Y148 | Exposed | K106 | 5.65 |
| R197 | 4.10 | |||
| HPYFY*APELLFFAK (A subunit) | Y150 | Exposed | H242-Nε2 | 3.81 |
| R257 | 3.75 | |||
| HPYFY*APELLFFAK (B subunit) | Y150 | Exposed | H242-Nε2 | 3.44 |
| R257 | 4.07 | |||
| MPCAEDDY*LSVVLNQLCVLHEK (A subunit) | Y452 | Exposed | K436 | 4.47 |
| K432 | 5.69 | |||
| MPCAEDDY*LSVVLNQLCVLHEK (B subunit) | Y452 | Exposed | K436 | 4.80 |
| K432 | 6.15 | |||
| QNCELFEQLGEY*K (A subunit) | Y401 | Exposed | K525 | 4.84 |
| QNCELFEQLGEY*K (B subunit) | Y401 | Exposed | K525 | 3.67 |
| Y*KAAFTECCQAADK (A subunit) | Y161 | Exposed | R117 | 8.46 |
| Y*LYEIAR (A subunit) | Y138 | Exposed | R160 | 7.89 |
| R117 | 10.06 | |||
| Note that Y140 was exposed to solvent and was 2.69 angstroms from a potential ion-pairing partner in R144, but this residue has not been found to be labeled by OP. | ||||
| Human Transferrin [PDB file 2HAV, 2.70 angstrom resolution] | ||||
| This is the structure for apo-transferrin. | ||||
| Both apo- and holo- transferrin react with OP at the same sites, and there is no effect of OP labeling on the affinity of apo-transferrin for iron. | ||||
| KPVDEY*K | Y238 | Exposed | K239 | 4.29 |
| H207-Nε2 | 4.46 | |||
| KPVEEY*ANCHLAR | Y574 | Exposed | H535-Nε2 | 4.36 |
| Human α2-Glycoprotein, zinc [PDB file 1T7V, 1.95 angstrom resolution] | ||||
| AY*LEEECPATLR | Y161 | Exposed | R73 | 5.03 |
| YY*YDGKDYIEFNK | Y118 | Exposed | K116 | 4.25 |
| R100 | 5.01 | |||
| WEAEPV*VQR | Y154 | Exposed | R157 | 5.58 |
| Note that a number of other tyrosines were within ion-pairing distance of positively charged residues, were exposed to solvent, but were not labeled by OP: Y119 was 3.23 angstroms from H95-Nδ1; Y211 was 4.97 angstroms from R183; and Y258 was 5.01 angstroms from R221. | ||||
| Bovine Tubulin alpha [PDB file 1JFF–with taxol, 3.5 angstrom resolution] | ||||
| IHFPLATY*APVISAEK | Y272 | Exposed | R320 | 4.73 |
| EDAANNY*AR | Y103 | Exposed | H107-Nε2 | 4.20 |
| H192-Nδ1 | 5.13 | |||
| GHY*TIGK | Y108 | Exposed | H107-Nε2 | 4.67 |
| FDLMY*AK | Y399 | Exposed | R402 | 2.83 |
| TGTY*R | Y83 | Exposed | R229 | 7.47 |
| AFVHWY*VGEGMEEGEFSEAR | Y408 | Buried | H406-Nε2 | 11.09 |
| FDGALNVDLTEFQTNLVPY*PR | Y262 | Exposed | H266-Nδ1 | 8.52 |
| R264 | 13.27 | |||
| VGINY*QPPTVVPGGDLAK | Y357 | Exposed | R373 | 12.75 |
| K370 | 13.04 | |||
| LSVDY*GK | Y161 | Exposed | R123 | 7.19 |
| Bovine Tubulin beta [PDB file 1JFF (with taxol), 3.5 angstrom resolution] | ||||
| GHY*TEGAELVDSVLDVVR | Y108 | Exposed | H107-Nδ1 | 4.72 |
| NSSY*FVEWIPNNK | Y342 | Exposed | R308 | 4.91 |
| EEY*PDR | Y161 | Exposed | R123 | 6.47 |
| Y*VPR | Y61 | Exposed | H28-Nδ1 | 10.57 |
| H37-Nδ1 | 10.73 | |||
| K60 | 12.92 | |||
| R64 | 12.18 | |||
| GSQQY*R | Y283 | Exposed | K218 | 11.34 |
| K372 | 15.62 | |||
| Y*LTVAAFR | Y312 | Exposed | R308 | 11.37 |
| R311 | 11.47 | |||
| INVYY*NEATGGK | Y53 | Buried | H28-Nε2 | 6.25 |
| Human Kinesin 3C motor domain [PDB file 3B6U, 1.80 angstrom resolution] | ||||
| There are two monomers in the unit cell for this human kinesin structure. Measurements are given for both the alpha and beta monomers. | ||||
| ASY*LEIYQEEIR (A subunit) | Y144 | Exposed | R201 | 4.83 |
| ASY*LEIYQEEIR (B subunit) | Y144 | Exposed | R201 | 5.07 |
| Bovine Actin alpha from skeletal muscle in complex with DNAase I [PDB file 2A42, 1.85 angstroms resolution] | ||||
| DSY*VGDEAQSK | Y53 | Exposed | K50 | 4.81 |
| K61 | 5.29 | |||
| IWHHTFY*NELR | Y91 | Exposed | H87-Nε2 | 5.06 |
| DLTDY*LMK | Y188 | Exposed | R256 | 4.32 |
| GY*SFVTTAER | Y198 | Exposed | R196 | 8.09 |
| QEY*DEAGPSIVHR | Y362 | Exposed | K359 | 6.66 |
| K118 | 9.00 | |||
| SY*ELPDGQVITIGNER | Y240 | Exposed | K215 | 6.49 |
| Porcine Pepsin [PDB file 4PEP, 1.80 angstroms resolution] | ||||
| QYY*TVFDDR | Y310 | Buried | N-Terminal | 10.93 |
| Bovine Chymotrypsinogen [PDB file 1EX3. 3.0 angstroms resolution] | ||||
| Y*TNANTPDR | Y146 | Exposed | R145 | 5.29 |
| Bovine ATP Synthase beta [PDB file 2CK3, 1.95 angstroms resolution] | ||||
| No crystal structure for mouse ATP synthase could be found. However, the sequence of the beta subunit of bovine ATP synthase is 98.2% identical to that of the mouse beta subunit. Therefore it is reasonable to use the bovine coordinates to represent the mouse protein. | ||||
| ATP Synthase beta is a component of mitochondrial membrane ATP synthase. The complete structure of the ATP synthase consists of two components, F(1) and F(0). F(0) is composed of 3 subunits (A, B, and C). F(1) is composed of 5 subunits (α, β, γ, δ, and ε in a stoichiometry of 3:3:1:1:1). The three β-subunits are designated D, E and F in the crystal structure. | ||||
| ILQDY*K (D subunit) | Y381 | Exposed (barely) |
R412d | 6.52 |
| R408 d | 2.96 | |||
| ILQDY*K (E subunit) | Y381 | Exposed | R412 e | 5.67 |
| R408 e | 2.99 | |||
| ILQDY*K (F subunit) | Y381 | Exposed | R412f | 6.56 |
| R408f | 3.44 | |||
| Mouse Adenine Nucleotide Translocase I [PDB file 2C3E, 2.80 angstroms resolution] | ||||
| No crystal structure for mouse Adenine Nucleotide Translocase I could be found. However, the sequence of bovine adenine nucleotide translocase I is 94.6% identical to that of the mouse. Therefore it is reasonable to use the bovine coordinates to represent the mouse protein. | ||||
| Y*FPTQALNFAFK | Y80 | Exposed | K22 | 10.38 |
| R78 | 11.17 | |||
| Human Apolipoprotein A-I [PDB file 2A01, 2.40 angstroms resolution] | ||||
| There are tree monomers in the unit cell for this human apolipoprotein A-I structure. | ||||
| DY*VSQFEGSALGK (A subunit) | Y29 | Exposed | K59 | 4.63 |
| DY*VSQFEGSALGK (B subunit) | Y29 | Exposed (barely) |
K59 | 4.82 |
| DY*VSQFEGSALGK (C subunit) | Y29 | Buried | K59 | 4.75 |
The asterisk (*) indicates the labeled tyrosine.
Numbering is for the mature sequence.
Exposed is defined as the phenolic oxygen of the tyrosine being visible when the surface option for the atom display is chosen in PyMOL. Buried is defined as the phenolic oxygen of the tyrosine not being visible.
Distance is defined as the space between the phenolic oxygen of the tyrosine and its ion-pair. For arginine-tyrosine ion-pairs, the shortest distance between the phenolate oxygen and the guanidinium group is taken. For histidine-tyrosine ion-pairs, the distance between the phenolate oxygen and the nearest ring nitrogen is taken.
Twenty-three of the 41 tyrosines (56%) were both solvent exposed and within 6 angstroms of a positively charged residue (Table 4). Ten of the instances in which the distance was greater than 6 angstroms came from bovine tubulin (alpha and beta). If tubulin is excluded from the analysis (sixteen tyrosines total), then 18 of the remaining 25 tyrosines (72%) were within ion-pairing distance of a positively charged residue. Exclusion of tubulin might be justified in light of the fact that the crystal structure was of the isolated alpha/beta dimer, whereas in solution tubulin is normally in some polymeric form (e.g., protofilaments or microtubules). Charge-charge interactions between residues on adjacent dimers might occur under those circumstances.
Of the seven non-tubulin tyrosines that were not within 6 angstroms of a positively charged residue, only two (that from pepsin and that from adenine nucleotide translocase) showed more than 10 angstroms of separation (Table 4). There is reason to believe that these seven residues might still enter into charge-charge interactions if the proteins were not constrained by the crystal packing. That reasoning is based on the fact that, for proteins that had more than one identical subunit in the crystal, the distances between tyrosines and their charged partners varied by up to 1 angstrom. Examples of this can be found in the measurements given in Table 4 for the human serum albumin dimer, the three beta subunits in bovine ATP synthase, the three subunits of human apolipoprotein A-I, and the dimer of human kinesin 3C. This argument is consistent with the time-honored understanding that proteins in solution undergo substantial conformational change.
Though the evidence in favor of charge-charge interaction lowering the pKa of the reactive tyrosines in order to activate them is compelling, it would be naïve to suggest that other factors may not play a role. For example, several instances where a non-reactive tyrosine was found to be 3–6 angstroms from a positively-charged residue are given in Table 4 (see human serum albumin and human α2-glycoprotein, zinc). That these residues are not reactive can be ascribed to steric constraints. An analogous situation exists for 3-nitrotyrosine, which has a pKa of 6.5. Based on its pKa, 3-nitrotyrosine was expected to react with OP. However, nitration of human serum albumin and the synthetic peptide RYGRK with peroxynitrite resulted in a preparation that showed no reactivity toward OP (PM, unpublished observations). Absence of reactivity might again be due to steric interference, this time from the vicinal nitro group.
In summary, the above correlations strongly suggest that most, if not all, OP-reactive tyrosines are activated by the nearby presence of a positively-charged residue that is capable of forming a charge-charge ion-pair with the phenolate oxygen of the tyrosine, thereby lowering the tyrosine pKa, and enhancing its nucleophilic character for reaction with the OP.
3.11. Comparison of OP-tyrosine adducts with OP-serine adducts
It is well accepted that activated serine residues, such as those found in the active sites of serine esterases and proteases, react with organophosphorus agents. Recently, it has become apparent that selected tyrosine residues will also react with organophosphorus agents. Not surprisingly, the physical properties of these two classes of organophosphorus adducts are distinct.
For example, serine adducts readily undergo beta elimination (McLafferty rearrangement in the mass spectrometer) to release the organophosphorus moiety, leaving behind a dehydroalanine in place of the original serine. We have found no evidence that OP-tyrosine adducts release the organophosphyl-moiety. As a consequence of the facile elimination of OP from serine adducts under CID conditions in the mass spectrometer, there are no characteristic fragments in the mass spectra of most OP-labeled serine containing peptides. The presence of the OP on the peptide is indicated by the mass of the parent ion and the presence of dehydroalanine in the fragmentation sequence. The relative stability of OP-tyrosine adducts during CID yields an abundance of characteristic fragments that are diagnostic for the nature of the label. These fragments in combination with the parent ion mass and the characteristic steps in the masses that define the peptide sequence provide strong evidence for the presence and nature of OP-labeled tyrosines in selected peptides.
The organophosphonate FP-biotin is unique among the OP agents in that CID fragmentation in the mass spectrometer yields characteristic masses for both labeled serine and labeled tyrosine. FP-biotinylated tyrosine yields fragments at 227, 312 and 329 amu that correspond to portions of the FP-biotin label, as well as fragments at 708 and 691 amu that correspond to the FP-biotinylated tyrosine immonium ion and its deaminated derivative. FP-biotinylated serine yields the 227, 312 and 329 amu fragments, and in addition a fragment at 591 amu that corresponds to the beta eliminated form of FP-biotin.
Another useful difference in the properties of these two OP-labeled residues concerns the process of aging. Aging is a secondary reaction of OP-labeled serine that is catalyzed by active site residues in certain serine hydrolases such as cholinesterases and serine proteases. Aging results in the hydrolysis of one of the alkoxy ligands to the phosphorus, yielding the corresponding alcohol and a hydroxyl ligand on the phosphorus [43]. OP-labeled tyrosines do not undergo this secondary reaction. This difference becomes noteworthy when trying to diagnose the type of OP agent that has reacted with a sample. For example, sarin-labeled butyrylcholinesterase and soman-labeled butyrylcholinesterase both age to give the same product, methylphosphonate labeled serine [44]. Thus the parent ion masses for the aged active site peptide from samples that were exposed to either of these agents will be the same. In principle, detection of the unaged product is possible because aging of sarin on human BChE is reasonably slow (t ½ = 6.4 hours). However, in order to take advantage of this difference, samples from exposed individuals must be taken within 24 hours of exposure and aging arrested. On the other hand, since sarin-labeled albumin and soman-labeled albumin do not age, the parent ion masses for the labeled peptides are diagnostic for the agent that was involved in the initial exposure long after the time of exposure.
4. Conclusion
The fragmentation patterns for OP-labeled tyrosine adducts described above should aid in the discovery of proteins and peptides labeled by OP. The presence of characteristic ion masses in the MSMS data provide assurance that a peptide is covalently modified on tyrosine by a particular OP.
These results illustrate the binding of OP to tyrosine on a variety of proteins. Tyrosine is a new target for OP binding, supplementing the traditional active site serine in serine esterases and proteases. As such, tyrosine constitutes a new binding motif for OP reactivity.
Acknowledgement
This work was supported by U.S. Army Medical Research and Materiel Command [W81XWH-07-2-0034 to OL]; National Institutes of Health [U01 NS058056 to OL, P30CA36727 to Eppley Cancer Center]; Direction Générale de l'Armement of the French Ministry of Defense [DGA grant 03co010-05/PEA01 08 7 to PM; DGA/PEA 08co501 to FN]; and Agence Nationale pour la Recherche [ANR-06-BLAN-0163 to FN]. Mass spectra were obtained with the support of the Mass Spectrometry and Proteomics core facility at the University of Nebraska Medical Center.
Abbreviations
- AChE
acetylcholinesterase
- amu
atomic mass unit
- BChE
butyrylcholinesterase
- CAM
carbamidomethylated
- CID
collision induced dissociation
- CPO
chlorpyrifos-oxon, O,O-diethyl-(3,5,6-trichloro-2-pyridyl) phosphate
- DCV
dichlorvos, O,O-dimethyl-(2,2-dichloroethenyl) phosphate
- DFP
diisopropylfluorophosphate, O,O-diisopropyl fluorophosphate
- FP-biotin
10-(fluoroethoxyphosphinyl)-N-(biotinamidopentyl) decanamide
- FPB
FP-biotin
- LD50
lethal dose for 50% of the population
- MSMS
tandem mass spectrometry fragmentation
- m/z
mass divided by charge
- OP
organophosphate
- sarin
O-isopropylmethylphosphonofluoridate
- SDS PAGE
sodium dodecyl sulfate polyacrylamide gel electrophoresis
- soman
O-pinacolylmethylphosphonofluoridate
Contributor Information
Lawrence M. Schopfer, Email: lmschopf@unmc.edu.
Hasmik Grigoryan, Email: hgrigoryan@berkeley.edu.
Bin Li, Email: binli@unmc.edu.
Florian Nachon, Email: fnachon@crssa.net.
Patrick Masson, Email: pmasson@unmc.edu.
Oksana Lockridge, Email: olockrid@unmc.edu.
References
- 1.Schaffer NK, May SC, Jr, Summerson WH. J Biol Chem. 1954;206:201. [PubMed] [Google Scholar]
- 2.Main AR. Pharmac Ther. 1979;6:579. [Google Scholar]
- 3.Maxwell DM, Brecht KM, Koplovitz I, Sweeney RE. Arch Toxicol. 2006;80:756. doi: 10.1007/s00204-006-0120-2. [DOI] [PubMed] [Google Scholar]
- 4.Brown MA, Brix KA. J Appl Toxicol. 1998;18:393. doi: 10.1002/(sici)1099-1263(199811/12)18:6<393::aid-jat528>3.0.co;2-0. [DOI] [PubMed] [Google Scholar]
- 5.Casida JE, Quistad GB. Chem Res Toxicol. 2004;17:983. doi: 10.1021/tx0499259. [DOI] [PubMed] [Google Scholar]
- 6.Schopfer LM, Champion MM, Tamblyn N, Thompson CM, Lockridge O. Anal. Biochem. 2005;345:122. doi: 10.1016/j.ab.2005.07.016. [DOI] [PubMed] [Google Scholar]
- 7.Li B, Schopfer LM, Hinrichs SH, Masson P, Lockridge O. Anal. Biochem. 2007;361:263. doi: 10.1016/j.ab.2006.11.018. [DOI] [PMC free article] [PubMed] [Google Scholar]
- 8.Li B, Nachon F, Froment MT, Verdier L, Debouzy JC, Brasme B, Gillon E, Schopfer LM, Lockridge O, Masson P. Chem. Res. Toxicol. 2008;21:421. doi: 10.1021/tx700339m. [DOI] [PubMed] [Google Scholar]
- 9.Grigoryan H, Schopfer LM, Thompson CM, Terry AV, Masson P, Lockridge O. Chem Biol Interact. 2008;175:180. doi: 10.1016/j.cbi.2008.04.013. [DOI] [PMC free article] [PubMed] [Google Scholar]
- 10.Li B, Schopfer LM, Grigoryan H, Thompson CM, Hinrichs SH, Masson P, Lockridge O. Toxicol Sci. 2009;107:144. doi: 10.1093/toxsci/kfn211. [DOI] [PMC free article] [PubMed] [Google Scholar]
- 11.Black RM, Harrison JM, Read RW. Arch Toxicol. 1999;73:123. doi: 10.1007/s002040050596. [DOI] [PubMed] [Google Scholar]
- 12.Peeples ES, Schopfer LM, Duysen EG, Spaulding R, Voelker T, Thompson CM, Lockridge O. Toxicol. Sci. 2005;83:303. doi: 10.1093/toxsci/kfi023. [DOI] [PubMed] [Google Scholar]
- 13.Williams NH, Harrison JM, Read RW, Black RM. Arch. Toxicol. 2007;81:627. doi: 10.1007/s00204-007-0191-8. [DOI] [PubMed] [Google Scholar]
- 14.Huddleston MJ, Annan RS, Bean MF, Carr SA. J Am Soc Mass Spectrom. 1993;4:710. doi: 10.1016/1044-0305(93)80049-5. [DOI] [PubMed] [Google Scholar]
- 15.Hung CW, Schlosser A, Wei J, Lehmann WD. Anal Bioanal Chem. 2007;389:1003. doi: 10.1007/s00216-007-1449-y. [DOI] [PubMed] [Google Scholar]
- 16.Eichner R, Kahn M. J Cell Biol. 1990;110:1149. doi: 10.1083/jcb.110.4.1149. [DOI] [PMC free article] [PubMed] [Google Scholar]
- 17.Liu Y, Patricelli MP, Cravatt BF. Proc Natl Acad Sci U S A. 1999;96:14694. doi: 10.1073/pnas.96.26.14694. [DOI] [PMC free article] [PubMed] [Google Scholar]
- 18.Kidd D, Liu Y, Cravatt BF. Biochemistry. 2001;40:4005. doi: 10.1021/bi002579j. [DOI] [PubMed] [Google Scholar]
- 19.Li H, Schopfer L, Spaulding R, Thompson CM, Lockridge O. Chem Biol Interact. 2005;157–158:383. doi: 10.1016/j.cbi.2005.10.065. [DOI] [PubMed] [Google Scholar]
- 20.Grigoryan H, Li B, Anderson EK, Xue W, Nachon F, Lockridge O, Schopfer LM. 2009 doi: 10.1016/j.cbi.2009.03.018. [DOI] [PMC free article] [PubMed] [Google Scholar]
- 21.Ding SJ, Carr J, Carlson JE, Tong L, Xue W, Li Y, Schopfer LM, Li B, Nachon F, Asojo O, Thompson CM, Hinrichs SH, Masson P, Lockridge O. Chem Res Toxicol. 2008;21:1787. doi: 10.1021/tx800144z. [DOI] [PMC free article] [PubMed] [Google Scholar]
- 22.Murachi T, Miyake T, Yamasaki N. J Biochem. 1970;68:239. doi: 10.1093/oxfordjournals.jbchem.a129351. [DOI] [PubMed] [Google Scholar]
- 23.Grigoryan H, Jiang W, Schopfer LM, Peeples ES, Duysen EG, Thompson CM, Lockridge O. 2009 doi: 10.1016/j.taap.2009.07.020. [DOI] [PMC free article] [PubMed] [Google Scholar]
- 24.Tholey A, Reed J, Lehmann WD. J Mass Spectrom. 1999;34:117. doi: 10.1002/(SICI)1096-9888(199902)34:2<117::AID-JMS769>3.0.CO;2-V. [DOI] [PubMed] [Google Scholar]
- 25.McLafferty FW. Anal Chem. 1959;31:82. [Google Scholar]
- 26.Bell AJ, Despeyroux D, Murrell J, Watts P. Int J Mass Spec Ion Processes. 1997;165/166:533. [Google Scholar]
- 27.D'Agostino PA, Hancock JR, Chenier CL, Lepage CR. J Chromatogr A. 2006;1110:86. doi: 10.1016/j.chroma.2006.01.083. [DOI] [PubMed] [Google Scholar]
- 28.Steen H, Jebanathirajah JA, Rush J, Morrice N, Kirschner MW. Mol Cell Proteomics. 2006;5:172. doi: 10.1074/mcp.M500135-MCP200. [DOI] [PubMed] [Google Scholar]
- 29.Beck A, Moeschel K, Deeg M, Haring HU, Voelter W, Schleicher ED, Lehmann R. J Am Soc Mass Spectrom. 2003;14:401. doi: 10.1016/s1044-0305(03)00122-3. [DOI] [PubMed] [Google Scholar]
- 30.Benkovic SJ, Schray KJ. In: The Enzymes. Boyer PD, editor. Vol. 8. 1973. p. 201. [Google Scholar]
- 31.Ballinger P, Long FA. J. Am. Chem. Soc. 1960;82:795. [Google Scholar]
- 32.Kirkwood J, Westheimer FH. J Chem Phys. 1938;6:506. [Google Scholar]
- 33.Westheimer FH, Kirkwood J. J Chem Phys. 1938;6 [Google Scholar]
- 34.Johnson FA, Lewis SD, Shafer JA. Biochemistry. 1981;20:52. doi: 10.1021/bi00504a600. [DOI] [PubMed] [Google Scholar]
- 35.Lewis SD, Johnson FA, Shafer JA. Biochemistry. 1976;15:5009. doi: 10.1021/bi00668a010. [DOI] [PubMed] [Google Scholar]
- 36.Roberts DD, Lewis SD, Ballou DP, Olson ST, Shafer JA. Biochemistry. 1986;25:5595. doi: 10.1021/bi00367a038. [DOI] [PubMed] [Google Scholar]
- 37.Drenth J, Jansonius JN, Koekoek R, Sluyterman LA, Wolthers BG. Philos Trans R Soc Lond B Biol Sci. 1970;257:231. doi: 10.1098/rstb.1970.0022. [DOI] [PubMed] [Google Scholar]
- 38.Atkins WM, Wang RW, Bird AW, Newton DJ, Lu AY. J. Biol. Chem. 1993;268:19188. [PubMed] [Google Scholar]
- 39.Derst C, Wehner A, Specht V, Rohm KH. Eur. J. Biochem. 1994;224:533. doi: 10.1111/j.1432-1033.1994.00533.x. [DOI] [PubMed] [Google Scholar]
- 40.Lamotte-Brasseur J, Dubus A, Wade RC. Proteins. 2000;40:23. doi: 10.1002/(sici)1097-0134(20000701)40:1<23::aid-prot40>3.0.co;2-7. [DOI] [PubMed] [Google Scholar]
- 41.Means GE, Wu HL. Arch. Biochem. Biophys. 1979;194:526. doi: 10.1016/0003-9861(79)90647-7. [DOI] [PubMed] [Google Scholar]
- 42.Kokesh FC, Westheimer FH. J Am Chem Soc. 1971;93:7270. doi: 10.1021/ja00755a025. [DOI] [PubMed] [Google Scholar]
- 43.Viragh C, Kovach IM, Pannell L. Biochemistry. 1999;38:9557. doi: 10.1021/bi991112+. [DOI] [PubMed] [Google Scholar]
- 44.Li H, Schopfer LM, Nachon F, Froment MT, Masson P, Lockridge O. Toxicol Sci. 2007;100:136. doi: 10.1093/toxsci/kfm215. [DOI] [PubMed] [Google Scholar]