

Abstract
A novel porous titanium foam implant has recently been developed to enhance biological fixation of orthopaedic implants to bone. The aim of this study was to examine the mechanical and histological characteristics of bone apposition into two different pore sizes of this titanium foam (565 and 464 micron mean void intercept length) and to compare these characteristics to those obtained with a fully porous conventionally sintered titanium bead implant. Cylindrical implants were studied in a rabbit distal femoral intramedullary osseointegration model at time zero and at 3, 6, and 12 weeks. The amount of bone ingrowth, amount of periprosthetic bone, and mineral apposition rate of periprosthetic bone measured did not differ among the three implant designs at 3, 6, or 12 weeks. By 12 weeks, the interface stiffness and maximum load of the beaded implant was significantly greater than either foam implant. No significant difference was found in the interface stiffness or maximum load between the two foam implant designs at 3, 6, or 12 weeks. The lower compressive modulus of the foam compared to the more dense sintered beaded implants likely contributed to the difference in failure mode. However, the foam implants have a similar compressive modulus to other clinically successful coatings, suggesting they are nonetheless clinically adequate. Additional studies are required to confirm this in weight-bearing models. Histological data suggest that these novel titanium foam implants are a promising alternative to current porous coatings and should be further investigated for clinical application in cementless joint replacement.
Keywords: Osseointegration, bone ingrowth, titanium foam, rabbit, push-out testing
Introduction
While traditional cementless fixation technology works well in many applications in total hip and knee arthroplasty 1–3, there are specific circumstances and applications where existing technology has been suboptimal. Specifically, cementless fixation in compromised femoral bone in the setting of total hip arthroplasty remains problematic, as is cementless fixation of the tibial component in total knee arthroplasty. Similarly there exists a need for improved osseointegration of the components in the setting of revision hip and knee surgery
Cementless fixation for both the hip and knee 4–6 has several advantages over cemented joints 7–10. Cementless fixation utilizes osseointegration, a structural connection between bone and the implant surface to achieve fixation 11. Viable bone ingrowth into a porous coated implant provides direct skeletal attachment with dynamic remodeling and repair capabilities. Extensive research has focused on understanding and enhancing bone-implant fixation. Porous coatings for joint replacement components require sufficient roughness and porosity to enhance mechanical stability through bone osseointegration. The osteoconductivity of the coatings can be improved by having interconnecting channels that allow for enhanced osseointegration. Improvements in processing techniques have provided new porous materials with both increased porosity and interconnecting channels between the pores 12–14. However, whether these new materials improve bone ingrowth and thereby implant fixation remains unknown.
For example, a novel porous titanium foam implant has recently been developed using powder metallurgy techniques to apply titanium powder onto polyurethane foam (Smith and Nephew Inc., Memphis, TN). The aim of this study was to examine the mechanical and histological characteristics of bone apposition into two different pore sizes of this material and to compare those characteristics to those obtained with a fully porous conventionally sintered titanium bead implant. Our null hypothesis was that no significant differences would exist in the mechanical and histological responses of porous foam compared to porous beaded implants.
Materials and Methods
Porous Implants
Three types of cylindrical, 5 mm diameter, 25 mm long, fully porous coated implants were investigated (Smith and Nephew Inc., Memphis, TN) (Fig. 1). The first type was a sintered monoblock of commercially pure titanium beads, with a mean void intercept length (MVIL) ± standard deviation of 117.1 ± 5.0μm and 34.3% average porosity. The titanium bead implants were produced using a cylindrical mold and 300 micron nominal diameter commercially pure titanium beads. The second implant type was a monoblock of large pore size titanium foam with a cell diameter of ~900 μm, an interconnecting pore diameter of ~300 μm (MVIL of 565.1 ± 170.6 μm), and an average porosity of 74.4%. The third implant type was a monoblock of small pore size titanium foam (cell diameter ~600 μm, interconnecting pore diameter ~200 μm (MVIL of 464.4 ± 95.4 μm), and 79.0% average porosity). MVIL and porosity measurements were determined by 2D metallography techniques. The titanium foam implants were produced by coating an open-celled polyurethane foam scaffold with layers of binder and fine spherical commercially pure titanium powder meeting ASTM F-67 requirements. The structure was then heat-treated to burn out the polymer scaffold and bind the powder together into a continuous reticulated structure. The structure is then shaped, additional powder layers are added as needed and the structures is sintered to obtain the mechanical and structural characteristics required. All implants were sintered using similar sintering cycles and cleaned, passivated and sterilized (gamma, 25–45 kGy) according to methods used for commercial product. Energy dispersive x-ray analysis of implants confirmed a lack of surface contaminants post-processing.
Figure 1.
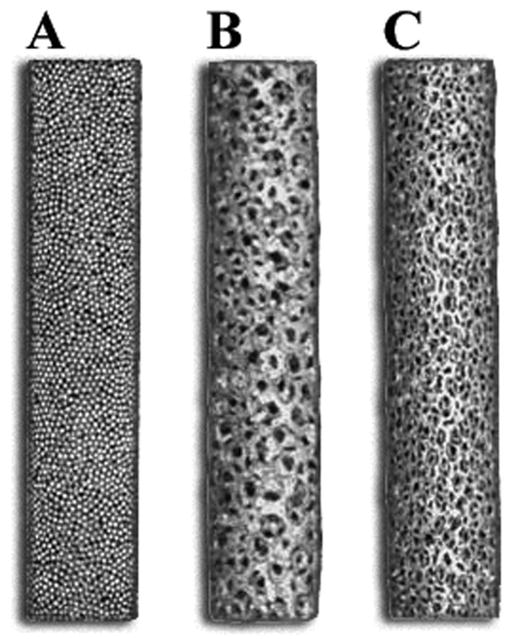
Photograph of the three types of cylindrical, 5 mm diameter, 25 mm long, fully porous coated implants investigated: sintered monoblock of commercially pure titanium beads with 34.3% average porosity (A), monoblock of large pore size titanium foam with 74.4% average porosity (B), monoblock of small pore size titanium foam with 79.0% average porosity (C).
Experimental Model
After IACUC approval, bilateral knee medial parapatellar arthrotomies were performed on 121 30-week-old New Zealand male rabbits 14–17. After anesthesia induction, access to the knee was gained via a medial parapatellar incision extending proximally and distally to expose the distal-medial aspect of the femur. Tendinous and ligamentous attachments to the medial aspect of the patella were exposed and transected to enable access to the articulating anterior surface of the distal femur. A hole was drilled at the intercondylar notch into the medullary cavity of the distal femur, using a drill bit whose diameter was 0.1mm smaller than the diameter of the implant. The hole was drilled to a depth sufficient to allow the implant to be flush with the articulating surface. The canal was reamed manually and the implant was press-fit, after which the incision was closed in two layers using standard techniques. Rabbits were allowed unrestricted cage activity post-operatively. Sixteen and 5 days prior to necropsy, rabbits were given calcein and xylenol orange, respectively, via IV injection. Euthanasia was performed in accordance with American Veterinary Medical Association guidelines, at 0, 3, 6, and 12 weeks. Time points were chosen based on previously published studies using an implant with similar dimensions in this rabbit model 15,16. Time zero data was necessary to measure the amount of bone impacted into the implant during surgery and to determine the basal mineral apposition rate of the animals.
An unpaired design with an (n=6/implant/time point), was used to examine the histological characteristics of bone apposition at four different time points: 0, 3, 6, and 12 weeks. Unfortunately, seven rabbits did not receive adequate perfusion of the fluorochrome labels, so an additional seven rabbits were included in the study to maintain an (n=6/implant/time point) for the fluorochrome analysis. This led to an increase in the sample size of some backscattered electron imaged groups from (n=6/implant/time point) to n=10 at 6 weeks and n=8 at 12 weeks for the beaded implant, and n=9 at 6 weeks and n=7 at 12 weeks for both the small and large pore foam implants.
Backscattered Electron (BSE) Imaging
Following euthanasia, the distal femurs of 43 rabbits were trimmed with a band saw and the soft tissue was dissected away. Femurs were fixed in 70% ethanol, dehydrated in ascending grades of ethanol to absolute, and cleared in xylene using an automated tissue processor (VIP Tissue Tek, Global Medical Instrumentation Inc, Ramsey, MN). The infiltration solutions and embedment in methyl methacrylate was performed according to a published technique 18. Polymerized blocks were cut into six, 2 mm-thick sections, on a water-cooled, high-speed saw, using a diamond-edged blade. The undecalcified sections were ground and polished to an optical finish using a variable-speed grinding wheel.
Six sections from each femur, totaling 516 sections, were examined in a scanning electron microscope using a backscattered electron (BSE) detector at 30X magnification and the following operating conditions: 20 mm working distance, 30 kV accelerating voltage, 200 μm aperture setting, 0.78 A filament current, and 100 nA emissions current. Six sections from each femur were analyzed with BSE for area of bone ingrowth within the porous implant and area of periprosthetic bone located within one millimeter circumferentially from the bone-implant interface (Fig. 2), using a semi-automated routine (Image J, NIH image). Additional calculations of percent void area filled with bone and percent total area filled with bone were also performed for comparison with previously reported bone ingrowth literature, utilizing BSE imaging 13,14,19–22. The percent void area filled with bone was calculated as the area occupied by bone divided by the available void space. The void space included the area occupied by bone and marrow. The percent total area filled with bone was calculated as the area of bone divided by the total space. The total space included the area occupied by implant, bone, and marrow.
Figure 2.
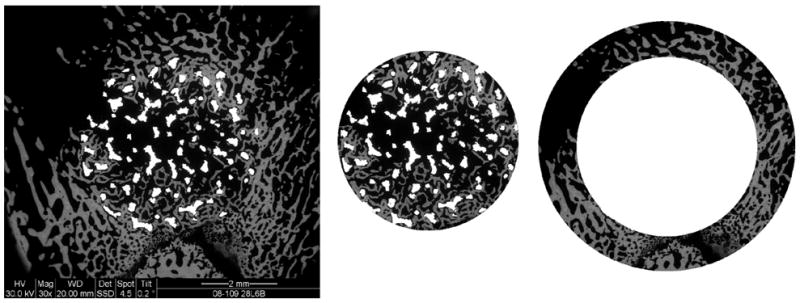
Backscattered electron images (30X) were analyzed for the area of bone ingrowth, within the implant and for the area of periprosthetic bone, one millimeter of host bone circumferentially from the bone-implant interface.
Fluorochrome Analysis
After BSE imaging, six undecalcified sections from each of the 72 femurs, totaling 432 sections, were attached to plastic slides and ground and polished to a thickness of about 70 μm. The sections were viewed at a magnification of 200X under a mercury lamp microscope for evidence of fluorochrome double-labeled trabeculae in periprosthetic and ingrown bone. Images were analyzed using a commercial histomorphometric system (Bioquant, Nashville, TN). Five measurements were made along the span of each double label and five double labels were measured for both the ingrown and periprosthetic bone of each section. The thickness of newly mineralized bone at the surface of the trabeculae was averaged along the length of the active bone-forming surface, divided by the eleven day labeling interval, and expressed in units of microns per day.
Push-out Testing
A paired study design (n=7) was used to evaluate the mechanical characteristics of the bone-implant interface for the three implant designs at 3, 6, and 12 weeks. Following necropsy, the femora were removed from the limbs and wrapped in PBS-soaked gauze, and stored frozen at 20°C until testing. Soft tissue was dissected from the femora on the day of testing. Due to the large number of samples (126 femora), testing was performed over nine loading sessions. The distal femurs of 63 rabbits were dissected and placed in a metal potting jig to align the bones and embed the distal femurs in dental cement using a previously published setup 14, resulting in a jig clearance of 0.2 mm. Push-out testing was performed using a servo-hydraulic load frame (MTS Bionics Test Machine) in displacement control at a rate of 0.1 mm/second with a 2224 N load cell. The load-displacement curves were used to determine the interface stiffness (the slope of the curve) and the load at ultimate failure.
MicroCT Failure Analysis
After push-out testing, a subset of 27 femurs (n=3/implant/time point) were imaged in a microCT (Scanner u-CT 35, Scanco Medical, Switzerland) using the following operating conditions: 70 kVp, 114 μA, integration time 300 ms, and resolution 37 μm. Reconstructions of the images were visualized using 3-D software (ZIBamira 2008, Zuse Institute Inc., Germany) to determine the mode of failure: at the bone-implant interface, in the implant (within the coating or substrate of the beaded implant and anywhere within the foam implants), or within the adjacent bone.
Statistical Analysis
Data were screened using a Shapiro-Wilk normality test. All data passed this test, and therefore were analyzed using parametric statistics. Histological data were analyzed with an ANOVA followed by pair-wise comparisons of means using an independent group Student’s t-test. For mechanical data, a paired Student t-test was performed within each time point to compare the three different implants. For multiple pair-wise comparisons, p-values were adjusted using a Tukey procedure. Analyses were performed using SAS software (SAS 9.1, Cary, NC), with significance set at p<0.05.
Results
Fifteen animals were excluded from the study due to the following complications: proximal fracture during operation (n=13), dislocation (n=1), and anesthesia (n=1). Of the thirteen fractures that occurred during or after implantation, nine were beaded implants, three were large pore foam implants, and one was a small pore foam implant. Intraoperative fractures have also been reported by other groups using implants with similar dimension in this model 15,16. The animals were replaced and therefore the power of the study was not affected by the exclusions.
Backscattered Electron (BSE) Imaging
Time zero data showed no significant differences in the area of bone impacted at surgery among the three porous implant designs (Table 1). No significant difference existed in the area of bone ingrowth measured among the three implant designs at 3, 6, or 12 weeks (Fig. 3). Histological characteristics of osseointegration were similar among the three implants, with cancellous bone distally (Fig. 4) and cortical bone proximally (Fig. 5), in direct apposition to the coatings. For all three implant designs, the area of bone ingrowth measured at 3, 6, and 12 weeks was significantly greater compared to the area of bone impacted during surgery at time zero (p<0.001). Also, the area of bone ingrowth was greater at 12 weeks than at 6 weeks in the foam implants (large pore foam: p=0.002; small pore foam: p=0.057) and beaded implant (p=0.204), although only significant in the case of the large pore foam (Table 1). Bone ingrowth was observed within the distal, middle, and proximal regions of all implants, although the middle region generally had the least area of osseointegration. A sub-analysis of the distal region, which contained the most cancellous periprosthetic host bone, gave similar findings to the results from the complete data analysis that included all three regions of the implant (proximal, middle, and distal). Time zero data indicated no significant differences in the area of periprosthetic bone at surgery among the three porous implant designs (p>0.594) (Table 2). Similarly, no significant differences in the area of periprosthetic bone were found among the three implants at 3, 6, or 12 weeks (p>0.139). In all three implant designs, the area of periprosthetic bone was greater at 3, 6, and 12 weeks in vivo compared to time zero. Although, this difference from time zero was only significant at 3 weeks in the sintered beaded implant (p=0.002) and at 3, 6, and 12 weeks in the large pore foam (p<0.009) and was approaching significance in the small pore foam at six weeks (p=0.077) (Table 2).
Table 1.
Total and regional bone ingrowth measurements from BSE imaging (mean ± standard deviation), presented as the area occupied (mm2) by bone ingrowth within the implants at time 0, 3, 6, and 12 weeks post-operation. Bone ingrowth is also calculated as a percent of the available void space (bone marrow) of the implants and as a percentage of the total area of the implant (bone marrow and titanium). Bone ingrowth at time zero indicates bone that was impacted into the implant during surgery.
| Beaded | Large pore foam | Small pore foam | Beaded | Large pore foam | Small pore foam | Beaded | Large pore foam | Small pore foam | ||||||
|---|---|---|---|---|---|---|---|---|---|---|---|---|---|---|
| Bone ingrowth (mm2) | Bone ingrowth (% void) | Bone ingrowth (% total) | ||||||||||||
| 0 | 0.1 ± 0.1 | 0.2 ± 0.1 | 0.1 ± 0.1 | 0 | 1.5 ± 0.8 | 1.7 ± 0.7 | 1.1 ± 0.7 | 0 | 0.6 ± 0.5 | 1.3 ± 0.6 | 0.8 ± 0.5 | |||
| 3 | 1.2 ± 0.6 | 1.4 ± 0.5 | 1.4 ± 0.2 | 3 | 18.3 ± 8.0 | 9.1 ± 3.1 | 9.5 ± 1.5 | 3 | 5.8 ± 2.6 | 7.1 ± 2.5 | 7.6± 1.3 | |||
| 6 | 1.3 ± 0.5 | 1.0 ± 0.3 | 1.1 ± 0.3 | 6 | 18.9 ± 8.3 | 7.7 ± 2.4 | 7.8 ± 2.5 | 6 | 6.2 ± 2.3 | 5.2 ± 1.5 | 5.9 ± 1.9 | |||
| 12 | 1.7 ± 0.3 | 1.7 ± 0.3 | 1.5 ± 0.4 | 12 | 26.6 ± 6.1 | 11.4 ± 2.5 | 10.5 ± 1.8 | 12 | 8.1 ± 1.5 | 8.8 ± 1.6 | 8.0 ± 1.7 | |||
| Bone ingrowth (mm2) | Bone ingrowth (% void) | Bone ingrowth (% total) | ||||||||||||
| Time 0 | Distal | 0.1 ± 0.2 | 0.3 ± 0.1 | 0.2 ± 0.1 | Time 0 | Distal | 1.7 ± 2.5 | 1.8 ± 1.0 | 1.5 ± 1.2 | Time 0 | Distal | 0.6 ± 0.8 | 1.4 ± 0.7 | 1.1 ± 0.8 |
| Mid | 0.1 ± 0.1 | 0.2 ± 0.2 | 0.1 ± 0.1 | Mid | 0.7 ± 0.8 | 1.5 ± 1.4 | 0.8 ± 0.8 | Mid | 0.4 ± 0.6 | 1.2 ± 1.1 | 0.6 ± 0.6 | |||
| Prox | 0.2 ± 0.2 | 0.3 ± 0.2 | 0.1 ± 0.1 | Prox | 2.2 ± 3.1 | 1.8 ± 1.1 | 1.1 ± 0.7 | Prox | 0.9 ± 1.0 | 1.4 ± 0.9 | 0.8 ± 0.5 | |||
| 3 wks | Distal | 1.7 ± 0.7 | 2.0 ± 1.2 | 2.5 ± 1.1 | 3 wks | Distal | 25.8 ± 9.4 | 12.7 ± 7.4 | 17.3 ± 7.5 | 3 wks | Distal | 8.3 ± 3.2 | 10.0 ± 6.0 | 13.9 ± 6.2 |
| Mid | 0.9 ± 0.6 | 0.9 ± 0.9 | 0.9 ± 0.5 | Mid | 13.4 ± 8.7 | 5.8 ± 6.0 | 6.3 ± 3.4 | Mid | 4.2 ± 2.7 | 4.5 ± 4.8 | 4.9 ± 2.5 | |||
| Prox | 1.0 ± 0.8 | 1.3 ± 0.7 | 0.7 ± 0.3 | Prox | 15.6 ± 11.7 | 8.8 ± 5.4 | 5.0 ± 2.2 | Prox | 5.0 ± 3.9 | 6.7 ± 3.9 | 3.9 ± 1.8 | |||
| 6 wks | Distal | 1.9 ± 1.0 | 1.9 ± 0.7 | 2.1 ± 1.1 | 6 wks | Distal | 27.6 ± 12.9 | 14.8 ± 6.1 | 15.1 ± 7.8 | 6 wks | Distal | 9.3 ± 4.8 | 9.9 ± 3.6 | 11.5 ± 5.9 |
| Mid | 1.0 ± 0.6 | 0.5 ± 0.4 | 0.6 ± 0.4 | Mid | 14.8 ± 9.6 | 3.5 ± 3.2 | 4.2 ± 2.6 | Mid | 4.7 ± 2.9 | 2.4 ± 2.1 | 3.2 ± 2.0 | |||
| Prox | 1.0 ± 0.6 | 0.6 ± 0.5 | 0.6 ± 0.2 | Prox | 14.3 ± 8.5 | 4.7 ± 3.5 | 4.0 ± 1.8 | Prox | 4.6 ± 2.6 | 3.3 ± 2.5 | 3.1 ± 1.3 | |||
| 12 wks | Distal | 1.9 ± 0.7 | 1.5 ± 1.1 | 1.7 ± 1.3 | 12 wks | Distal | 29.5 ± 12.4 | 9.8 ± 7.3 | 11.8 ± 9.0 | 12 wks | Distal | 9.1 ± 3.5 | 7.6 ± 5.8 | 8.9 ± 7.0 |
| Mid | 1.3 ± 0.6 | 1.5 ± 0.9 | 0.9 ± 0.8 | Mid | 21.3 ± 8.9 | 9.6 ± 6.5 | 6.8 ± 5.6 | Mid | 6.5 ± 2.7 | 7.4 ± 4.9 | 5.0 ± 4.0 | |||
| Prox | 1.8 ± 0.7 | 2.2 ± 1.8 | 1.9 ± 1.7 | Prox | 29.0 ± 11.3 | 14.7 ± 11.1 | 13.0 ± 11.5 | Prox | 8.7 ± 3.4 | 11.5 ± 9.5 | 10.1 ± 9.5 | |||
Figure 3.

Backscattered electron images (30X) of the three different implants: sintered beaded (A), large pore titanium foam (B), and small pore titanium foam (C) implants, at 6 weeks post-implantation.
Figure 4.

Backscattered electron images (100X) demonstrate extensive bone ingrowth after 12 weeks in all three implant designs: sintered beaded (A), large pore titanium foam (B), and small pore titanium foam (C) implants.
Figure 5.

At the proximal end of the bone, bone ingrowth originating from periprosthetic cortical bone was observed in BSE images (30X): a large pore titanium foam implant at 3 weeks post-operation (A) and a sintered beaded implant at 6 weeks post-operation (B).
Table 2.
Total and regional periprosthetic bone measurements from BSE imaging (mean ± standard deviation), presented as the area occupied (mm2) by periprosthetic bone within the implants and as a percent of the available void space (bone marrow) at time 0, 3, 6, and 12 weeks post-operation.
| Beaded | Large pore foam | Small pore foam | Beaded | Large pore foam | Small pore foam | ||||
|---|---|---|---|---|---|---|---|---|---|
| Periprosthetic bone (mm2) | Periprosthetic bone (%) | ||||||||
| 0 | 2.7 ± 1.2 | 2.3 ± 0.7 | 2.8 ± 0.6 | 0 | 14.0 ± 6.1 | 12.5 ± 3.7 | 15.3 ± 3.0 | ||
| 3 | 5.3 ± 1.5 | 4.3 ± 1.1 | 3.9 ± 0.7 | 3 | 27.7 ± 7.7 | 23.2 ± 5.9 | 21.7 ± 4.0 | ||
| 6 | 4.1 ± 0.9 | 3.8 ± 0.8 | 4.0 ± 1.3 | 6 | 21.4 ± 4.9 | 20.5 ± 4.4 | 22.0 ± 6.9 | ||
| 12 | 4.2 ± 0.9 | 4.0 ± 0.7 | 3.9 ± 0.7 | 12 | 21.9 ± 4.7 | 21.2 ± 3.8 | 21.7 ± 3.7 | ||
| Periprosthetic bone (mm2) | Periprosthetic bone (%) | ||||||||
| Time 0 | Distal | 4.5 ± 2.7 | 4.4 ± 1.8 | 4.0 ± 1.4 | Time 0 | Distal | 23.7 ± 14.1 | 24.0 ± 9.2 | 22.1 ± 7.8 |
| Mid | 1.0 ± 1.1 | 0.9 ± 0.9 | 1.2 ± 0.8 | Mid | 5.1 ± 5.5 | 4.7 ± 4.8 | 6.5 ± 4.0 | ||
| Prox | 2.5 ± 2.0 | 1.6 ± 1.9 | 3.2 ± 1.9 | Prox | 13.3 ± 10.5 | 8.8 ± 10.1 | 17.4 ± 10.3 | ||
| 3 wks | Distal | 6.3 ± 2.5 | 5.5 ± 3 | 7.1 ± 2.1 | 3 wks | Distal | 33.2 ± 13.0 | 29.4 ± 16.5 | 39.4 ± 11.4 |
| Mid | 2.7 ± 2.4 | 2.1 ± 2.2 | 0.9 ± 0.8 | Mid | 14.1 ± 12.9 | 11.1 ± 11.4 | 4.9 ± 4.5 | ||
| Prox | 6.8 ± 3.4 | 5.5 ± 2.6 | 3.8 ± 2.0 | Prox | 35.8 ± 18.0 | 29.0 ± 13.0 | 20.8 ± 11.1 | ||
| 6 wks | Distal | 6.0 ± 3.2 | 5.5 ± 2.7 | 5.5 ± 3.2 | 6 wks | Distal | 31.5 ± 16.7 | 29.0 ± 14.4 | 29.9 ± 17.5 |
| Mid | 1.7 ± 1.3 | 0.9 ± 0.9 | 1.4 ± 1.2 | Mid | 8.7 ± 6.9 | 4.9 ± 4.8 | 7.5 ± 6.4 | ||
| Prox | 4.6 ± 2.8 | 5.1 ± 3.2 | 5.2 ± 3.4 | Prox | 23.9 ± 14.5 | 27.7 ± 17.5 | 28.6 ± 18.4 | ||
| 12 wks | Distal | 5.0 ± 2.2 | 5.1 ± 2.3 | 5.1 ± 1.7 | 12 wks | Distal | 26.4 ± 11.8 | 27.1 ± 12.1 | 28.1 ± 9.8 |
| Mid | 1.9 ± 1.4 | 2.1 ± 1.2 | 1.6 ± 1.2 | Mid | 9.8 ± 7.5 | 11.1 ± 6.6 | 8.7 ± 6.4 | ||
| Prox | 5.7 ± 3.1 | 4.7 ± 2.8 | 5.1 ± 2.9 | Prox | 29.5 ± 16.1 | 25.5 ± 15.0 | 28.2 ± 15.3 | ||
Fluorochrome Analysis
A significantly greater MAR was measured in the bone ingrowth compared to the periprosthetic bone of the small (p=0.004) and large pore (p=0.037) foam implants at 12 weeks (Fig. 6). No significant differences were found in the MAR of bone impacted into the porous coating at surgery between the three porous implant designs (Table 3), or in the MAR of bone ingrowth after 3 or 12 weeks. However, at 6 weeks, the MAR of the bone ingrowth was significantly greater in both the small (p=0.006) and large (p=0.019) foam implants compared to the sintered beaded implant. The MAR of bone ingrowth was greater after 3 weeks compared to the MAR measured in bone impacted into the porous implants. This difference was only significant for the small pore foam implants, where the bone ingrowth MAR measured at 3 (p=0.001) and 6 (p=0.019) weeks was significantly greater compared to the MAR of bone impacted at time zero. Also, no significant difference was found in the MAR of the periprosthetic bone measured among the three implant designs at 0, 3, 6, or 12 weeks (Table 3). The MAR of periprosthetic bone was greater after 3 weeks compared to time zero for the sintered beaded (p=0.014) and foam (p<0.001) implants.
Figure 6.
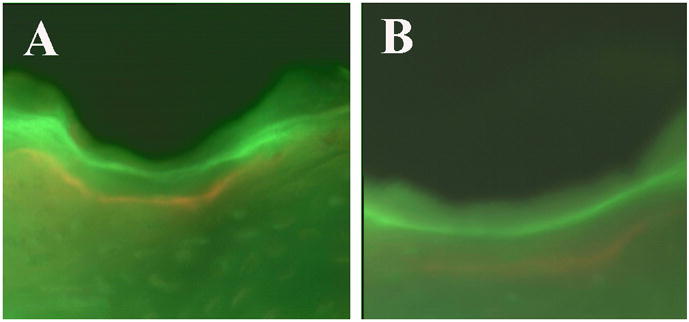
Fluorescent microscopy images (200X) were used to measure the mineral apposition rate. The fluorochrome labels, calcein (green) and xylenol orange (orange) can be observed near the metallic implant (black) at six weeks in a large pore titanium foam implant (A) and in a sintered beaded implant (B).
Table 3.
Total and regional mineral apposition rate (MAR) measurements from fluorescent microscopy (mean ± standard deviation) of bone ingrowth and periprosthetic bone presented in micron per day at time 0, 3, 6, and 12 weeks post-operation.
| Beaded | Large pore foam | Small pore foam | Beaded | Large pore foam | Small pore foam | ||||
|---|---|---|---|---|---|---|---|---|---|
| MAR bone ingrowth (μm/day) | MAR periprosthetic bone (μm/day) | ||||||||
| 0 | 2.2 ± 1.0 | 1.9 ± 0.7 | 3.0 ± 0.6 | 0 | 2.3 ± 0.9 | 2.3 ± 0.5 | 3.1 ± 0.2 | ||
| 3 | 2.7 ± 0.6 | 3.4 ± 0.3 | 3.4 ± 0.7 | 3 | 3.2 ± 0.3 | 3.4 ± 0.3 | 3.1 ± 0.4 | ||
| 6 | 2.1 ± 0.2 | 2.9 ± 0.4 | 2.8 ± 0.5 | 6 | 2.6 ± 0.2 | 2.7 ± 0.3 | 2.7 ± 0.3 | ||
| 12 | 2.3 ± 0.4 | 2.7 ± 0.5 | 2.5 ± 0.4 | 12 | 2.5 ± 0.3 | 2.0 ± 0.4 | 2.0 ± 0.4 | ||
| MAR bone ingrowth (μm/day) | MAR periprosthetic bone (μm/day) | ||||||||
| Time 0 | Distal | 1.8 ± 0.6 | 2.2 ± 0.8 | 3.1 ± 0.6 | Time 0 | Distal | 2.2 ± 0.9 | 2.1 ± 0.6 | 2.8 ± 0.5 |
| Mid | 1.5 ± 0.0 | 1.1 ± 0.6 | 2.3 ± 0.0 | Mid | 2.4 ± 1.0 | 2.3 ± 0.8 | 3.0 ± 1.0 | ||
| Prox | 2.4 ± 1.4 | 1.6 ± 0.0 | 3.8 ± 0.3 | Prox | 2.8 ± 1.3 | 2.4 ± 0.9 | 3.4 ± 0.9 | ||
| 3 wks | Distal | 3.4 ± 1.1 | 3.5 ± 0.9 | 3.2 ± 0.8 | 3 wks | Distal | 3.6 ± 1.1 | 3.6 ± 0.6 | 3.6 ± 1.0 |
| Mid | 2.3 ± 0.7 | 2.5 ± 0.9 | 3.8 ± 1.6 | Mid | 3.1 ± 1.0 | 3.3 ± 0.6 | 2.6 ± 0.6 | ||
| Prox | 2.4 ± 0.9 | 3.2 ± 1.2 | 3.6 ± 0.6 | Prox | 2.9 ± 0.7 | 3.2 ± 0.8 | 3.0 ± 0.5 | ||
| 6 wks | Distal | 2.0 ± 0.6 | 3.4 ± 0.6 | 3.1 ± 0.7 | 6 wks | Distal | 2.5 ± 0.6 | 3.0 ± 0.7 | 2.7 ± 0.6 |
| Mid | 2.3 ± 0.5 | 2.3 ± 0.4 | 2.6 ± 0.8 | Mid | 2.8 ± 0.7 | 2.7 ± 0.5 | 2.8 ± 0.5 | ||
| Prox | 2.0 ± 0.5 | 2.7 ± 0.5 | 2.9 ± 0.9 | Prox | 2.5 ± 0.8 | 2.3 ± 0.5 | 3 ± 0.6 | ||
| 12 wks | Distal | 2.4 ± 0.7 | 2.7 ± 0.7 | 2.3 ± 0.6 | 12 wks | Distal | 2.6 ± 0.5 | 2.2 ± 0.9 | 1.8 ± 0.3 |
| Mid | 2.4 ± 0.6 | 2.9 ± 0.8 | 2.6 ± 0.6 | Mid | 2.4 ± 0.5 | 2.2 ± 0.5 | 2.2 ± 1.0 | ||
| Prox | 2.1 ± 0.8 | 2.5 ± 0.6 | 2.6 ± 0.8 | Prox | 2.5 ± 0.5 | 1.7 ± 0.4 | 2.1 ± 0.6 | ||
Push-out Testing
After 6 weeks in vivo the interface stiffness of the sintered beaded implant was 61% greater than the large pore foam (p=0.020) and 79 % greater than the small pore foam (p=0.014) (Table 4). After 12 weeks in vivo the stiffness of the beaded implant was 57% greater than the large pore foam (p=0.033) and 75 % greater than the small pore foam (p=0.012). No significant difference in stiffness existed between the two foam implants at any of the three time points. The maximum load of the beaded implant was 36% greater after 3 weeks than the large pore foam, although the difference was not significant (p=0.086). By 12 weeks, the maximum load of the beaded implant was 105% greater than the large pore foam (p=0.003) and 79% greater compared than the small pore foam (p=0.047) (Table 4). No significant difference in maximum load existed between the two foams at any of the three time points. In general, interface stiffness and maximum load increased over the course of the experiment in all three types of implants. The stiffness at 12 weeks was greater than at 3 weeks for the beaded (p=0.007) and large pore foam (p=0.065) implants. The maximum load was also greater after 12 weeks than at 3 weeks in the beaded (p<0.001) and large pore foam (p=0.025) implants (Table 4).
Table 4.
Pushout testing results (mean ± standard deviation) for interface stiffness and maximum load at 3, 6, and 12 weeks for the beaded, large pore foam, and small pore foam implants.
| Beaded vs Large pore foam | Beaded vs Small pore foam | Large pore foam vs Small pore foam | ||||
|---|---|---|---|---|---|---|
| Beaded | Large pore | Beaded | Small pore | Large pore | Small pore | |
| Interface Stiffness (N/mm) | ||||||
| 3 weeks | 1264 ± 537 | 1043 ± 389 | 1103 ± 643 | 784 ± 411 | 905 ± 435 | 722 ± 509 |
| 6 weeks | 1726 ± 812 | 1075 ± 344* | 1562 ± 412 | 873 ± 428* | 1200 ± 396 | 976 ± 624 |
| 12 weeks | 2272 ± 871 | 1449 ± 438* | 1706 ± 477 | 977 ± 465* | 1250 ± 585 | 891 ± 502 |
| Max Load (N) | ||||||
| 3 weeks | −514 ± 124 | −379 ± 139 | −389 ± 199 | −439 ± 99 | −500 ± 139 | −516 ± 202 |
| 6 weeks | −772 ± 498 | −548 ± 187 | −776 ± 250 | −539 ± 185 | −511 ± 137 | −570 ± 275 |
| 12 weeks | −1196 ± 379 | −583 ± 224* | −1044 ± 458 | −584 ± 179* | −638 ± 157 | −592 ± 214 |
Note an (*) asterisk denotes a significant difference between paired groups within a time point (p<0.05).
MicroCT failure mode analysis
Failure occurred at the bone-implant interface in 8 of 9 sintered beaded implants (3 each at 3 and 12 weeks and 2 at 6 weeks). At 6 weeks, one beaded implant exhibited failure within the bone. One third of both foam implant types failed as a result of crushing of the metal at the proximal end of the specimen during push-out testing. For the large pore foam implants at 3 weeks, one had proximal failure in the implant and distal failure in the bone; one had proximal failure at the implant and distal failure at the bone-implant interface, and one failed at the bone-implant interface. At 6 weeks, one large pore foam specimen failed in the implant and two failed at the bone-implant interface. At 12 weeks, one specimen failed at the bone-implant interface, one specimen failed in the implant and the third specimen failed distally at the bone and proximally at the bone-implant interface. For the small pore foam implants at 3 weeks, failure occurred in two specimens at the bone-implant interface; failure could not be determined for one specimen because the microCT scan was corrupted. At 6 weeks, one small pore foam specimen failed in the implant, one specimen failed at the bone-implant interface, and one specimen failed distally at the bone and proximally at the bone-implant interface. At 12 weeks, in the small pore foam implants, failure occurred in two specimens at the bone-implant interface and in one specimen in the implant (Fig. 7).
Figure 7.
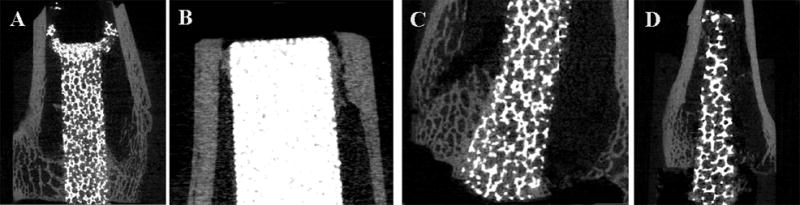
MicroCT images used to determine mode of failure after push-out testing. Crushing of the metal implant proximally occurred during push-out testing in a small pore titanium foam implant at 6 weeks (A). During push-out testing, a sintered beaded implant failed proximally within the bone (B) and a small pore titanium foam implant failed distally within the bone; both had been in vivo for 6 weeks. A large pore titanium foam implant in vivo for 12 weeks, failed at the bone-implant interface (D) during push-out testing.
Discussion
The BSE imaging and fluorochrome analysis data supported the null hypothesis. The histological response to bone apposition was not significantly different between the sintered beaded implants and the two different titanium foam implants. The MAR of bone ingrowth and periprosthetic bone was greater after 3 weeks than at time zero, likely due to the regional acceleratory phenomenon reported by Frost 23, which suggests that injury and healing factors initiated by the trauma of surgery and implant placement influences the bone response.
The push-out testing data did not support the null hypothesis; the mechanical response to bone apposition was significantly greater in the sintered beaded implants than in the titanium foam implants. After 12 weeks in vivo, the interface stiffness and maximum load of the sintered beaded implant was significantly greater than either of the foam implants. The greater interface stiffness and maximum load suggest that at 12 weeks the sintered beaded implants were more stable within the bone prior to onset of interface failure than the titanium foam implants. No differences in interface stiffness or maximum load were found between the two different foam implants at any of the time points in the study, suggesting the difference in pore size between the two titanium foams did not affect the mechanical response. The failure mode of the foam implants suggests that push-out testing may not have been the most appropriate method to compare mechanical characteristics of bone apposition between the implants, due to the difference in compressive modulus 24,25 between the foam implants (~3 GPa) and the more dense sintered beaded implants (~10 GPa) 26.
A limitation of the current study is that the lapine distal femoral intramedullary implant model is not a weight bearing model 14–17 and is therefore inadequate to determine the long-term outcome of a load bearing implant. However, the model provides valuable information about the initial host response to a porous implant. Also in this intramedullary model, the proximal end of the implant is against cortical bone in a load sharing situation that the foam implants were never intended to experience, unlike the stiffer beaded surface. Therefore, comparing the foam implants to the beaded implants in the proximal region had the potential to skew the results for the entire specimen. However, a subanalysis conducted only for the distal region yielded similar histological results to those including all three regions (proximal, middle, and distal).
Using this animal model, Deglurkar et al. 14 recently reported that the distal region of trabecular tantalum metal implants (Zimmer, Warsaw IN) with similar dimensions and geometry had a median percent bone ingrowth compared to the void space at 4 weeks of (10.4%), 8 weeks (7.8%), and 12 weeks (12.3%) 14, which was similar to our results for the titanium foam implants. At 12 weeks trabecular tantalum metal implants had comparable average push-out values for load (−900 to −740N) and interface stiffness (~1750 ± 500 N/mm) 14 to titanium foam implants we measured though, the stiffness of our foam implants were at the lower range of what was reported for the trabecular metal implants.
Unlike the present study where failure occurred within the titanium foam coating, the failure mode reported for the trabecular metal implants was within the bone. This difference in failure mode may be attributed to the increased porosity of the titanium foam implants (74.4% and 79.0%) compared to the trabecular metal (66%) 14; however, both titanium foam implants (~3 GPa) 26 have a similar compressive modulus to that reported for trabecular tantalum coatings (~2.5 to 3.9GPa) 13,27. Although, the failure mode analysis of the trabecular metal 14 may have been limited in that it was conducted on methyl methacrylate embedded sections. This method might introduce preparation artifact and does not allow for analysis of the intact specimen following push-out testing, neither of which are limitations with microCT imaging.
Conclusions
These data suggest that in this animal model, the mechanical and histological characteristics of bone apposition into the titanium foam implants were comparable to that of trabecular metal implants. Also, our data demonstrate that bone apposition with the two titanium foam implant designs were similar to that of a clinically successful porous coating sintered titanium beads. Although the mechanical characteristics of the porous titanium foam implants were inferior to the sintered beaded implants in push-out testing, the similar compressive modulus to trabecular tantalum coatings, suggests that these porous implants are nonetheless clinically adequate. Additional studies with the titanium foam coating material bonded to a rigid metal substrate are required to confirm this in weight-bearing models. Histological data from our study suggests that these novel titanium foam implants are a promising alternative to current porous implants and should be further investigated for clinical application in cementless joint replacement.
Acknowledgments
The authors wish to thank Ms. Jane Han and Ms. Turya Nair for their technical expertise and assistance with the fluorochrome analysis. Additionally, the authors thank Dr. Jean Welter for allowing us to borrow her push-out testing jig. We also thank Marcus Scott, Carie Alley, and Laura Gilmour from Smith and Nephew Inc., Memphis, Tennessee for their assistance. This study utilized the facilities of the Musculoskeletal Repair and Regeneration Core Center (NIH AR046121).
References
- 1.Collier JP, Mayor MB, Chae JC, Surprenant VA, Surprenant HP, Dauphinais LA. Macroscopic and microscopic evidence of prosthetic fixation with porous-coated materials. Clin Orthop Relat Res. 1988;(235):173–80. [PubMed] [Google Scholar]
- 2.Cook SD, Thomas KA, Haddad RJ., Jr Histologic analysis of retrieved human porous-coated total joint components. Clin Orthop Relat Res. 1988;(234):90–101. [PubMed] [Google Scholar]
- 3.Pidhorz LE, Urban RM, Jacobs JJ, Sumner DR, Galante JO. A quantitative study of bone and soft tissues in cementless porous-coated acetabular components retrieved at autopsy. J Arthroplasty. 1993;8(2):213–25. doi: 10.1016/s0883-5403(09)80015-6. [DOI] [PubMed] [Google Scholar]
- 4.Sumner DR, Kienapfel H, Jacobs JJ, Urban RM, Turner TM, Galante JO. Bone ingrowth and wear debris in well-fixed cementless porous-coated tibial components removed from patients. J Arthroplasty. 1995;10(2):157–67. doi: 10.1016/s0883-5403(05)80122-6. [DOI] [PubMed] [Google Scholar]
- 5.Hofmann AA, Bloebaum RD, Bachus KN. Progression of human bone ingrowth into porous-coated implants. Rate of bone ingrowth in humans. Acta Orthop Scand. 1997;68(2):161–6. doi: 10.3109/17453679709004000. [DOI] [PubMed] [Google Scholar]
- 6.Whiteside LA. Long-term followup of the bone-ingrowth Ortholoc knee system without a metal-backed patella. Clin Orthop Relat Res. 2001;(388):77–84. doi: 10.1097/00003086-200107000-00012. [DOI] [PubMed] [Google Scholar]
- 7.Bobyn JD. Fixation and bearing surfaces for the next millennium. Orthopedics. 1999;22(9):810–2. doi: 10.3928/0147-7447-19990901-07. [DOI] [PubMed] [Google Scholar]
- 8.Galante J. Total hip replacement. Orthop Clin North Am. 1971;2(1):139–55. [PubMed] [Google Scholar]
- 9.Jones LC, Hungerford DS. Cement disease. Clin Orthop Relat Res. 1987;(225):192–206. [PubMed] [Google Scholar]
- 10.Landon GC, Galante JO, Maley MM. Noncemented total knee arthroplasty. Clin Orthop Relat Res. 1986;(205):49–57. [PubMed] [Google Scholar]
- 11.Albrektsson T, Branemark I-I, Hansson H-A, Lindstrom J. Osseointegrated titanium implants. Acta Orthop Scand. 1981;52:155–170. doi: 10.3109/17453678108991776. [DOI] [PubMed] [Google Scholar]
- 12.Bobyn JD, Poggie RA, Krygier JJ, Lewallen DG, Hanssen AD, Lewis RJ, Unger AS, O’Keefe TJ, Christie MJ, Nasser S, et al. Clinical validation of a structural porous tantalum biomaterial for adult reconstruction. J Bone Joint Surg Am. 2004;86-A(Suppl 2):123–9. doi: 10.2106/00004623-200412002-00017. [DOI] [PubMed] [Google Scholar]
- 13.Bobyn JD, Stackpool GJ, Hacking SA, Tanzer M, Krygier JJ. Characteristics of bone ingrowth and interface mechanics of a new porous tantalum biomaterial. J Bone Joint Surg Br. 1999;81(5):907–14. doi: 10.1302/0301-620x.81b5.9283. [DOI] [PubMed] [Google Scholar]
- 14.Deglurkar M, Davy DT, Stewart M, Goldberg VM, Welter JF. Evaluation of machining methods for trabecular metal implants in a rabbit intramedullary osseointegration model. J Biomed Mater Res B Appl Biomater. 2007;80(2):528–40. doi: 10.1002/jbm.b.30627. [DOI] [PubMed] [Google Scholar]
- 15.Jinno T, Davy DT, Goldberg VM. Comparison of hydroxyapatite and hydroxyapatite tricalcium-phosphate coatings. J Arthroplasty. 2002;17(7):902–9. doi: 10.1054/arth.2002.34821. [DOI] [PubMed] [Google Scholar]
- 16.Jinno T, Goldberg VM, Davy D, Stevenson S. Osseointegration of surface-blasted implants made of titanium alloy and cobalt-chromium alloy in a rabbit intramedullary model. J Biomed Mater Res. 1998;42(1):20–9. doi: 10.1002/(sici)1097-4636(199810)42:1<20::aid-jbm4>3.0.co;2-q. [DOI] [PubMed] [Google Scholar]
- 17.Stewart M, Welter JF, Goldberg VM. Effect of hydroxyapatite/tricalcium-phosphate coating on osseointegration of plasma-sprayed titanium alloy implants. J Biomed Mater Res A. 2004;69(1):1–10. doi: 10.1002/jbm.a.20071. [DOI] [PubMed] [Google Scholar]
- 18.Erben RG. Embedding of bone samples in methylmethacrylate: an improved method suitable for bone histomorphometry, histochemistry, and immunohistochemistry. J Histochem Cytochem. 1997;45(2):307–13. doi: 10.1177/002215549704500215. [DOI] [PubMed] [Google Scholar]
- 19.Willie BM, Bloebaum RD, Bireley WR, Bachus KN, Hofmann AA. Determining relevance of a weight-bearing ovine model for bone ingrowth assessment. J Biomed Mater Res A. 2004;69(3):567–76. doi: 10.1002/jbm.a.30038. [DOI] [PubMed] [Google Scholar]
- 20.Hofmann AA, Bloebaum RD, Koller KE, Lahav A. Does celecoxib have an adverse effect on bone remodeling and ingrowth in humans? Clin Orthop Relat Res. 2006;452:200–4. doi: 10.1097/01.blo.0000238838.18799.61. [DOI] [PubMed] [Google Scholar]
- 21.Jasty M, Bragdon CR, Haire T, Mulroy RD, Jr, Harris WH. Comparison of bone ingrowth into cobalt chrome sphere and titanium fiber mesh porous coated cementless canine acetabular components. J Biomed Mater Res. 1993;27(5):639–44. doi: 10.1002/jbm.820270511. [DOI] [PubMed] [Google Scholar]
- 22.Sumner DR, Bryan JM, Urban RM, Kuszak JR. Measuring the volume fraction of bone ingrowth: a comparison of three techniques. J Orthop Res. 1990;8(3):448–52. doi: 10.1002/jor.1100080316. [DOI] [PubMed] [Google Scholar]
- 23.Frost H. Intermediary organization of the skeleton. Boca Raton: CRC Press; 1986. [Google Scholar]
- 24.Dhert WJ, Verheyen CC, Braak LH, de Wijn JR, Klein CP, de Groot K, Rozing PM. A finite element analysis of the push-out test: influence of test conditions. J Biomed Mater Res. 1992;26(1):119–30. doi: 10.1002/jbm.820260111. [DOI] [PubMed] [Google Scholar]
- 25.Berzins A, Sumner D. Implant pushout and pullout tests. In: An Y, Draughn R, editors. Mechanical testing of the bone and the bone-implant interface. Boca Raton: CRC Press; 2000. pp. 463–476. [Google Scholar]
- 26.Scott M. Internal Report, personal communication. Smith and Nephew; 2008. [Google Scholar]
- 27.Krygier J, Bobyn J, Poggie R, Cohen R. Mechanical characterisation of a new porous tantalum biomaterial for orthopaedic reconstruction. Sydney: 1999. [Google Scholar]