INTRODUCTION
An imaging technique for pedicle screw fixation surgery needs to be developed that is radiation-free, dynamically interactive, and a guarantor of an extremely low complication rate. Quantitative ultrasound (US) does not involve radiation, and could find use in spine fixation surgery, if shown to be safe and effective. We present the preliminary results of an A-mode ultrasound backscatter feasibility study conducted in excised sheep vertebral bodies. The purpose was to ascertain those acoustic forward/side-viewing features that indicate proper positioning of a transducer tip, or that indicate an impending or actual complication, such as a cortex perforation. The study also involves the conduct of in vitro experiments to determine the intrinsic acoustic properties of the vertebral bodies. 3-D micro-CAT scan reconstructions of the vertebral bodies were made for positional reference purposes.
BACKGROUND
Guidance Issues and Complications of Pedicle Screw Implant Surgery
In pedicle screw fixation surgery, rigid sharp instruments, such as a screw, are introduced into the vertebral body through the pedicle. The screw is usually advanced ventrally between 70 to 80 % of the anterior-posterior diameter of the vertebral body. Excessive forward advancement of a screw can result in an undesired penetration of the distal ventral cortex (outer cortex perforation). Deformation and fracturing of the pedicle can occur when too thick a screw is inserted into the pedicle. Excessive medial or lateral angulation of the screw could result in a more proximal injury (inner cortex perforation or lateral pedicle wall perforation) with damage to the spinal cord or to the spinal nerve roots [1,2]. Malpositioned pedicle screws can protrude through the cortex, and can similarly cause injury to the spinal cord, thecal sac, and to spinal nerve roots.
In an analysis of 617 surgical cases in which pedicle screw implants were used with three different spinal implant systems [3], the most common problem was unrecognized screw misplacement (5.2 %), including perforation of the distal vertebral cortex. Fracturing of the pedicle during screw insertion and cerebrospinal fluid leak occurred in 4.2 % of cases. Transient neuropraxia occurred in 2.4 % of cases, and permanent nerve injury occurred in 2.3 % of cases.
Most current trans-pedicle spinal fixation techniques rely on multiple exposure fluoroscopic identification of anatomic landmarks, and adjunct use of pre-op CAT scans [4-5]. Variant approaches used include electromyographic nerve stimulator monitoring [6,7]; electromagnetic field-based image-guided spine surgery [8]; and intraosseous endoscopy [9].
PURPOSE OF STUDY
In this pilot study, we sought to emulate acoustic guidance and positioning of pedicle fixation screws in sheep vertebral bodies. For this purpose, we sought to obtain the acoustic A-mode signature profile associated with advancement of a transducer through the pedicle and ultimately into a position immediately in front of a marrow-cortex interface. Two acoustic transducers (forward and side-viewing) were co-advanced at each successive measurement site from the outer posterior cortex, through the pedicle, and toward the distal ventral cortex, while measuring A-mode amplitude changes en route. Another goal of the study was to ascertain the acoustic signature features associated with common complications. Deliberate perforations of the outer ventral cortex were performed, and corresponding A-mode measurements were obtained.
MATERIALS AND METHODS
Equipment
Acoustic pulse/echo signal generation and acquisition was achieved by exciting an ultrasonic transducer with a pulser/receiver analyzer (5900 PR, Panametrics Inc., Waltham, MA) and subsequently recording echoes through a digital oscilloscope (LC534, LeCroy Corp., Chestnut Ridge, NY) at a sampling rate of 500 MHz. The pulse repetition frequency was 200 Hz with an energy level of 8 μJ. On receiving, a high pass filter with a cutoff frequency of 1 kHz, and a low pass filter of 20 MHz were used for the purpose of noise suppression. Before recording, echo signals were amplified by 40 dB.
Spine Specimens
All specimens were provided by a slaughterhouse. With approval of the Institutional Animal Care and Use Committee, three spines were removed from 2-3 year old merino sheep of weight 62.7 ± 4.7 (54-72) kg. The spines were disarticulated into ten (10) lumbar vertebral bodies that were refrigerated.
Vertebral Body Micro CAT Scan Imaging
MicroCAT scans were performed at the USC Molecular Imaging Center. All vertebral bodies, prior to and after being drilled, underwent a 3-D micro CAT scan reconstruction (360 degree) at 100 micron resolution with a Cone Beam Reconstruction Array (COBRA) in 750 acquisition steps. Total reconstruction voxels used were 768×768×512 (voxel size of 0.105036 mm). Some specimens had their transverse processes truncated to fit inside the scanner specimen holder. MicroCAT bone radiodensity measurements were made in Hounsfield units (units of X-ray attenuation) with the following scale: air −1000; water, 0; compact bone, +1000). MicroCAT scan measurements were made of thickness of cancellous bone along the drilled pathway, pedicle, and ventral outer cortex.
Transducers
Acoustic Measurements
Two 1 MHz unfocused immersion transducers with a diameter of 13 mm (V303, Olympus NDT, (Waltham, Mass) were used.
Manual Advancements of Transducer
Forward Viewing
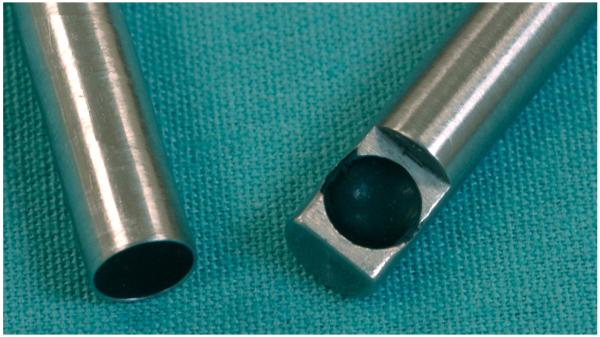
To obtain forward-viewing acoustic A-mode signature profiles, a 2.5 MHz focused immersion transducer (E1400, Valpey Fisher Corp., Hopkinton, MA) with 3.8 mm diameter face recessed 1 mm within the casing, a focal length of 6.35 mm, and with – 6 dB BW of 1.95 MHz was used.
Side Viewing
For side-viewing, one 2.5 MHz focused side-viewing immersion transducer (E1476, Valpey Fisher Corp) with 3.2 mm diameter face, a focal length 6.35 mm, and – 6 dB BW of 1.563 MHz was used.
The two transducers are shown in Figure 1.
Figure 1.
2.5 MHz forward-viewing and side-viewing transducers (Valpey Fisher Corp., Hopkinton, MA).
STUDY DESIGN
EXPERIMENT SET I: Acoustic Measurements
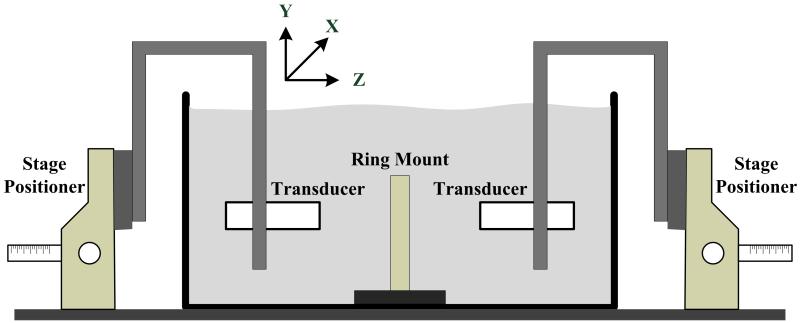
In vitro acoustic experiments to measure sound velocity (SV), attenuation, and integrated backscatter coefficients were performed in an experimental de-ionized water bath (see Figure 2). Broadband ultrasound attenuation (BUA), defined as the slope of the attenuation versus frequency curve, was measured. For the SV and attenuation measurements, the two 1-MHz unfocused US transducers were used: one for transmitting another for receiving. For the integrated backscatter coefficient measurements, only one transducer was used to transmit and receive US echoes. The received signals were amplified, digitized and recorded for calculating each parameter. All measurements were performed with the standard substitution method in which the measured signals are compared to the echo from a perfect reflector in the case of the integrated backscatter coefficient measurement, or with the transmitted signal passing through only a water bath for others [10].
Figure 2.
Acoustic experimental water bath for measurement of sound speed, broadband ultrasound attenuation, and backscatter coefficients.
Marrow specimens, with mean thickness 3.92 mm ± 0.78 mm, were degassed and defatted over a two day period with multiple solution changes of a 10 % isopropyl alcohol/methyl alcohol solution, and were then fixed in position within a three-screw adjustable ring mount located at the center of the water bath. Two stage positioners were used for moving transducers along three axes to place a target at their natural focal distance and to measure the elastic properties at multiple positions along the X- and Y-axis.
EXPERIMENT SET II
Ten (10) vertebral bodies are studied in a solution bath, both with forward-sensing and side-viewing transducers. After an initial hole in the cortex was made on the right side only, with the drill shaft angled 45 degrees (relative to the anterior-posterior plane) toward the ventral (anterior) cortex, the cylindrical cavity was successively deepened with a Flat Bottom drill (Irwin Industrial, Inc.). Particulate bony debris was intermittently removed as needed after each step. Descriptive statistics are used.
II-A. Forward-Viewing Transducer Advanced with Use of Flat Bottom Drill
The 2.5 MHz forward-viewing transducer (FVT) is ink marked at 5 mm increments, with an estimated positioning error of 0.5 mm. The FVT is manually advanced into each successively deepened cavity in 5 mm increments, with the FVT tip insertion depth calculated from the number of non-visible markings. The maximal FVT backscatter measurement obtained was recorded at each depth.
II-B. Forward-Sensing Perforation of the Outer and Inner Cortex
For deliberate perforations, five vertebral bodies were chosen from the above set of ten vertebral bodies. From the final end-position at the marrow-cortex interface within the drilled cavity, the drill is advanced still further to perforate the distal outer cortex of the vertebral body. An FVT backscatter measurement is made.
II-C. Side-Viewing Transducer Co-Advanced Manually
Immediately after each measurement in I-A, the forward-imaging transducer is removed, and the 2.5-MHz focused side-viewing transducer (SVT) is advanced to the same depth, with the beam directed medially, so as to obtain the corresponding side-viewing backscatter maximal value measurement. The center of the SVT face is 5 mm proximal to the corresponding FVT transducer tip so that these paired measurements are 3 mm apart.
Micro-CAT Scan Images
The drilled vertebral bodies from experiment set II were imaged with a 3-D micro-CAT scanner. A horizontal slice through the vertical midline of the drilled cavity was made. Within this slice, the 2-D image of the vertebral body and its drilled cavity was generated for position referencing purposes.
RESULTS
SPECIMEN DESCRIPTIVE STATISTICS
Dimensions of the relevant vertebral body anatomy were obtained. Descriptive statistics were used. The results in centimeters are as follows: vertebral body height VBH 42.68 ± 5.13 (36.28-49.37); pedicle width PDW 12.49 ± 2.51 (8.73-14.62), and pedicle height PDH 37.68 ± 3.19 (32.5-41.62). The calculated ratio of means PDW/PDH was 0.33 ± 0.06 (0.21-0.41).
EXPERIMENTAL SET I: Acoustic Measurements
Cancellous bone from four vertebral bodies were studied in the waterbath. Eighty region of interest (ROI) measurements were made, with twenty different ROI measurements per sample (see Table).
| Sample Number |
Attenuation at 1MHz (dB/cm) |
BUA (dB/cm MHz) |
Speed of Sound at 1 MHz (m/s) |
Integrated Backscatter Coefficient (dB) |
|---|---|---|---|---|
| #1 | 33.15±1.17 | 53.85±4.78 | 1930.0±36.26 | −124.73±1.71 |
| #2 | 29.92±3.56 | 49.73±7.64 | 2070.8±33.25 | −118.36±6.11 |
| #3 | 30.46±1.88 | 46.33±8.30 | 2145.6±26.27 | −117.80±1.66 |
| #4 | 25.86±0.80 | 43.98±5.52 | 2005.8±22.76 | −135.05±4.27 |
EXPERIMENT SET II
Large diameter transducers are appropriate for acoustic measurements, because they exhibit enhanced spatial resolution, increased acoustical power, and improved signal-to-noise (SNR) ratio. Although we used 13 mm diameter devices for acoustic measurement purposes, the use of such large transducers for the FVT and SVT studies would result in undesired traumatic perforations of our specimen pedicles in practically all cases. Conversely, if the transducer aperture is too small, the strength of both transmitted and received signals is decreased, and decreased SNR becomes a concern. Therefore, we chose to conduct our study with small handheld 5 mm-diameter (including casing) 2.5-MHz focused transducers that are comparable in size to an average-sized screw. We chose to work with focused transducers, primarily because of the need to have a strong detectable signal, plus our expectation that the Flat Bottom drill would create a satisfactory reflecting surface at each successive depth.
Forward-Sensing Transducer Advanced Manually with use of Flat Bottom Drill
Forward Group
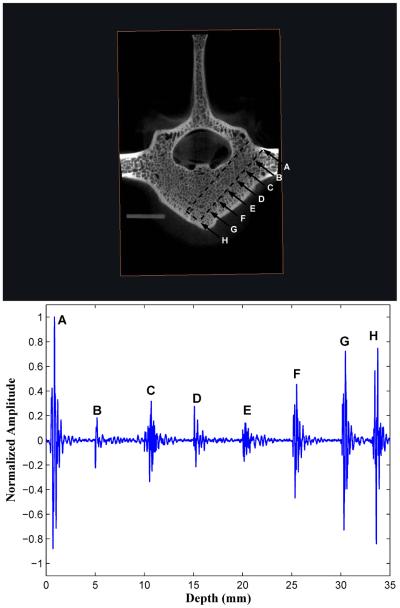
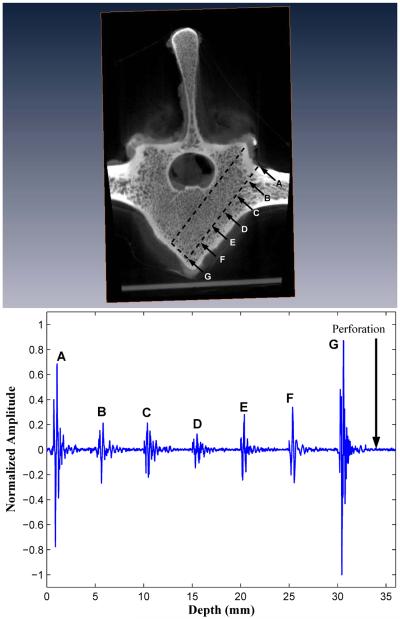
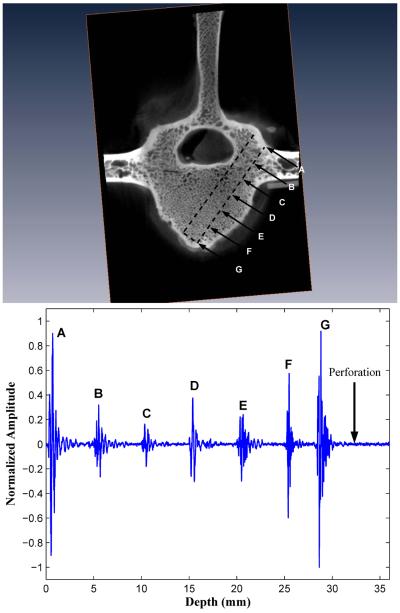
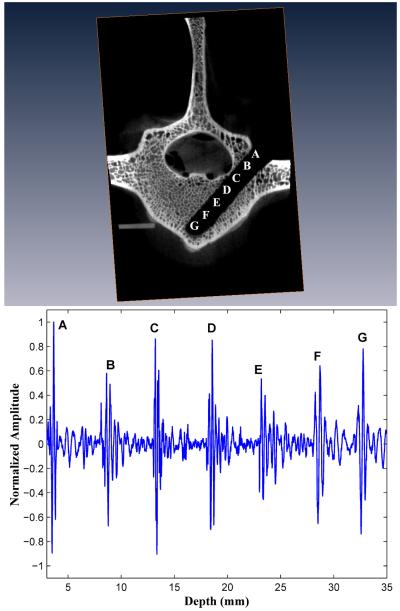
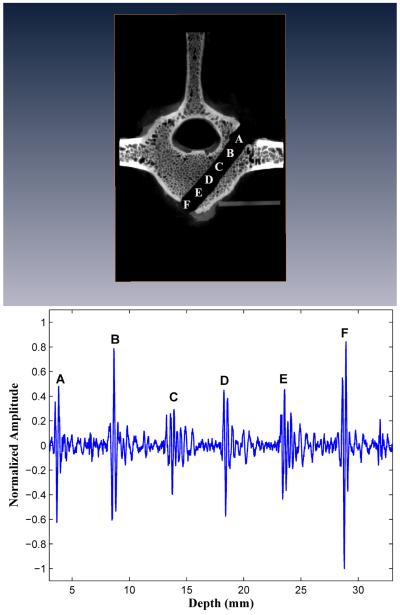
Three of the ten forward-sensing normalized BUB measurement versus distance profiles are presented in Figures 3, 4, and 5 alongside microCAT scan images indicating the corresponding positions within the vertebral body image where the BUB measurements were made. These three drilled pathways will be referred to as I, II, and III and that had, respectively, minimal pedicle widths (cancellous part only) of 9.4, 10.8, and 9.8 mm.
Figure 3.
A forward-viewing 2.5 MHz transducer obtains successive backscatter measurements in 5 mm distance increments each time that a drill creates a progressively deeper insertion pathway in vertebral body I. The backscatter echoes at all successive measurement sites 5 mm apart are composited into a single figure. The backscatter amplitudes increase over the last three peaks as the marrow-cortex interface is approached.
Figure 4.
Forward-viewing in drilled vertebral body II. The backscatter amplitudes increase over the last three peaks as the marrow-cortex interface is approached. Perforation of the M-C interface results in signal loss.
Figure 5.
Forward-viewing in drilled vertebral body III. The backscatter amplitudes increase over the last three peaks as the marrow-cortex interface is approached. Perforation of the M-C interface results in signal loss.
In all ten (10) vertebral bodies, the highest FVT BUB amplitudes were observed at the initial point of screw insertion on the posterior outer cortex of the vertebral body (left column, position A in Figures 3, 4, and 5), and at the distal marrow-cortex interface (position H in Fig. 3, and position G in Figs. 4 and 5). Between these two maximal values, the marrow values were generally lesser-valued. In the majority of cases (7/10), marrow values increased in amplitude over the last three peaks as the marrow-cortex junction was approached. In all cases (10/10), the BUB ratio of the marrow-cortex interface to the smallest marrow value well exceeded 2, with ratio values ranging from 2.25 to 8.33 (mean 4.00 ± 1.82). In 80 % of cases (8/10), the peak BUB ratio of distal cortex to starting inner cortex was in the 0. 82 to 1.62 range (mean 0.98 ± 0.30).
B. Forward-Sensing Perforations of the Outer Cortex
Upon deliberate perforation of the ventral outer cortex for five vertebral bodies selected from the initial group of ten bodies, the amplitude of the FVT backscatter signal was at an undistinguishable level, i.e., with a BUB value compatible with that of the waterbath solution (see “Perforation” in Figs. 4 and 5).
C. Side-Viewing Transducer Manually Co-Advanced
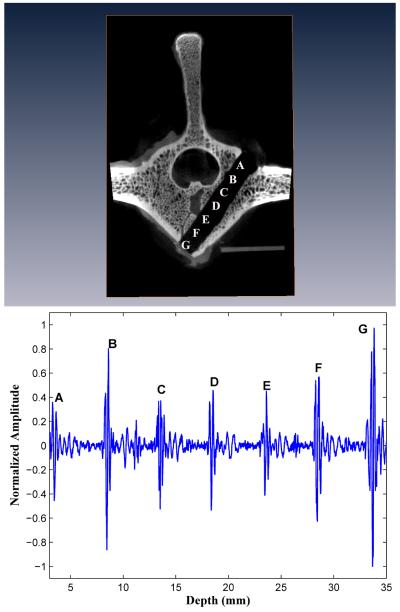
For the same ten (10) vertebral bodies used in the forward group, after each FVT measurement was made, the forward-imaging transducer was removed, and a side-viewing transducer (SVT) oriented medially was introduced. In Figures 6-8, the corresponding side-viewing profiles for the specific drilled pathways I, II, and III are shown. In nine out of ten cases (9/10) beyond the pathway midpoint, there was a sequential rise in normalized BUB amplitudes covering the latter three peaks as the SVT was advanced toward the ventral cortex (right column, point E through G in Figs. 6 and 7, and points D through F in Fig. 8). For the smaller vertebral body in Fig. 8, the cortex was reached by the SVT at a shorter distance (F). In all cases, the maximum distal SVT value for the normalized BUB amplitude was obtained when the medially-oriented side-viewing transducer faced the distal ventral cortex.
Figure 6.
A side-viewing transducer, with its face directed medially, is co-advanced in successive 5 mm increments immediately after each forward-viewing measurement in vertebral body I. Note the effect on backscatter amplitude of transducer tip proximity to the inner cortex surrounding the spinal cord, as in points C and D. Once past the inner cortex, the marrow backscatter amplitudes increase over the last three peaks as the ventral cortex is approached.
Figure 8.
Side-viewing in drilled vertebral body III. Maximal backscatter amplitude at point B, the point of closest proximity to inner cortex.
Figure 7.
Side-viewing in drilled vertebral body II. The backscatter amplitude is highest at point B, when the transducer tip is closest to the inner cortex. The backscatter amplitudes increase over the last three peaks as the cortex is approached.
MicroCAT Scan Radiodensity versus BUB Plot
For the three sheep BUB versus distance profiles presented in Figs. 3, 4, and 5, we outlined the known insertion pathway (the dotted outline) from the microCAT scan of the drilled specimen scan and then superimposed it onto the original undrilled microCAT scan image of the same vertebral body. The insertion pathway was then divided into 5 mm successive ROI segments, in a manner that mimicked the successive forward-viewing BUB measurements. Mean bone radiodensity measurements were determined for each such ROI segment, beginning with the outer posterior cortex, continuing through the marrow, and extending into the distal cortex. A plot of the microCAT scan mean radiodensity versus BUB Plot is shown in Fig. 9, for each of the three FVT insertion pathways illustrated in Figs. 3,4, and 5. As with the BUB measurements, there is an initially high value for the microCAT scan radiodensity corresponding to the posterior outer cortex, a decline during the marrow portion of the pathway, and a progressive radiodensity increase as the distal cortex is approached. The radiodensity-BUB correlation coefficients for the three pathways were 0.935, 0.953, and 0.918, respectively.
Figure 9.
Plot of microCAT scan radiodensity plotted versus distance into the drilled insertion pathway for the three vertebral bodies I, II, and III.
DISCUSSION
Sheep have become a practical model for spine surgery research [11]. In general, sheep have 7 cervical, 12-14 thoracic, and 6-7 lumbar vertebrae. Sheep and human spines are most similar in the thoracic and lumbar regions. The human vertebra is characteristically wider than tall, whereas the sheep vertebra is taller than wider. For both species, vertebral width is greater than height, thus producing a typically oval shape that is pronounced in the lumbar regions. A useful anatomical resource is the sheep spine database compiled by Wilke [12].
Acoustic properties of bone
Mujagic et al conducted a quantitative ultrasonic A-mode study of seven defatted human cancellous bone samples along the craniocaudal axis with 1-MHz and 3.5-MHz broadband transducers (13 mm and 10 mm diameters, respectively) [13]. With the use of an aluminum reflector placed at the end of the cancellous bone to serve as a specimen boundary, A-mode imaging was used to detect the reflection from the water-aluminum boundary in 83.2 % and 70.1 % of the cases at 1-MHz and 3.5-MHz cases, respectively. This demonstrated feasibility of A-mode imaging through cancellous bone thicknesses of 16.5- 19 mm. These results are consistent with our study.
In cancellous bone, a strong linear relationship between SV and BMD exists over a wide range. In both cortical and cancellous bone, wave propagation is acoustically anisotropic, and the ultrasonic properties vary with the direction in which the measurement is made, particularly, the longitudinal axis of the transducer relative to the major trabecular bone orientation [14-16].
Marrow is composed of a significant amount of soft fatty tissue. The isopropyl alcohol/methanol defatting process affects the acoustic speed, because the resulting SV is higher in water-filled bone than in marrow-filled bone. Marrow significantly decreases SV, but increases BUA, attenuation slope and backscatter compared to the water-saturated state. As a result, the water bath acoustic measurements will tend to overestimate the sound speed and to underestimate the attenuation in cancellous bone [17-19].
The results in our study indicate that BUA shows a strong increase of attenuation with frequency, which likely reflects increased scattering as the wavelength approaches the dimensions of the bone elements [20]. BUB exhibits moderate correlations with BMD in human cancellous femur and tibia in the 500 KHz to 5 MHz range [21-22]. BUB is highly correlated with bone volume fraction (r2 = 0.76) that is a strong indicator of bone content rather than structure. In those trabecular regions where the cells are more densely packed (cortex), one expects a higher BUB amplitude than in a less densely packed region (marrow). The results of Figure 9, which correlates microCAT scan bone radiodensity with successive 5 mm FVT advancements along the insertion pathway, are in conformity with the expected values: an initially high radiodensity value for the dense posterior cortex, a decline during the less dense marrow, and a radiodensity rise as the distal cortex is approached. Correlation values were highest in the denser cortical regions.
Temperature effects were not studied herein. In water-filled cancellous bone, SV increases with increasing temperature [23-24].
Forward-Sensing and Side-Viewing Detection of Marrow-Cortex Interface
The combined results suggest that for both forward- and side-viewing transducers, in 80 % of cases (16 out of 20), as the transducer is advanced from marrow toward cortex, a rise in the backscatter amplitude typically occurs. The desired rise is not always perfect, and depends to a significant degree on the extent of local scattering by irregularities in bone marrow. As the cortex is approached, a fraction of the US signal transmitted through the trabecular matrix is then reflected by the underlying smooth hard cortex, adding to the backscatter amplitude at the FVT measurement site. The closer the FVT tip is to the marrow-cortex junction, the greater the cortex contribution to the backscatter amplitude.
Awaiting the results of further studies to confirm these results, we make the following preliminary observations regarding the value of FVT BUB measurements that would indicate near approach of the distal marrow-cortex interface. When the halfway point along the instrument insertion pathway has been passed, the preliminary indicators of a nearby marrow-cortex interface appear to be: (1) three or more successive BUB rises. In this study, a 2.5 MHz FVT transducer can detect the approach of the marrow-cortex interface, generally within 1.5 cm distance (3 successively increasing BUB peaks) in 80 % of cases; (2) a BUB maximal value in the vicinity of the marrow-cortex interface that is least twice the magnitude of the smallest marrow BUB value (seen in all ten cases), and (3) and a BUB value past the halfway point that is within 10-20 % of the original BUB value obtained externally at the start site (8/10 cases). The presence of one or more of these A-mode features, when evident to an observer, might serve as an indication to consider the cessation of further drilling. Such stop criteria need to be more thoroughly tested in a larger study.
For those instances when the anticipated pre-cortical rise is not evident, a possible cause is the redirection of the beam more laterally by local trabecular matrix irregularities, or destructive interference, thus decreasing the returned sound energy available to be sensed as backscatter. Indeed, the cortex itself is angled relative to the longitudinal axis of the device, and this redirection of the input signal could have a backscatter amplitude diminishing effect. Another possible explanation is the presence of a colony of larger-sized marrow fluid-filled cells that can serve as pockets of attenuation. The use of smaller increments, say 2 mm, might be useful in making additional cortex-sized amplitude peaks apparent, and thus make it easier to detect approach of the ventral cortex. Finally, multiple scattering does not appear to have a significant effect in the usual backscatter measurements.
In the SVT side-viewing images, the marrow peaks are high-valued in the first half of the insertion pathway, and less so in the second half of the pathway. We believe the best explanation for these higher-valued peaks resides in the proximity of the inner cortex to the SVT transducer face, which occurs during the first half of the pathway. With the SVT in the marrow facing medially, as the SVT is advanced close to the inner cortex, higher peaks are observed. In Figure 6, proximity to the inner cortex surrounding the spinal cord, as in points C and D, leads to relatively higher amplitude values. In Figures 7 and 8, the backscatter amplitudes are highest at point B, where the transducer tip is closest to the inner cortex.
As the SVT passes beyond the inner cortex and further inward into the more distal marrow, the marrow BUB values decline. As the distal cortex approaches, the SVT marrow peaks begin to rise again.
An applicable US-guided positioning principle would be as follows: As a circumferential-sensing SVT transducer passes through the pedicle, it is bounded laterally by the pedicle wall and medially by the inner cortex rim. In a complete rotation, if the BUB values are higher on the lateral side than on the medial side, the SVT is angled too laterally. On the other hand, if the BUB values are higher medially than laterally, the SVT is angled too medially. Thus the surgeon can adjust the angle of the US-guided instrument, by keeping the balance between BUB values medially and laterally, as well as rostrally versus caudally. This could serve as a way by which to achieve an optimally safe insertion path. Ideally, with the appropriate apparatus, a full 360 degree range could be covered similarly.
The effect of high BUB marrow values in the first half of the insertion pathway is not limited to an SVT device. Even for a FVT transducer completely embedded in marrow, the sensing of the rim of a nearby spine cortex could cause an elevated BUB value (beam width artifact). This also needs to be investigated.
Alternatively, there is constructive interference that can produce anomalously high-peaked marrow values. Small islands of cortex are known to occur separately either as extensions of the cortex into the marrow, and could serve as misleadingly high backscatter regions in marrow.
Instead of the individual site measurement approach used herein at discrete points separated by a fixed interval distance, it might be advantageous to consider using a running average approach, whereby the backscatter amplitudes are summated and averaged with the use of overlapping intervals a few millimeters wide (bar chart approach). Thereby the trabecular marrow point-to-point variations are smoothed out and the general trend becomes more evident.
Detection of Ventral Cortex Perforations
In all cases, the detection of a ventral cortex perforation by the ultrasound transducer was evident from one very simple observation: the effective loss of the signal. In the surgical setting, however, there will be reflections from nearby soft tissue, depending on where the perforation occurs.
The combined use of a forward-imaging transducer and a side-viewing transducer raises interesting prospects. As noted before, the FVT tip measurement site is 3 mm axially ahead of the SVT measurement. After a forward advancement of the device tip by 3 mm, the SVT is allowed to measure medially where the FVT measured forwardly.
Observations of the combined FVT/SVT BUB values at successive measurement sites along the insertion pathway for these two perpendicularly viewing transducers could be employed to infer likely location on the following basis:
Low SVT , low FVT → Intra-marrow position of device tip
Low SVT , higher SVT → Approaching marrow-cortex interface
High SVT, high FVT → Intra-cortical position (impending perforation)
High SVT, low FVT → Cortex perforation
Such an algorithm requires more extensive testing in a large sample study.
Detection of Inner Cortex Perforations: A Preliminary Observation
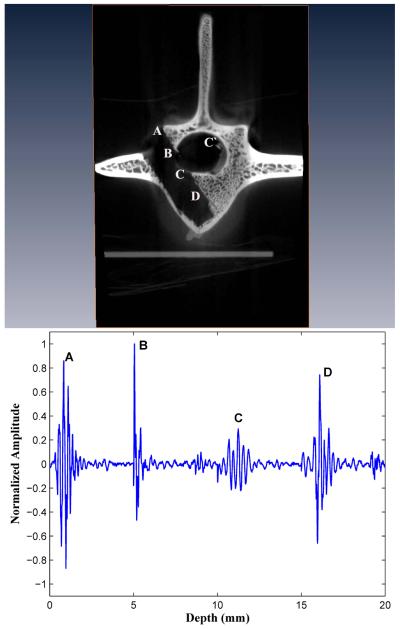
With a large screw relative to pedicle width, there is increased risk of a medial wall (inner cortex) or lateral wall perforation, which can result in spinal cord or nerve root injury and cerebrospinal fluid leak. We have not performed a systematic study of such medial and lateral wall perforations. However, with a large hollow screw thread assembly, we have been able to achieve a complete perforation of the inner cortex (see Fig. 10) and to study it acoustically with the SVT probe. At points A and B, the SVT face is medially directed and is close to the inner cortex rim, so that high-valued BUB values result.
Figure 10.
A complete pedicle medial wall (inner cortex) perforation.
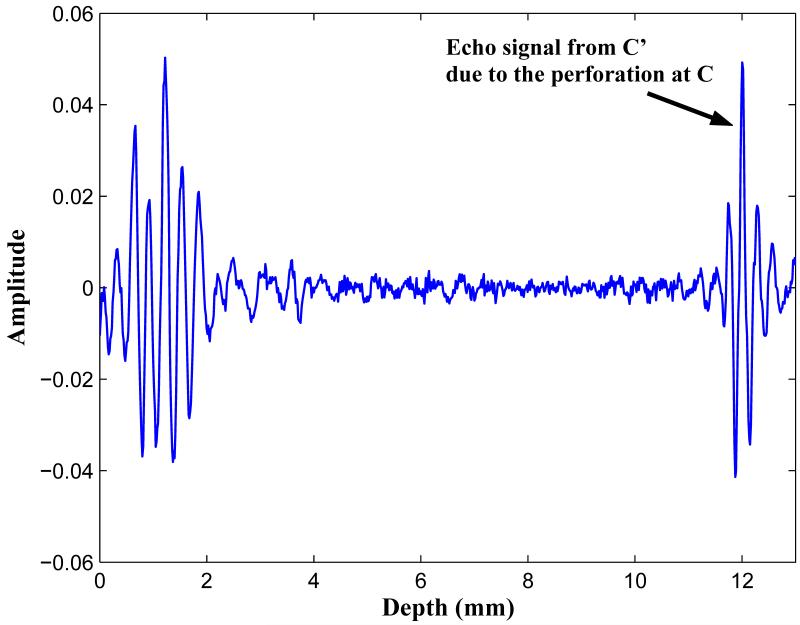
A complete perforation of the inner cortex is evident at point C, where the BUB is significantly damped. Interestingly, in the complete signal response, as shown in Fig. 11, a second echo is noted originating from the oppositely sided cortex at C’. The measured distance from C to C’ is approximately 10 mm, which is the distance across the spinal cord. We note that in all SVT measurements, if the inner cortex is intact, only one echo is noted. Therefore, the presence of a double-echo may be a useful acoustic diagnostic signature by which to detect a complete inner cortex wall perforation. However, it is clear that further work needs to be done to study this more thoroughly.
Figure 11.
A double echo occurred in association with a pedicle medial wall perforation. The first echo C is markedly diminished in amplitude by the perforation, and a second echo C’ occurs because of acoustic reflection from the inner cortex rim on the opposite side.
Study Limitations
In this study, a limitation is imposed by the relatively small sample size. One limiting factor is that we used the side-viewing transducer exclusively for sensing of the medial wall, but ignored the lateral, rostral, and caudal walls. Another is the extra nuance of interpretation required of the operator, in one’s having to consider the relative size of the BUB amplitudes and their likely reflection site of origin.
In this study, intermittent irrigation after each measurement was performed to accomplish water washout of the debris. However, any usable ultrasound-based system must have an automated mechanism for such debris removal and washout. This debris removal should be done sufficiently well from the region immediately in front of the FVT tip such that it will allow reliable BUB measurements to be made. If irregular small accumulations of bony debris remain at the cavity bottom, the reflecting surface is irregular, and the BUB amplitude will fluctuate more because of the unpredictable geometry.
The shape of the surface created in front of the FVT transducer tip needs to be as smooth surfaced as possible, and its shape should be either flat or slightly concave. In this pilot study, prior to each measurement, a Flat Bottom drill was used to create a relatively flat reflecting surface forward of the FVT transducer. However, slightly curved surfaces created by current drill bits--either fluted balls or smooth surfaced drill bits—should be compatible with these shape requirements. Experiments are under way in this regard.
Future Ultrasound System Considerations
It is possible that a dual forward-viewing/side-viewing ultrasound transducer system for pedicle screw fixation can be developed. However, much more investigative work needs to be done to establish the safety of reliance upon exclusive ultrasound guidance for pedicle screw fixation procedures. Such a system almost certainly would require the conjunctive use of a pre-operative CAT scan-referenced vertebral body image set. The system would be used to sound the pedicle, and to gauge interactively the presence of cortical sidewall boundaries at successive depths to achieve proper instrument tip placement, thereby achieving a form of “bone endoscopy”. In one embodiment, the drill tap could be used to create a larger hole, and safety verification as to position could be immediately made with the ultrasound transducer. In this regard we are currently developing a novel prototype transducer-device insertion system.
Conclusions
In summary, our general observations are:
A 2.5 MHz FVT transducer can detect the approach of the marrow-cortex interface, with a 1.5 cm anticipation distance (3 successively increasing BUB peaks) in 80 % of cases.
Comparative FVT BUB ratio measures (cortex-to-marrow, cortex-to-cortex) may be helpful in inferring transducer tip location in 80 % of cases.
During passage through the pedicle, SVT transducers have increased BUB values because of reflections from nearby inner cortex and pedicle walls. Use of oppositely-sided values may be helpful in instrument guidance.
Ventral cortex perforations and medial pedicle wall (inner cortex) perforations are associated with a major drop in signal amplitude.
ACKNOWLEDGEMENTS
Support for this study was provided by National Institute of Health/ National Institute of Arthritis and Musculoskeletal Diseases Research Grant R41AR055834-01.
Experimental work was done at the facilities of the NIH Ultrasonic Transducer Resource Center based at the University of Southern California.
We acknowledge the assistance of Mr. Grant Daglian and Ms. Archana Tank of the USC Molecular Imaging Center.
Footnotes
Publisher's Disclaimer: This is a PDF file of an unedited manuscript that has been accepted for publication. As a service to our customers we are providing this early version of the manuscript. The manuscript will undergo copyediting, typesetting, and review of the resulting proof before it is published in its final citable form. Please note that during the production process errors may be discovered which could affect the content, and all legal disclaimers that apply to the journal pertain.
Contributor Information
David T. Raphael, Keck School of Medicine; USC University Hospital, 1500 San Pablo St., Los Angeles, CA 90033, draphael@usc.edu cell: 818-399-9538 pager: 213-919-0484.
Jin Ho Chang, Post-Doctoral Research Associate, NIH Medical Ultrasonic Transducer Resource Center, Denney Research Center, Univ. of Southern California, Los Angeles, CA 90089, jinhchan@usc.edu Phone: 213-821-2651
Yao Ping Zhang, Research Associate, Dept. of Anesthesiology, Keck School of Medicine, Los Angeles, CA 90033, yaopingz@usc.edu cell: 626-497-6698 phone: 323-409-2794
David Kudija, California Standoff, Inc., Paso Robles, CA, dkudija@yahoo.com or mrx@thegrid.net cell: 805-610-1706.
Thomas C. Chen, Dept. of Neurosurgery, Keck School of Medicine, USC University Hospital, 1500 San Pablo St., Los Angeles, CA 90033, tchen68670@aol.com.
K. Kirk Shung, NIH Medical Ultrasonic Transducer Resource Center; Viterbi School of Engineering, University of Southern California, Denney Research Bldg. 139 (Mail code 1111), Los Angeles, CA, kkshung@usc.edu office ephone: 213-821-2653.
REFERENCES
- [1].Schwab FJ, Nazarian DG, Mahmud F, Michelsen CB. Effects of spinal instrumentation of the lumbosacral spine. Spine. 1995;20(18):2023–8. doi: 10.1097/00007632-199509150-00014. [DOI] [PubMed] [Google Scholar]
- [2].Defino HLA, Vendrame JRB. Role of cortical and cancellous bone of the vertebral pedicle in implant fixation. European Spine Jour. 2001;10:325–333. doi: 10.1007/s005860000232. [DOI] [PMC free article] [PubMed] [Google Scholar]
- [3].Esses SI, Sachs BL, Dreyzin V. Complications associated with the technique of pedicle screw fixation. Spine. 1993;18(5):2231–8. doi: 10.1097/00007632-199311000-00015. [DOI] [PubMed] [Google Scholar]
- [4].Farber GL, Place HM, Mazur RA, Jones DE, Damiano TR. Accuracy of pedicle screw placement in lumbar fusions by plain radiographs and computed tomography. Spine. 1995;20(13):1494–9. doi: 10.1097/00007632-199507000-00010. 1995. [DOI] [PubMed] [Google Scholar]
- [5].Rao G, Brodke DS, Rondina M, Dailey AT. Comparison of computerized tomography and direct visualization in thoracic pedicle screw placement. J Neurosurgery. 2002;97(2 suppl):223–6. doi: 10.3171/spi.2002.97.2.0223. [DOI] [PubMed] [Google Scholar]
- [6].Young WF, Mordledge DE, Martin W, Park KB. Intraoperative stimulation of pedicle screws: a new method for verification of screw placement. Surgical Neurology. 1995;44(6):544–7. doi: 10.1016/0090-3019(95)00246-4. [DOI] [PubMed] [Google Scholar]
- [7].Glassman SD, Dimar JR, Puno RM, Johnson JR, Shields CB, Linden RB. A prospective analysis of intraoperative electromyographic monitoring of pedicle screw placement with computed tomographic scan confirmation. Spine. 1995;20(12):1375–79. [PubMed] [Google Scholar]
- [8].Sagi HC, Manos R, Benz R, Ordway NR, Connolly P. Electromagnetic field-based image-guided spine surgery. Part one: results of a cadaveric study evaluating lumbar pedicle screw placement. Spine. 2003;28(17):2013–8. doi: 10.1097/01.BRS.0000087851.51547.00. [DOI] [PubMed] [Google Scholar]
- [9].Stauber MH, Bassett GS. Pedicle screw placement with intraosseous endoscopy. Spine. 1994;19(1):57–61. doi: 10.1097/00007632-199401000-00012. [DOI] [PubMed] [Google Scholar]
- [10].Shung KK, Thieme GA, editors. Ultrasonic Scattering by Biological Tissues. CRC Press; Boca Raton, FL: 1993. [Google Scholar]
- [11].Jahng TA, Fu TS, Kim DH. Open versus endoscopic lumbar pedicle screw fixation and posterolateral fusion in a sheep model: a feasibility study. Spine Journal. 2004;4(5):519–26. doi: 10.1016/j.spinee.2004.02.009. [DOI] [PubMed] [Google Scholar]
- [12].Wilke H-J, Kettler A, Wenger H, Lutz EC. Anatomy of the sheep spine and its comparison to the human spines. Anatomical Record. 1997;247:542–555. doi: 10.1002/(SICI)1097-0185(199704)247:4<542::AID-AR13>3.0.CO;2-P. [DOI] [PubMed] [Google Scholar]
- [13].Mujagic M, Ginsberg HJ, Cobbold SC. Development of a method for ultrasound-guided placement of pedicle screws. IEEE Trans UFFC. 2008;55(6):1267–1276. doi: 10.1109/TUFFC.2008.789. [DOI] [PubMed] [Google Scholar]
- [14].Nicholson PHF, Haddaway MJ, Davie MWJ. The dependence of ultrasonic properties on orientation in vertebral bone. Phys Med Biol. 1994;39(6):1013–1024. doi: 10.1088/0031-9155/39/6/007. [DOI] [PubMed] [Google Scholar]
- [15].Njeh CF, Kuo CW, Langton CM, et al. Prediction of human femoral bone strength using ultrasound velocity and BMD: an in vitro study. Osteoporosis Int. 1997;7:471–477. doi: 10.1007/s001980050035. [DOI] [PubMed] [Google Scholar]
- [16].Laugier P, Giat P, Berger G. Bone characterization with ultrasound: state of the art and new proposal. Clin Rheum. 1994;13(suppl 1):22–32. [PubMed] [Google Scholar]
- [17].Nicholson PHF, Bouxsein ML. Bone marrow influences quantitative ultrasound measurements in human cancellous bone. Ultrasound Med Biol. 2002;28:369–375. doi: 10.1016/s0301-5629(01)00508-7. [DOI] [PubMed] [Google Scholar]
- [18].Hodgskinson R, Njeh CF, Whitehead MA, Langton CM. Non-linear relationship between BUA and porosity in cancellous bone. Physics in Medicine & Biology. 1996;16:2411–2420. doi: 10.1088/0031-9155/41/11/012. [DOI] [PubMed] [Google Scholar]
- [19].Hoffmeister BK, Whitten SA, Kaste SC, Rho JY. Effect of marrow on the high frequency ultrasonic properties of human cancellous bone. Phys Med Biol. 2002;47:3419–3427. doi: 10.1088/0031-9155/47/18/310. [DOI] [PubMed] [Google Scholar]
- [20].Wear KA. Ultrasonic scattering from cancellous bone: a review. IEEE Trans UFFC. 2008;55(7):1432–1441. doi: 10.1109/TUFFC.2008.818. [DOI] [PMC free article] [PubMed] [Google Scholar]
- [21].Hakulinen M, Day JS, Toyras J, Timonen M, Kroger K, Weinans H, Kiviranta I, Jurvelin JS. Prediction of density and mechanical properties of human trabecular bone in vitro by using ultrasound transmission and backscatter sensing measurements at 0.6-6.7 MHz frequency range. Phys Med Biol. 2005;50:1629–1642. doi: 10.1088/0031-9155/50/8/001. [DOI] [PubMed] [Google Scholar]
- [22].Riekinnen O, Hakulinen MA, Toyras J, Jurvelin JS. Spatial variations of acoustic properties is related with mechanical properties of trabecular bone. Phys Med Biol. 2007;52:6961–6968. doi: 10.1088/0031-9155/52/23/013. [DOI] [PubMed] [Google Scholar]
- [23].Nicholson PHF, Bouxsein Effect of temperature of ultrasonic properties of the calcaneus in situ. Osteoporosis Int. 2002;13:888–892. doi: 10.1007/s001980200122. [DOI] [PubMed] [Google Scholar]
- [24].Wear KA. Temperature dependence of ultrasonic attenuation in human calcaneus. Ultrasound Med Biol. 2002;28:469–472. doi: 10.1016/s0301-5629(99)00135-0. [DOI] [PMC free article] [PubMed] [Google Scholar]


