Abstract
This article reported the high tumor-uptake of ultrasmall near-infrared (NIR) quantum dots (QDs) attributed to the enhanced permeability and retention (EPR) effect. InAs/InP/ZnSe QDs coated by mercaptopropionic acid (MPA) exhibited the emission wavelength at about 800 nm (QD800-MPA) with very small hydrodynamic diameter (<10 nm). Using 22B and LS174T tumor xenograft models, in vivo and ex vivo imaging studies showed that QD800-MPA was highly accumulated in the tumor area, which is very promising for tumor detection in living mice. The ex vivo elemental analysis (Indium) using inductively coupled plasma (ICP) spectrometry confirmed the tumor uptake of QDs. The ICP data are consistent with the in vivo and ex vivo fluorescence imaging. Human serum albumin (HSA) coated QD800-MPA nanoparticles (QD800-MPA-HSA) showed reduced localization in mononuclear phagocytic system (MPS)-related organs over QD800-MPA plausibly due to the low uptake of QD800-MPA-HSA in macrophage cells. QD800-MPA-HSA may have great potential for in vivo fluorescence imaging.
Keywords: ultrasmall, quantum dots, tumor imaging, passive targeting, fluorescence imaging
1. Introduction
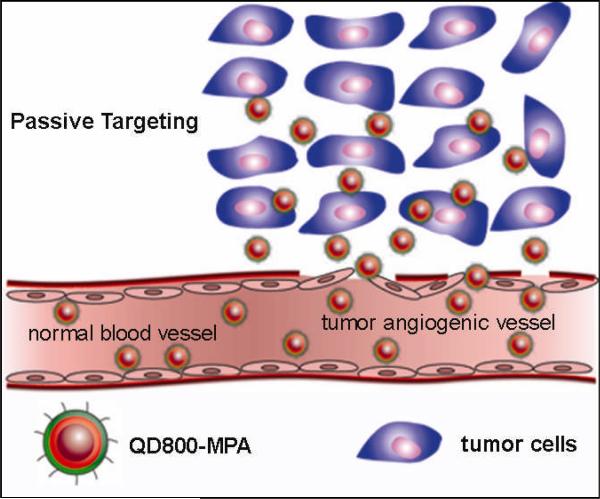
In this article, we describe the ultrasmall near-infrared (NIR) non-cadmium quantum dots (QDs) to show high tumor-uptake due to the enhanced permeability and retention (EPR) effect. Nanobiotechnology, the integration of nanotechnology with molecular biology and medicine, has become an active new emerging research area because of the tremendous efforts on the biomedical applications of nanomaterials recently.[1-4] QDs have been widely served as fluorescent probes to visualize the biological processes in vitro and in vivo.[5-7] With the surface functionalization using peptides, proteins, and antibodies, QDs indeed showed high capacity to target and image tumors in living subjects by the rapid readout of fluorescence imaging.[8-15] It is now well recognized that, besides their narrow, tunable, and symmetric emission spectra, QDs have much greater temporal stability and resistance to photobleaching than organic fluorophores. Moreover, there are many alternatives in QDs with NIR emission compared with organic fluorophores. For in vivo imaging applications of QDs, the fluorescent emission wavelength ideally should be in a region of the spectrum where blood and tissue absorb minimally but is still detectable by the instruments, which is the NIR region (approximately 750-900 nm).[16, 17] Moreover, the QDs with NIR emission would allow to image deeper tissues than the visible QDs do. Another critical issue for the in vivo applications of QDs is the hydrodynamic diameter of nanoparticles. QDs with large size (> 20 nm in diameter) suffer from extremely high reticuloendothelial system (RES) uptake,[18] which reduce their efficiency and sensitivity. Recently, the ultrasmall water-soluble QDs (< 10 nm) have attracted more and more attentions because of their unique properties and the advantages for in vivo applications, that is, the rapid renal clearance of QDs may minimize the potential toxicity to the body.[19-21] Moreover, because of the ability to extravasate leaky tumor blood vessels, the ultrasmall QDs may show higher opportunity of EPR effect for tumor targeting over the large QDs. Herein, we demonstrated that the mercaptopropionic acid (MPA) coated InAs/InP/ZnSe QDs[22, 23] with emission maximum at about 800 nm (QD800-MPA) exhibited high tumor-uptake. There are several advantageous properties of QD800-MPA (Figure S1, Supporting Information): (i) the emission wavelength of 800 nm (higher than 750 nm) ensures the low tissue background and high tissue penetration; (ii) the hydrodynamic diameter of smaller than 10 nm allows renal clearance, minimizes the RES uptake, and enhances the possibility of EPR effect;[24-26] (iii) no cadmium suggests low toxicity to the body; and (iv) the QD800-MPA shows significantly long circulation half-life compared with QD800 ITK carboxyl (QD800-COOH) from Invitrogen.[22] As shown in Scheme 1, ultrasmall QD800-MPA nanoparticles pass through the normal blood vessels, and then extravasate from the vessels when they reach the angiogenic tumor vessels because of the leaky tumor vasculatures, finally, they accumulate preferentially at the tumor sites through the EPR effect because tumors lack an effective lymphatic drainage system.[27, 28] Using 22B and LS174T tumors as the models, in vivo and ex vivo fluorescence imaging showed that QD800-MPA was highly accumulated in the tumor area after 4 h postinjection (p.i.).
Scheme 1.
The structure of QD800-MPA and the illustration of the passive tumor targeting of QD800-MPA in tumor model.
2. Results and Discussion
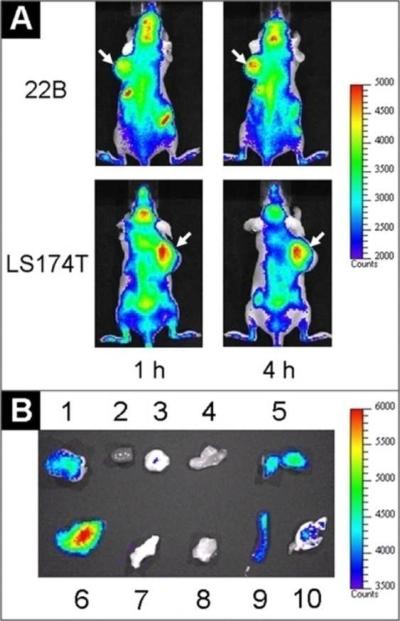
Because of the advantages of QD800-MPA we mentioned above, we chose two representative tumor models, 22B and LS174T, as the examples to test the in vivo imaging. After intravenous injection of QD800-MPA (200 pmol) into the nude mice bearing subcutaneous 22B tumor and LS174T tumor, respectively (tumor size: 5-8 mm in diameter), fluorescence images were acquired at multiple time points p.i. using IVIS Imaging System (IVIS 100 Series). The excitation wavelength should be in the red or NIR range to maximize the tissue penetration for in vivo imaging, but the quantum efficiency of the nanoparticles may decrease with the longer excitation wavelengths. To optimize the imaging conditions, we set the Cy5.5 excitation filter (615-665 nm) and the ICG emission filter (800-875 nm) to take the fluorescence images with the strongest fluorescent signal and lowest background. As shown in Figure 1A, the fluorescence signal derived from QD800-MPA both appeared in the 22B tumor and LS174T tumor (arrows) after 1 hour injection, and the signal of other organs was low. The tumor fluorescence intensity increased over the time. After 4 hours, the tumors were very distinguishable from other tissues with good fluorescence contrast, indicating high tumor uptake of QD800-MPA. Ex vivo imaging (Figure 1B) further confirmed the obvious fluorescence signal from tumor, although the fluorescence intensity of liver was highest among all the organs. The high kidney uptake of the QDs and the high fluorescent signal of bladder (Figure S2, Supporting Information) suggest that the nanoparticles were kept small in the blood circulation, leading to efficient urinary excretion and elimination of QDs from the body. The UV/Vis absorption and fluorescence emission spectra of urine (Figure S2, Supporting Information) further confirmed the existence of QDs in urine through the renal clearance.
Figure 1.
In vivo and ex vivo fluorescence imaging by the tail vein injection of QD800-MPA. (A) In vivo NIR fluorescence imaging of 22B tumor-bearing mice and LS174T tumor-bearing mice (arrows) at 1 h and 4 h. (B) Representative ex vivo imaging at 4 h time point. 1, 22B tumor; 2, heart; 3, pancreas; 4, intestine; 5, kidney; 6, liver; 7, skin; 8, muscle; 9, spleen; 10, lung.
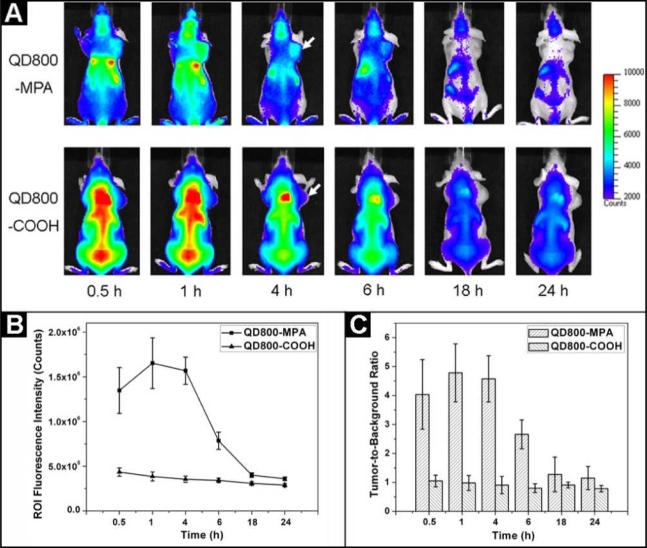
In order to confirm the specificity of QD800-MPA for high tumor uptake, we conducted a parallel test using QD800-COOH (Invitrogen) as the control sample. The hydrodynamic diameter of QD800-COOH is about 25 nm, which is much larger than QD800-MPA. Fluorescence images over 24 hours after the injections of these two samples into the nude mice bearing 22B tumors were acquired to investigate the clearance of QDs. As shown in Figure 2A, the fluorescence signal of tumor with good contrast was observed when we injected QD800-MPA into the nude mice (from 0.5 h to 4 h). After 6 hours, the fluorescence intensity slowly decreased likely due to the renal clearance of QD800-MPA.Very low fluorescence intensity remained at 18 h time point, suggesting the efficient elimination of QD800-MPA from the body. However, there was no obvious tumor contrast for QD800-COOH sample throughout the study, while the fluorescence from liver, bone marrow, and spleen was particularly bright (from 0.5 h to 6 h). The high nonspecific RES uptake is attributed to the big size of the nanoparticles. The high liver uptake resulted in inefficient elimination of QD800-COOH as the excretion of big nanoparticles into bile is extremely relatively slow process, which may increase the likelihood of toxicity to the body.[19] Under the assistance of Living Image® software, we recorded the information of regions of interest (ROIs) and computed the statistical data for the ROI measurements. As shown in Figure 2B, after about 1 h p.i. of QD800-MPA, the fluorescence signal of tumor reached the maximum and then started to decrease over time (tumor-to-background ratios were 4.0 ± 1.2, 4.8 ± 1.0, 4.6 ± 0.8, 2.6 ± 0.5, 1.3 ± 0.6, and 1.1 ± 0.4 at 0.5, 1, 4, 6, 18, and 24 h p.i., respectively, n = 3/group, Figure 2C), while there was little to no tumor contrast on the QD800-COOH injected mice (tumor-to-background ratios were 1.1 ± 0.2, 1.0 ± 0.3, 0.9 ± 0.3, 0.8 ± 0.2, 0.9 ± 0.1, and 0.8 ± 0.1 at 0.5, 1, 4, 6, 18, and 24 h p.i., respectively, n = 3/group, Figure 2C).
Figure 2.
(A) In vivo NIR fluorescence imaging of 22B tumor-bearing mice (arrows) injected with QD800-MPA and QD800-COOH, respectively. (B) Tumor fluorescence intensity-time and (C) tumor-to-background ratios of mice injected with QD800-MPA and QD800-COOH, respectively. The data were represented as mean ± standard deviation (SD), n = 3/group.
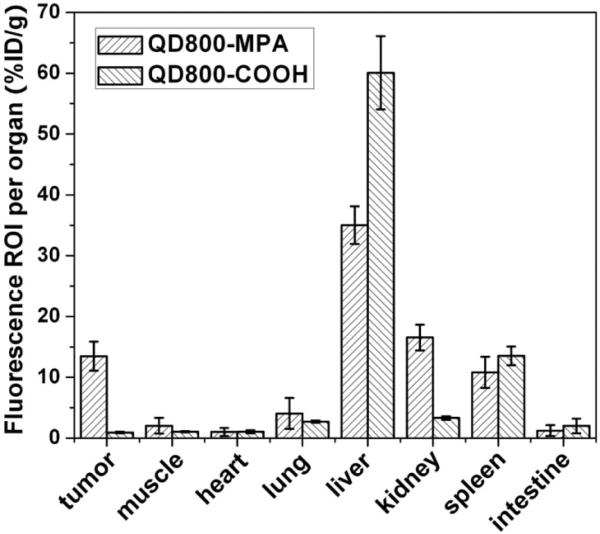
We also performed ROI analysis on the ex vivo fluorescence images to semi-quantitatively study the uptake ratio of QDs in each organ. Using QD800-COOH as the control, the ex vivo imaging indicated the uptake of QD800-COOH mainly happened in the liver and spleen (Figure S3, Supporting Information), which is consistent with the in vivo results. As shown in Figure 3, for the mice injected with QD800-MPA, the ROI analysis showed high tumor uptake of about 13.5 %ID/g, indicating the tumor uptake of QDs is high. The tumor uptake of QD800-COOH under the same condition was less than 1 %ID/g. The liver uptake ratio of QD800-MPA was much lower than that of QD800-COOH, while the kidney uptake ratio was reversed, which suggest that the small nanoparticles (QD800-MPA) may be rapidly eliminated from the body through renal clearance and the excretion of big nanoparticles (QD800-COOH) is slow through the bile.
Figure 3.
ROI analysis of major organs in ex vivo fluorescence imaging after 4 h p.i. of QD800-MPA and QD800-COOH, respectively.
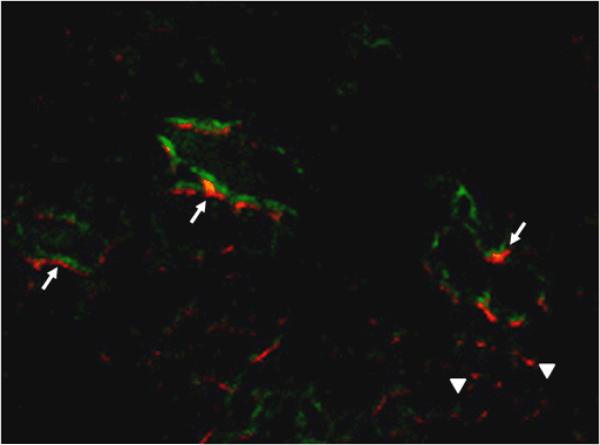
To prove that the fluorescence analysis indeed reflected the real accumulation of QD800-MPA in the organs, we further conducted the elemental analysis using inductively coupled plasma (ICP) spectrometry. Because the major composition of QD800-MPA is indium, we harvested and digested the organs at 4 h p.i. for ICP analysis of In content (Figure S4, Supporting Information). The distribution of indium (Table 1) indicated that the injected QD800-MPA mainly accumulated in liver, kidney, and spleen with the In amount of about 42.6, 18.9, and 10.3 %ID/g, respectively. The In amount in 22B tumor was about 11.0 %ID/g. This result approximately matches with the ex vivo fluorescence image (Figure 1B) and ROI analysis (Figure 3), suggesting that the QD800-MPA is stable enough in vivo for at least 4 hours. Moreover, the QD800-MPA is a good candidate as fluorescent probes for in vivo tumor imaging due to the high tumor uptake through EPR effect. In order to investigate the microscopic location of QD800-MPA in the tumors (Figure S5, Supporting Information), FITC-lectin was tail vein injected at 4 h p.i. of QD800-MPA, the mice were sacrificed and tumors were collected at 10 min after FITC-lectin injection. From the fluorescence overlay image (Figure 4), we found that QD800-MPA were located both within the tumor vessels (arrows), overlay with the FITC staining signal (green) and out of the tumor vessels (arrow heads) without overlay with the FITC staining, suggesting the leakage of the ultrasmall QD800-MPA from the tumor vasculature into the interstitial space as illustrated in Scheme 1.
Table 1.
The comparison of ICP analysis and ROI analysis of major organs at 4 h p.i. of QD800-MPA nanoparticles (n = 3/group, dose = 200 pmol /mouse).
| ICP (%ID/g) | ROI (%ID/g) | |
|---|---|---|
| tumor | 10.98 ± 2.02 | 13.46 ± 2.39 |
| muscle | 0.23 ± 0.13 | 2.22 ± 1.28 |
| heart | 0.26 ± 0.07 | 1.02 ± 0.66 |
| lung | 3.18 ± 1.38 | 4.06 ± 2.54 |
| liver | 42.57 ± 6.36 | 35.02 ± 3.08 |
| kidney | 18.94 ± 1.89 | 16.54 ± 2.13 |
| spleen | 10.32 ± 2.89 | 10.80 ± 2.56 |
| intestine | 1.50 ± 0.58 | 1.23 ± 0.89 |
| bone | 1.81 ± 0.80 | 1.12 ± 0.81 |
| blood | 4.60 ± 0.67 | N/A |
Figure 4.
Overlay of QD800-MPA fluorescence image and FITC-lectin staining image of frozen 22B tumor tissue slices (5 μm in thickness). Arrows point to QD800-MPA particles stayed within tumor blood vessel, while arrowheads indicate extravsated QD800-MPA nanoparticles. Magnification ×200.
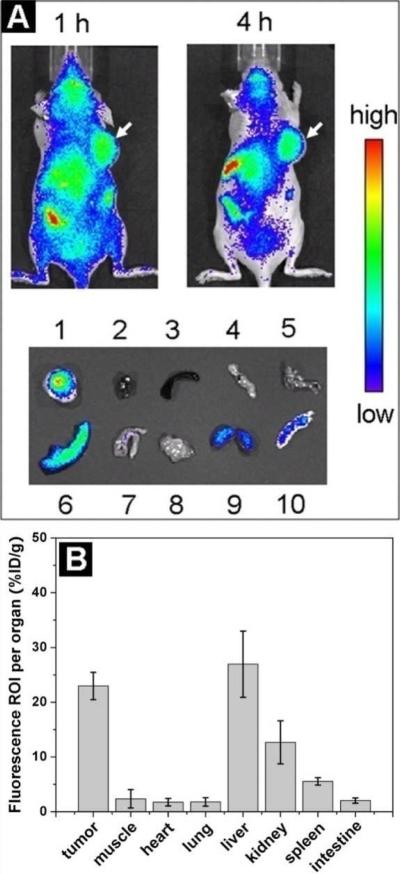
Because the relatively high accumulation of QD800-MPA in the RES system (e.g., liver and spleen) may cause the potential toxicity to the body, we thus coated the QD800-MPA particles with human serum albumin (HSA) protein (Figure S6, Supporting Information) probably by electrostatic interactions[29, 30] and tested the in vivo imaging. HSA is the major soluble protein of the circulatory system and contributes significantly to aid in the transportation and distribution of numerous endogenous and exogenous entities in the body.[31-34] The negative surface charge of QD800-MPA nanoparticles was neutralized after the coating of HSA.[34] Gel electrophoresis analysis confirmed the binding of QD800-MPA and HSA (Figure S6, Supporting Information).The QD800-MPA may physically absorb the proteins in the blood vessels and tend to be recognized and engulfed by the macrophage cells. The HSA coated QD800-MPA nanoparticles (QD800-MPA-HSA) may have no protein absorption in the blood vessels, decrease the probability of engulfment by macrophage cells, and reduce the accumulation of nanoparticles in the mononuclear phagocytic system (MPS) organs. Using LS174T tumor-bearing mice as the model, we tested the in vivo fluorescence imaging by intravenous injection of QD800-MPA-HSA (100 pmol/mouse). As shown in Figure 5A, the fluorescence signal at tumor (arrows) was very high probably due to the EPR effect. More importantly, the fluorescence intensity of liver and spleen was moderate from the ex vivo imaging, indicating the accumulation of QD800-MPA-HSA in MPS-related organs became obscure. The tumor uptake was about 23.0 ± 2.4 %ID/g at 4 h p.i. (n = 3/group, Figure 5B), which is close to that of liver (26.9 ± 6.0 %ID/g, n = 3/group). The preliminary results shown here are very encouraging, further studies of QD800-MPA-HSA are underway.
Figure 5.
(A) In vivo imaging and ex vivo imaging (4 h p.i.) of LS174T tumor-bearing mice (arrows) after the tail vein injection of QD800-MPA-HSA nanoparticles. 1, LS174T tumor; 2, heart; 3, spleen; 4, pancreas; 5, lung; 6, liver; 7, intestine; 8, muscle; 9, kidney; 10, skin. (B) ROI analysis of major organs after 4 h p.i. of QD800-MPA-HSA.
3. Conclusion
In summary, we have investigated the in vivo fluorescence imaging using QD800-MPA. The QD800-MPA nanoparticles are ultrasmall, NIR fluorescent, and non-cadmium containing. The results showed high tumor uptake of QD800-MPA (e.g., 22B and LS174T) with excellent contrast from the surrounding tissues, presumably due to the EPR effect of the ultrasmall sized nanoparticles. Moreover, the QDs may be rapidly eliminated through the renal clearance, which reduces the potential toxicity to the body. QD800-MPA-HSA showed much lower RES uptake and higher tumor accumulation than QD800-MPA. We believe that this type of QDs will become good candidates for in vivo fluorescence and bioluminescence imaging applications.
4. Experimental Section
Reagents
Tissue culture reagents (Invitrogen), FITC-lectin (Vector Laboratories, Inc), and mercaptopropionic acid (Aldrich) are all commercially available.
Preparation of QD800-MPA and QD800-MPA-HSA
The synthesis of InAs/InP/ZnSe core/shell/shell QDs (emission maximum at about 800 nm) is similar as the previous publication.[22] The as-synthesized QD800 coated with nonpolar ligands were transferred into aqueous solution by the treatment with mercaptopropionic acid (MPA) under basic conditions. Typically, the mixture of 1 mL of chloroform containing QD800 (1 nmol) and 1 mL of 5 mM MPA solution (pH ~ 8) became the bi-layer phase. The QD800 transferred to aqueous phase to become QD800-MPA after violent vortex for about 4 hours. The as-prepared QD800-MPA was purified by centrifugation using Millipore (Centrifugal filter devices, 30K) at 3000 rpm for 15 min to remove the excess amount of MPA. The final concentration of QD800-MPA in PBS buffer (1X) was about 1 μM ready for animal use. The mixing of 1 mL of 1 μM QD800-MPA and ~1 mg of human serum albumin (HSA) protein (~15 nmol) produced QD800-MPA-HSA by electrostatic interactions.
Animal model
Animal experiments were performed according to a protocol approved by the Stanford University Institutional Animal Care and Use Committee. The tumor model was established by subcutaneous injection of cancer cells (~5×10⁶ in 50 μL of PBS) into the front flank of female athymic nude mice (Harlan). The mice were subjected to imaging studies when the tumor volume reached 200–500 mm3 (3–4 weeks after inoculation).
In vivo and ex vivo fluorescence imaging
After the tail vein injection of QD800-MPA and QD800-COOH, respectively (~200 μL each mouse), the mice were monitored at multiple time points (e.g., 0.5, 1, 4, 6, 18, and 24 h) using IVIS Imaging System (IVIS® 100 Series; Cy5.5 excitation filter: 605–665 nm, ICG emission filter 800-875 nm). For ex vivo imaging, after the tumors and major organs were harvested, the tissues were subjected to fluorescence imaging using IVIS Imaging System immediately.
Ex vivo histology study
After 4 h p.i. of QD800-MPA, the mice were sacrificed and the major organs were harvested and frozed in OCT medium (Sakura Finetek) immediately. For the tumor staining, FITC-lectin was tail vein injected into the 22B tumor-bearing mouse at 4 h p.i. of QD800-MPA, the tumor was harvested after 10 min and frozed in OCT medium immediately. The tissues were cut into 5-μm-thick slices using microtome for fluorescence microscopy studies.
Supplementary Material
Acknowledgements
This work was partially supported by NCI/NIH R21 CA121842 and U54 CA119367.
Footnotes
Supporting Information is available on the WWW under http://www.small-journal.com or from the author.
Contributor Information
Dr. Jinhao Gao, Molecular Imaging Program at Stanford, Department of Radiology and Bio-X Program, School of Medicine, Stanford University, 1201 Welch Road, Stanford, CA 94305-5484, USA.
Dr. Kai Chen, Molecular Imaging Program at Stanford, Department of Radiology and Bio-X Program, School of Medicine, Stanford University, 1201 Welch Road, Stanford, CA 94305-5484, USA
Dr. Renguo Xie, Department of Chemistry and Biochemistry, University of Arkansas, Fayetteville, AR 72701, USA
Dr. Jin Xie, Molecular Imaging Program at Stanford, Department of Radiology and Bio-X Program, School of Medicine, Stanford University, 1201 Welch Road, Stanford, CA 94305-5484, USA
Dr. Seulki Lee, Molecular Imaging Program at Stanford, Department of Radiology and Bio-X Program, School of Medicine, Stanford University, 1201 Welch Road, Stanford, CA 94305-5484, USA
Zhen Cheng, Molecular Imaging Program at Stanford, Department of Radiology and Bio-X Program, School of Medicine, Stanford University, 1201 Welch Road, Stanford, CA 94305-5484, USA
Xiaogang Peng, Department of Chemistry and Biochemistry, University of Arkansas, Fayetteville, AR 72701, USA
Xiaoyuan Chen, Molecular Imaging Program at Stanford, Department of Radiology and Bio-X Program, School of Medicine, Stanford University, 1201 Welch Road, Stanford, CA 94305-5484, USA.
References
- 1.Roco MC. Curr. Opin. Biotechnol. 2003;14:337. doi: 10.1016/s0958-1669(03)00068-5. [DOI] [PubMed] [Google Scholar]
- 2.Whitesides GM. Nat. Biotechnol. 2003;21:1161. doi: 10.1038/nbt872. [DOI] [PubMed] [Google Scholar]
- 3.Katz E, Willner I. Angew. Chem., Int. Edit. 2004;43:6042. doi: 10.1002/anie.200400651. [DOI] [PubMed] [Google Scholar]
- 4.Cai WB, Chen XY. Small. 2007;3:1840. [Google Scholar]
- 5.Michalet X, Pinaud FF, Bentolila LA, Tsay JM, Doose S, Li JJ, Sundaresan G, Wu AM, Gambhir SS, Weiss S. Science. 2005;307:538. doi: 10.1126/science.1104274. [DOI] [PMC free article] [PubMed] [Google Scholar]
- 6.Cai WB, Hsu AR, Li ZB, Chen XY. Nanoscale Res. Lett. 2007;2:265. doi: 10.1007/s11671-007-9061-9. [DOI] [PMC free article] [PubMed] [Google Scholar]
- 7.Stroh M, Zimmer JP, Duda DG, Levchenko TS, Cohen KS, Brown EB, Scadden DT, Torchilin VP, Bawendi MG, Fukumura D, Jain RK. Nat. Med. 2005;11:678. doi: 10.1038/nm1247. [DOI] [PMC free article] [PubMed] [Google Scholar]
- 8.Cai WB, Shin DW, Chen K, Gheysens O, Cao QZ, Wang SX, Gambhir SS, Chen XY. Nano Lett. 2006;6:669. doi: 10.1021/nl052405t. [DOI] [PubMed] [Google Scholar]
- 9.Cai WB, Chen K, Li ZB, Gambhir SS, Chen XY. J. Nucl. Med. 2007;48:1862. doi: 10.2967/jnumed.107.043216. [DOI] [PubMed] [Google Scholar]
- 10.Tada H, Higuchi H, Wanatabe TM, Ohuchi N. Cancer Res. 2007;67:1138. doi: 10.1158/0008-5472.CAN-06-1185. [DOI] [PubMed] [Google Scholar]
- 11.Diagaradjane P, Orenstein-Cardona JM, Colon-Casasnovas NE, Deorukhkar A, Shentu S, Kuno N, Schwartz DL, Gelovani JG, Krishnan S. Clin. Cancer Res. 2008;14:731. doi: 10.1158/1078-0432.CCR-07-1958. [DOI] [PubMed] [Google Scholar]
- 12.Yong KT, Ding H, Roy I, Law WC, Bergey EJ, Maitra A, Prasad PN. ACS Nano. 2009;3:502. doi: 10.1021/nn8008933. [DOI] [PMC free article] [PubMed] [Google Scholar]
- 13.Law WC, Yong KT, Roy I, Ding H, Hu R, Zhao WW, Prasad PN. Small. 2009;5:1302. doi: 10.1002/smll.200801555. [DOI] [PubMed] [Google Scholar]
- 14.Yang LL, Mao H, Wang YA, Cao ZH, Peng XH, Wang XX, Duan HW, Ni CC, Yuan QG, Adams G, Smith MQ, Wood WC, Gao XH, Nie SM. Small. 2009;5:235. doi: 10.1002/smll.200800714. [DOI] [PMC free article] [PubMed] [Google Scholar]
- 15.Yong KT, Roy I, Ding H, Bergey EJ, Prasad PN. Small. 2009;5:1997. doi: 10.1002/smll.200900547. [DOI] [PubMed] [Google Scholar]
- 16.Lim YT, Kim S, Nakayama A, Stott NE, Bawendi MG, Frangioni JV. Mol. Imaging. 2003;2:50. doi: 10.1162/15353500200302163. [DOI] [PubMed] [Google Scholar]
- 17.Gao JH, Xu B. Nano Today. 2009;4:37. [Google Scholar]
- 18.Schipper ML, Iyer G, Koh AL, Cheng Z, Ebenstein Y, Aharoni A, Keren S, Bentolila LA, Li JQ, Rao JH, Chen XY, Banin U, Wu AM, Sinclair R, Weiss S, Gambhir SS. Small. 2009;5:126. doi: 10.1002/smll.200800003. [DOI] [PMC free article] [PubMed] [Google Scholar]
- 19.Choi HS, Liu W, Misra P, Tanaka E, Zimmer JP, Ipe BI, Bawendi MG, Frangioni JV. Nat. Biotechnol. 2007;25:1165. doi: 10.1038/nbt1340. [DOI] [PMC free article] [PubMed] [Google Scholar]
- 20.Liu WH, Choi HS, Zimmer JP, Tanaka E, Frangioni JV, Bawendi M. J. Am. Chem. Soc. 2007;129:14530. doi: 10.1021/ja073790m. [DOI] [PMC free article] [PubMed] [Google Scholar]
- 21.Park JH, Gu L, von Maltzahn G, Ruoslahti E, Bhatia SN, Sailor MJ. Nat. Mater. 2009;8:331. doi: 10.1038/nmat2398. [DOI] [PMC free article] [PubMed] [Google Scholar]
- 22.Xie RG, Chen K, Chen XY, Peng XG. Nano Res. 2008;1:457. doi: 10.1007/s12274-008-8048-x. [DOI] [PMC free article] [PubMed] [Google Scholar]
- 23.Kim SW, Zimmer JP, Ohnishi S, Tracy JB, Frangioni JV, Bawendi MG. J. Am. Chem. Soc. 2005;127:10526. doi: 10.1021/ja0434331. [DOI] [PubMed] [Google Scholar]
- 24.Maeda H. Adv. Enzyme Regul. 2001;41:189. doi: 10.1016/s0065-2571(00)00013-3. [DOI] [PubMed] [Google Scholar]
- 25.Cho KJ, Wang X, Nie SM, Chen Z, Shin DM. Clin. Cancer Res. 2008;14:1310. doi: 10.1158/1078-0432.CCR-07-1441. [DOI] [PubMed] [Google Scholar]
- 26.Nel AE, Madler L, Velegol D, Xia T, Hoek EMV, Somasundaran P, Klaessig F, Castranova V, Thompson M. Nat. Mater. 2009;8:543. doi: 10.1038/nmat2442. [DOI] [PubMed] [Google Scholar]
- 27.Carmeliet P, Jain RK. Nature. 2000;407:249. doi: 10.1038/35025220. [DOI] [PubMed] [Google Scholar]
- 28.Gao XH, Cui YY, Levenson RM, Chung LWK, Nie SM. Nat. Biotechnol. 2004;22:969. doi: 10.1038/nbt994. [DOI] [PubMed] [Google Scholar]
- 29.Ross PD, Subramanian S. Biochemistry. 1981;20:3096. doi: 10.1021/bi00514a017. [DOI] [PubMed] [Google Scholar]
- 30.Grymonpre KR, Staggemeier BA, Dubin PL, Mattison KW. Biomacromolecules. 2001;2:422. doi: 10.1021/bm005656z. [DOI] [PubMed] [Google Scholar]
- 31.He XM, Carter DC. Nature. 1992;358:209. doi: 10.1038/358209a0. [DOI] [PubMed] [Google Scholar]
- 32.Desai N, Trieu V, Yao ZW, Louie L, Ci S, Yang A, Tao CL, De T, Beals B, Dykes D, Noker P, Yao R, Labao E, Hawkins M, Soon-Shiong P. Clin. Cancer Res. 2006;12:1317. doi: 10.1158/1078-0432.CCR-05-1634. [DOI] [PubMed] [Google Scholar]
- 33.Hawkins MJ, Soon-Shiong P, Desai N. Adv. Drug Deliv. Rev. 2008;60:876. doi: 10.1016/j.addr.2007.08.044. [DOI] [PubMed] [Google Scholar]
- 34.Xiao Q, Huang S, Qi ZD, Zhou B, He ZK, Liu Y. BBA-Proteins Proteomics. 2008;1784:1020. doi: 10.1016/j.bbapap.2008.03.018. [DOI] [PubMed] [Google Scholar]
Associated Data
This section collects any data citations, data availability statements, or supplementary materials included in this article.


