Abstract
The recent progress in therapy if acid disease has relied heavily on the performance of drugs targeted against the H,K ATPase of the stomach and the H2 receptor antagonists. It has become apparent in the last decade that the proton pump is the target that has the likelihood of being the most sustainable area of therapeutic application in the regulation of acid suppression. The process of activation of acid secretion requires a change in location of the ATPase from cytoplasmic tubules into the microvilli of the secretory canaliculus of the parietal cell. Stimulation of the resting parietal cell, with involvement of F-actin and ezrin does not use significant numbers of SNARE proteins, because their message is depleted in the pure parietal cell transcriptome. The cell morphology and gene expression suggest a tubule fusion-eversion event. As the active H,K ATPase requires efflux of KCl for activity we have, using the transcriptome derived from 99% pure parietal cells and immunocytochemistry, provided evidence that the KCl pathway is mediated by a KCQ1/KCNE2 complex for supplying K+ and CLIC6 for supplying the accompanying Cl−. The pump has been modeled on the basis of the structures of different conformations of the sr Ca ATPase related to the catalytic cycle. These models use the effects of site directed mutations and identification of the binding domain of the K competitive acid pump antagonists or the defined site of binding for the covalent class of proton pump inhibitors. The pump undergoes conformational changes associated with phosphorylation to allow the ion binding site to change exposure from cytoplasmic to luminal exposure. We have been able to postulate that the very low gastric pH is achieved by lysine 791 motion extruding the hydronium ion bound to carboxylates in the middle of the membrane domain. These models also allow description of the K+ entry to form the K+ liganded form of the enzyme and the reformation of the ion site inward conformation thus relating the catalytic cycle of the pump to conformational models. The mechanism of action of the proton pump inhibitor class of drug is discussed along with the cysteines covalently bound with these inhibitors. The review concludes with a discussion of the mechanism of action and binding regions of a possible new class of drug for acid control, the K+ competitive acid pump antagonists.
Keywords: the H, K ATPase, acid secretion, acid pump antagonist, proton pump inhibitor
Acid secretion by the human stomach results in a median diurnal pH of 1.4. At the turn of the 19th century, it was recognized that acid secretion is involved in peptic ulcer disease (PUD). This paradigm held fast until the discovery that infection with Helicobacter pylori was a pathogenic factor in the development of PUD.1 Hence, before the recognition of the importance of H. pylori, treatment of PUD was focused only on the suppression of acid secretion. Presently, treatment of PUD includes not only inhibition of acid secretion, but, in H. pylori positive patients, also treatment with 2 antibiotics to eradicate the bacteria.2
Until the introduction of cimetidine, a histamine-2 receptor blocker,3 there was no therapy that was effective in suppressing acid secretion acceptable to patients. The introduction of this medication and other histamine-2 receptor antagonists revolutionized the treatment of PUD. However, these drugs, although effective in promoting healing of ulcers were not able to prevent ulcers from recurring and hence therapy had to be continued for a prolonged period (maintenance therapy). Additionally, tolerance to these medications developed in all patients after approximately 7 days of treatment, resulting in a reduction in their efficacy by approximately 50%.
The incidence of PUD in the Western world decreased during the 20th century, probably because of the lower infection rates with H. pylori. However, over the same period, the incidence of gastro-esophageal reflux disease (GERD) increased dramatically and the latter disorder is now the major gastric acid-related disorder. Histamine receptor antagonists are less effective in the treatment of GERD than for PUD.
In 1975, timoprazole, a compound was discovered that inhibited acid secretion irrespective of stimulus, be it extracellular or intracellular. The target of this class of drug, the proton pump inhibitors (PPIs) was shown to be the gastric H,K ATPase. The drug itself was shown to be a prodrug, requiring acid activation in the secretory canaliculus to inhibit ATPase activity.4 The first clinical studies of PPIs were obtained using a derivative of timoprazole (omeprazole) in 1983. The effectiveness of this agent led to the introduction of omeprazole as therapy for acid-related disease in 1989, followed by several other PPIs including lansoprazole, pantoprazole, and rabeprazole. Others of this class are in various stages of development. The effectiveness of these drugs derives from 2 factors: their target, the H+-K+ ATPase is the enzyme responsible for the last step in acid secretion; therefore, their action on acid secretion is independent of the stimulus to acid secretion, be it histamine, acetylcholine, or other yet to be discovered stimulants. Also, their mechanism of action involves covalent binding of the activated drug to the enzyme, resulting in a duration of action that far exceeds their plasma half-life.
Disadvantages of this class of drugs, however, include a relatively short plasma half-life and the requirement for an acidic parietal cell canalicular pH to enable the conversion of the prodrug to the active compound. Given these important limitations, considerable effort has been expended to develop different types of inhibitors of the ATPase without these limitations. The K+ competitive acid pump antagonists (APAs) do not depend on acid activation, but rather bind directly to the pump thus promising a more rapid onset and better inhibition of acid secretion. However, because the binding of these drugs is reversible and not covalent, their effectiveness requires maintenance of an adequate plasma level of the drug. They have a shorter duration of action than the PPIs. In contrast to the PPIs, however, they are acid stable and can readily be formulated in an extended release tablet to provide a long duration of action or can be given in the morning and at bedtime to inhibit diurnal and nocturnal acid secretion.
The first part of this review focuses on the mechanism of activation of the gastric H,K ATPase in the transition from a resting parietal cell to a stimulated parietal cell, the stimulation associated morphologic transformation. This is followed by identification of the conformations of the H,K ATPase that export protons and reabsorb potassium derived using homology modeling with another member of the P-type ATPase, the sarcoplasmic reticulum Ca ATPase, whose crystal structure has been elucidated with several conformations described.5–7
The last section of the review deals with the mechanism of action of the PPIs, their covalent binding sites, and possible improvements in their efficacy by extension of their dwell time in the blood. Finally, the delineation of the binding sites of the K+ competitive APAs will be discussed and preliminary clinical data on the effect of these drugs on gastric acid secretion will be projected.
ACTIVATION OF THE H,K ATPase
Cellular Location
The isolated hog gastric ATPase is obtained in relatively ion-tight vesicles and was shown to be a member of the P2 type ATPases where the first step of the reaction is phosphorylation of the catalytic subunit with then export of protons and this is followed by luminal K-dependent dephosphorylation and K reabsorption. This resulted in electroneutral exchange of cytoplasmic protons for exoplasmic potassium. The hog gastric vesicles did not show the presence of a KCl pathway and required the addition of ionophores for maximal ATPase activity.8 However, isolation of a heavy membrane fraction from stimulated stomach did show the presence of a KCl pathway, because ionophores were not required for the activation of acid transport. It was postulated that there were independent K and Cl conductive pathways in the membranes isolated from the stimulated state.9 Hence, there is a clear difference between pumps isolated from resting or stimulated tissue.
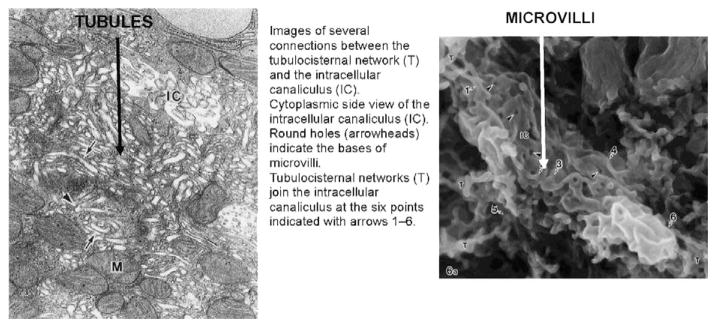
The H,K ATPase is found in what appears to be cytoplasmic membranes in the resting state and then in the microvilli of the expanded secretory canaliculus in the stimulated state.10,11 This morphologic change was assumed to result from the fusion of cytoplasmic vesicles with the rudimentary microvilli to form the elongated microvilli of the expanded secretory canaliculus.10,11 As with vesicle fusion in other cells, various snare proteins were proposed to be involved.10,11 However, different electron microscopic fixation methods such as flash freezing12 or hypertonic fixation showed that the pump was in microtubules, not vesicles.13 These data are more consistent with a morphologic transformation resulting from either tubule eversion or tubule fusion followed by eversion and not the standard exocytotic model of vesicle-vesicle fusion. Further, maceration of the stomach followed by scanning electron microscopy has shown the presence of a tubulo-cisternal network with several connection points to the resting intracellular canaliculus. Images derived from these latter methods are shown in Figure 1.
FIGURE 1.
On the left is a transmission electron microscope of a resting parietal cell after hypertonic fixation with glutaraldehyde and on the right is a scanning electron micrograph of a resting cell after protein extraction leaving the lipid framework. The tubular appearance is clear in the right hand image, as is the tubulo-cisternal network with contact points to the intracellular canaliculus.13
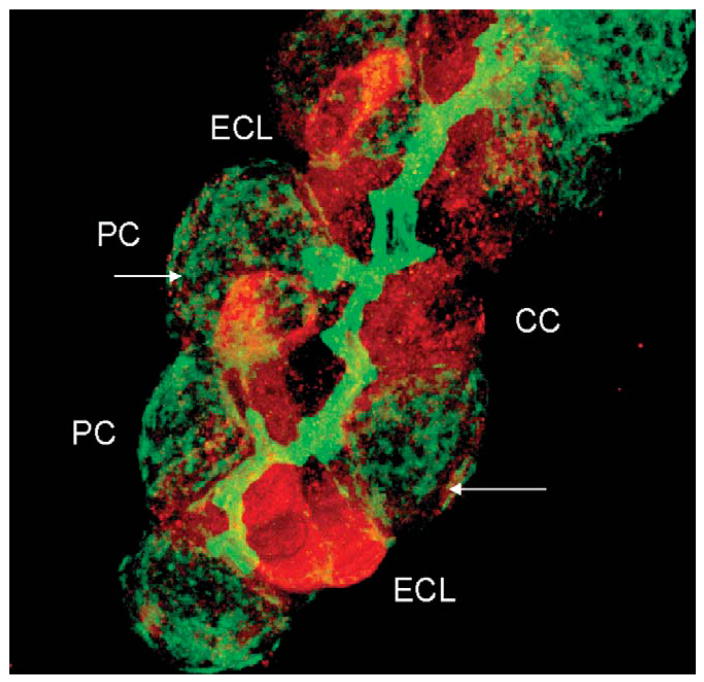
Also, normal exocytosis requires several proteins of the SNARE family to mediate the recruitment of vesicles and fusion with cellular membranes, such as the N-ethyl maleimide sensitive factor, syntaxin, and SNAP 25 or SNAP 23.14,15 Staining of a rabbit gastric gland for SNAP 25 (red) and F-actin (green) clearly shows the presence of the former in enterochromaffin-like (ECL) cells and peptic or chief cells and a paucity of staining in the parietal cell and in that cell the location is basal and not intracellular as would be expected from a regular exocytotic fusion process as shown in Figure 2.
FIGURE 2.
A confocal image of a rabbit gastric gland stained with antibody against F-actin (green) and SNAP 25 (red), showing the high levels of the latter in ECL cells known to exocytose histamine containing vacuoles and also high levels in chief (CC) or peptic cells that exocytose pepsinogen granules. Staining for SNAP 25 is very weak in parietal cells and largely on the basal surface of this cell as indicated by the arrows.
Further evidence against the vesicle hypothesis was derived from careful analysis of the transcriptome of 99% pure parietal cells and 95% pure ECL cells. The method used compares the expression levels of message in the purified cell preparations to the level of expression in the gastric epithelium. In this way, we can determine the enrichment of different mRNAs and also determine whether these messages are expressed in other cells of the gastric epithelium or even depleted in parietal cells. As can be seen in Table 1, although ECL cells express several mRNAs for SNARE proteins, very few are expressed in the parietal cell and these are in low abundance.16,17 These data can be interpreted as indicating that parietal cells do not express the normal complement of exocytotic proteins. Because the content of parietal cells is ~20% of the cell population and ECL cells about 1% and chief cells about 30%, the lack of enrichment of many of the SNARE proteins is likely indicative of their absence in parietal cells.
TABLE 1.
Levels of mRNA Expression of Identified SNARE Proteins Using Agilent Microarrays Comparing Levels in ECL Cells Compared With Epithelium (ECL/St) and Parietal Cells Compared With Stomach Epithelium (PC-100St) as Well as Signal Intensity on the Microarray
| Description | ECL/St | Intensity | PC/St | Intensity |
|---|---|---|---|---|
| Synaptosomal-associated protein (Snap25) | 7.16 | 5784 | 0.35 | 271 |
| Synaptosomal-associated protein (Snap23) | 1.07 | 826 | 0.8 | 642 |
| Syntaxin 3 (Stx3a) | 2.32 | 889 | 0.66 | 258 |
| Vesicle-associated membrane protein 1 (Vampl) | 2.31 | 5460 | 0.58 | 1411 |
| Vesicle-associated membrane protein 2 (Vamp2) | 1.39 | 1411 | 1 | 984 |
| Secretory carrier membrane protein 2 (Scamp2) | 1.24 | 9327 | 0.45 | 3455 |
| Kinesin family member 12(Kif12) | 8.65 | 5505 | 0.58 | 365 |
| Ras-related small GTP-binding protein 3c (Rab 3c) | 9.83 | 3473 | 0.47 | 167 |
| Ras-related small GTP-binding protein 5 (Rab 5a) | 0.68 | 217 | 3.01 | 952 |
| Ras-related small GTP-binding protein 21 (Rab 21) | 0.83 | 1589 | 1.44 | 2761 |
| Ras-related small GTP-binding protein 29 (Rab 29) | 1.92 | 11585 | 1.25 | 7471 |
| Ras-related small GTP-binding protein 14 (Rab l4) | 1.33 | 294.58 | 0.94 | 21047 |
| Ras-related small GTP-binding protein 11a (Rabl la) | 1.31 | 26940 | 0.97 | 20688 |
| Clathrin, light polypeptide (Lea) (Clta) | 0.86 | 64501 | 0.70 | 51982 |
| Clathrin, light polypeptide (Lcb) (Cltb) | 1.25 | 43409 | 1.02 | 34738 |
| Clathrin, heavy polypeptide (Hc) (Cite) | 0.64 | 23562 | 0.49 | 18311 |
| Ezrin | 0.77 | 698 | 2.36 | 1565 |
| Moesin | 0.72 | 6900 | 0.51 | 4942 |
| Spartin (microtubule interacting protein) | 1.21 | 4350 | 2.21 | 7777 |
| Dynamin 2 (Dnm2) | 0.94 | 34386 | 0.48 | 17511 |
| Tyrosine protein kinase pp60 c-src (Src) | 1.00 | 423 | 0.66 | 284 |
| LIM and SH3 protein 1 (Laspl) | 0.83 | 386 | 0.65 | 309 |
| Ankyrin (190 kd isoform) | 0.51 | 3412 | 1.85 | 12348 |
| Ankyrin 2 | 2.87 | 1619 | 0.77 | 472 |
| β spectrin 2 (fodrin) | 1.43 | 7536 | 0.88 | 4609 |
In italics are the genes enriched in ECL cells and in bold are the genes enriched in parietal cells.
From the table, many SNARE genes are relatively enriched in ECL cells but only a few such as Rab 5a, ezrin, spartin, and ankyrin are enriched in parietal cells and the last 3 are cytoskeletal interacting proteins not thought to be involved in exocytosis. The SNARE gene expression level is very low in most mRNAs that are enriched in ECL cell preparations. On the other hand, there are high mRNA levels in parietal cells for Rab 14, Rab 11a, and several clathrin components and also dynamin. Thus, although these are not enriched in pure parietal cells, their expression level indicates function for the products of these genes. For the clathrin and dynamin, these may be involved in the cycling between inverted tubulo-cisternae and the everted microvilli of the stimulated secretory canaliculus that may involve a restricted fusion mechanism different from general exocytosis.
ACTIVATION OF THE H,K ATPase
Potassium and Chloride Conductances
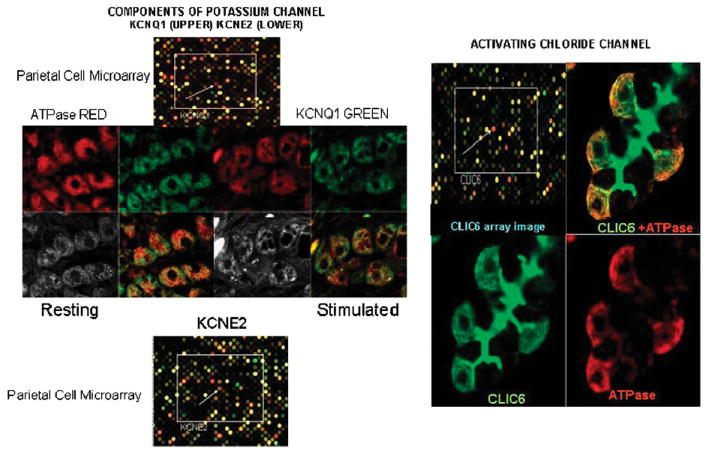
For acid secretion to occur, KCl has to be supplied to the external surface of the H,K ATPase in the microvilli of the secretory canaliculus. During acid secretion, of about 1.5 L per day, the concentration of KCl is about 15mM; thus the cell has to be replenished with these ions. There has been considerable controversy as to the nature of the K and Cl efflux pathways and the K entry pathway.17–21 The comparative transcriptome of the parietal cell afforded significant clues in that there were only some channels selectively enriched as compared with the gastric epithelium. The K channels found were the basolateral inward rectifying Kir5.1/Kir4.2 channel responsible for K repletion of K lost during secretion, the voltage insensitive but pH sensitive KCNQ1/KCNE2 K channel19,22 and the CLIC6 Cl channel23 as K and Cl secreting channels across the canalicular membrane.17 KCNQ1 and CLIC6 can be detected by antibody staining as can CLIC6, as shown in Figure 3. The localization of KCNQ1 and KCNE2 confirmed their the presence in the parietal cell and although there is no antibody available for KCNE2, a KCNE2 deficient mouse showed abnormal parietal cell morphology and lack of acid secretion.24 Similarly, a KCNQ1 mutant also had impaired gastric morphology and lack of acid secretion.25 The immunostaining of CLIC6 also confirmed its presence in the parietal cell and association with regions containing the H,K ATPase. These data are shown in Figure 3.
FIGURE 3.
Illustrations of purified parietal cell compared with whole gastric epithelium microarray data and immunostaining of K and Cl channels in rabbit gastric glands. On the top left is the image of the microarray showing in red fluorescence the spot corresponding to KCNQ1 and on the bottom left the spot corresponding to KCNE2 where the red fluorescence indicates higher expression in the parietal cell transcriptome. In the middle, there is the confocal image of staining with anti-ATPase α subunit in red and against KCNQ1 in green, showing their localization in both resting and stimulated glands. On the right top right is the microarray image showing high expression of CLIC6 in the parietal cell and then immunostaining of CLIC6 and ATPase bottom images and a fused image top right. There appears to be some colocalization of the channels with the ATPase in the parietal cell but particularly intense staining for CLIC6 in the lumen of the gastric gland.
On the basis of these findings, we present a model to describe the activation of the proton pump in the membrane of the secretory canaliculus as shown in Figure 4, identifying the channels necessary.
FIGURE 4.
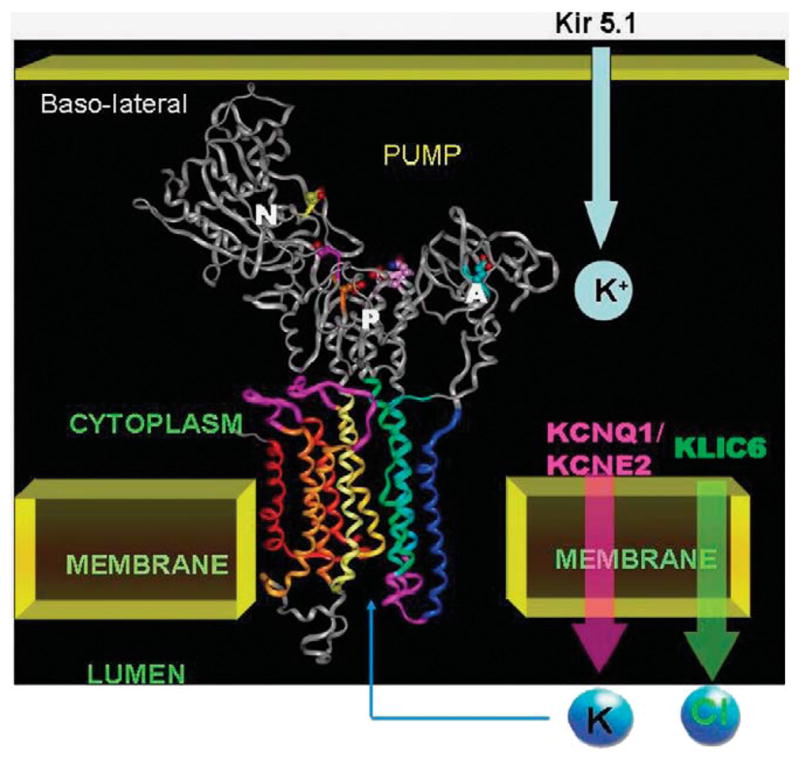
A model of the H,K ATPase on the basis of homology to the sr Ca ATPase in the E1 configuration that shall be discussed later shown the 3 cytoplasmic domains, N the nucleotide binding domain, P the phosphorylation domain, and A the actuator domain and the 10 transmembrane segments of the catalytic domain. The K+ entry path on the basolateral surface is postulated to be Kir5.1 that is highly expressed in parietal cells and the canalicular efflux pathways are the KCNQ1/KCNE2 complex for voltage independent K+ efflux and CLIC6 for Cl− efflux. These pathways allow KCl efflux and followed by K+ for H+ exchange by the ATPase, net production of HCl.
STRUCTURE-FUNCTION OF THE GASTRIC H,K ATPase
Work in the late 1970s established that the catalytic cycle of the enzyme was very similar to that of the Na,K ATPase as had been elucidated by Post et al.26 As shown in Figure 5, the enzyme is phosphorylated by binding of Mg.ATP and the hydronium ion, H30+ to form a conformation first with the ion binding site facing the cytoplasm, the E1P form along with formation of ADP. This conformer can rephosphorylate ADP. This form converts spontaneously to the form with the ion binding site facing the lumen the E2P form whereupon hydronium is released, stabilizing the E2P conformation and ADP can no longer be rephosphorylated. However, with K+ binding from the luminal surface, the Pi is released to the cytoplasm and E2K is formed. This is thought of as the ion occluded form, where there is a barrier to the movement of the ion out of the membrane domain in either direction. This E2K form then converts to E1K with the potassium site facing the cytoplasm and K+ is released upon binding of MgATP.27–29
FIGURE 5.
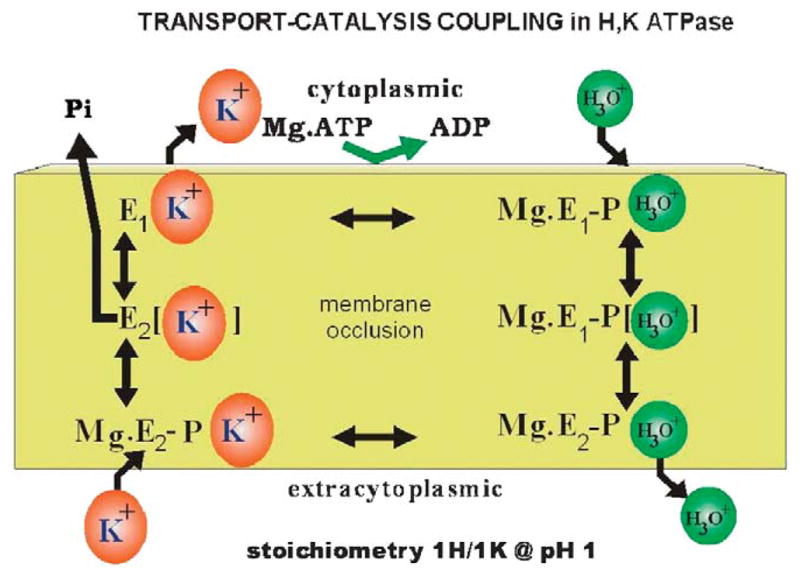
The classic scheme of the catalytic steps involved in a IH+/1K+/ATP transport at pH~1.0, where the catalytic subunit of the enzyme is phosphorylated by Mg.ATP to form Mg.E1-P.H30+ that can reverse to reform ATP. This form transits the occluded conformation very rapidly to expose the H30+ site to the outside in the Mg.E2-P.H30+ form, allowing release of the hydronium to the outside. K+ then binds from this surface resulting in dephosphorylation of the catalytic subunit to form the transiently K+ occluded form, which converts to E1.K+ that releases K+ to the cytoplasm accelerated by binding of a fresh molecule of Mg.ATP. H30+ is likely transported rather than H+ since at alkaline pH the pump can transport Na+.30
The ATPase, like the Na,K ATPase is composed of 2 subunits, the catalytic or α subunit containing 1033 amino acids with 10 transmembrane segments and a β subunit composed of 190 amino acids with 6 or 7 N linked glycosylation sites with the majority of this component on the exoplasmic surface. In vivo, the enzyme is a dimeric heterodimer [αβ]2,31 but the functional significance of this oligomeric structure is not known.
Using the structure of the homologous sr Ca ATPase and results of the efects of various site directed mutagenesis on the pump activity and cation affinity, it has been possible to infer the conformations of the H,K ATPase that accompany each step of the reaction pathway. It should be remembered, however, that these are homology models which may be correct in their overall conformation but the details of their structure must await high resolution crystals of the H,K ATPase. Further, the Ca ATPase does not have a β subunit, so the possible structural effects of the presence of this subunit in the gastric enzyme have had to be ignored in our modeling procedure. The β subunit is essential for proper folding and stability of the α subunit, which is rapidly degraded before transiting the endoplasmic reticulum to the cis-Golgi. There are some minor effects on K+ affinity with alterations in the β subunit but again their significance is unclear.32
General Modeling, Rigid Body Rotation, and Energy Minimization
Model building and molecular dynamics were performed on a Silicon Graphics Indigo O2 computer with Insight II and Discover 2000 software from Accelrys Inc, San Diego, using the consistent valence force field. All energy minimizations were carried out to an average absolute derivative of less than 0.1 kcal/moleÅ. Molecular dynamics simulations were at 310°K with 1-fs time steps, fixed dielectric constant of 15, and 15 or 23Å nonbonded cutoffs for ion or inhibitor simulations, respectively. Temperature was equilibrated for 200 fs before data collection at 200 fs intervals over the time lengths between 0.1 and 0.2 ns.
The backbone template for the new H,K ATPase model was the sr Ca ATPase crystallized with MgF3 at the active site to give an E2P homolog (pdb1.wpg). As in our previous model,33 the N domain used the peptide backbone of the crystal structure of the Na,K ATPase α2 isoform. The original model first was aligned with pdb1.wpg by superimposing peptide backbone coordinates in the homologous M5 and M6 segments. Then the N, A, P, M1, and M2 domains were isolated by severing the appropriate peptide bonds and overlaid on to the template, pdb1.wpg, using a minimum RMS deviation in the backbone atoms corresponding to homologous sequences as defined in the alignment used for the original model building.34 After these rigid body rotations, the connecting segments were added back in positions that matched those of the sr Ca ATPase, and the peptide bonds were reformed. As discussed later, additional constraints were used on the basis of the known binding sites of the PPIs and the mutation defined entry and binding sites of the APAs.
In Figure 6, we show 2 major conformers of the H,K ATPase in the E1 and E2 configurations where there is motion with the actuator domain now contacting the P domain in the E2 but no the E1 form. There is also motion in the membrane domain, particularly, striking is the displacement of the cytoplasmic end of transmembrane segments 1 and 2. There are also clear changes around the ion binding region in the middle of the membrane. In the lower part of Figure 6, we show the alignment of our H,K ATPase model with the defined crystal structure of the sr Ca ATPase in the E2 from and on the left of this diagram, a more detailed representation of the H,K ATPase again in the E2 form. In the N domain, the nucleotide binding site is shown and in the middle of the membrane, the ion binding domain containing several carboxylic acids. The lipids are placed in the membrane domain. Hence, there are major conformational changes in both the cytoplasmic and membrane domains as this P2 type ATPase exchanges H3O+ for K+. The transmembrane domains M1 to M4, M5 and M6 are especially sensitive to the changes in conformation of the cytoplasmic N and A domains.
FIGURE 6.
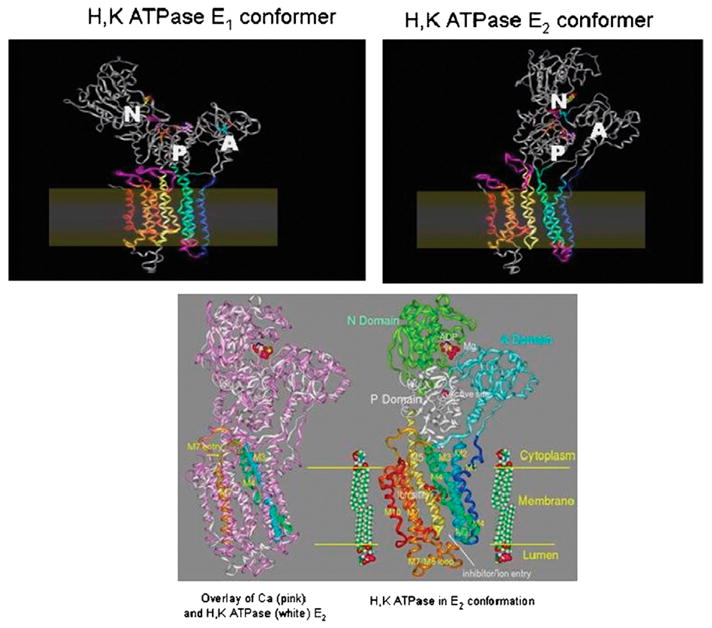
Homology models of the H,K and sr Ca ATPase: on the upper left is shown the model of the H,K ATPase in the E1 configuration with little interaction between the actuator (A) domain and the N or P domains. In the E2 conformation, the A domain is now in juxtaposition to the P and N domains with flexing of the M1 and M2 transmembrane segments and an apparent generation of a vestibule facing the lumen shown on the top right of the figure. The position of the membrane is shown in both upper images. On the bottom is the alignment of the H,K ATPase (white) with the sr Ca ATPase (pink) on the left hand side, showing correspondence in many regions and deviations of the homology model. Altered positions for transmembrane segments M3 and M4 (blue and green ribbons, respectively) are highlighted by lines representing the helix axes. The cytoplasmic entry into M7 (gold ribbon) is also changed. On the right is the image of the H,K ATPase in the E2 configuration, showing on the top the nucleotide and Mg binding region and in the middle of the membrane the ion binding carboxylic acids, both illustrated in ball and stick form.
We shall now discuss each step of the pump in turn, using our models as the basis for explaining proton pumping at pH~1.0 from a cluster of carboxylic acids, the effect of K+ addition from the luminal surface and the pathway taken by this cation to access its binding domain.33
The first model establishes the ion binding region in the membrane domain as shown in Figure 7, where there are 3 potential hydronium ion binding sites, the hydronium shown in stick form. We postulate that the hydronium ion that is exported to form 160mM HCl originates from the H2 region. The carboxylic amino acids liganding this site are glutamyls 795 and 820 and aspartyl 824. This is shown in Figure 7.
FIGURE 7.
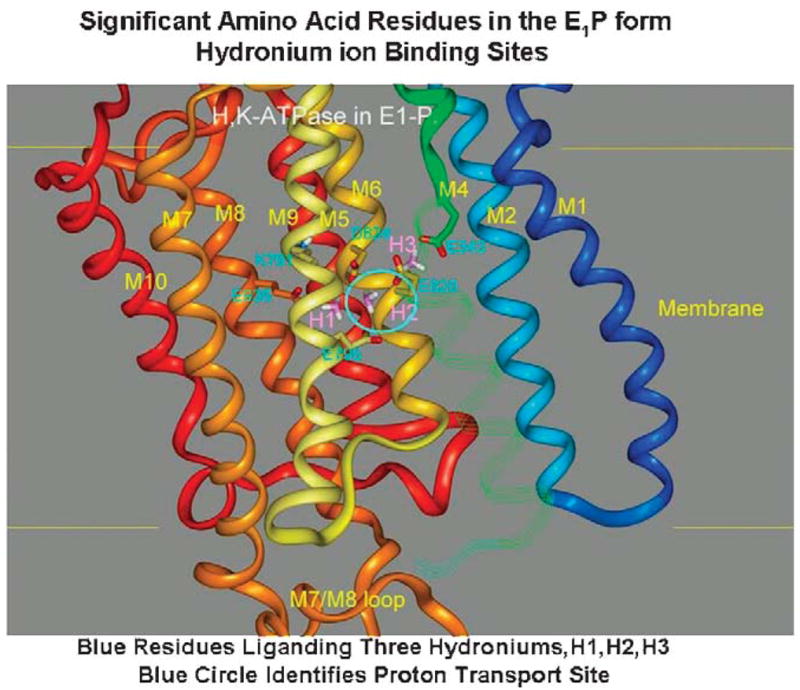
A homology model of the ion binding domain of the gastric H,K ATPase in the E1-P conformation. The carboxylic acid residues in this region are shown in cyan and the 3 potential hydroniums are shown in stick form and labeled H1, H2, and H3 (purple). The colors of the transmembrane helices are maintained in all the figures. The continuation of the M4 segment is in strand form and the M3 strand is omitted so as to visualize the binding domain. The cyan circle highlights the H2 site, which we believe to be dominant in countertransport of H3O+ and K+ by the H,K ATPase.
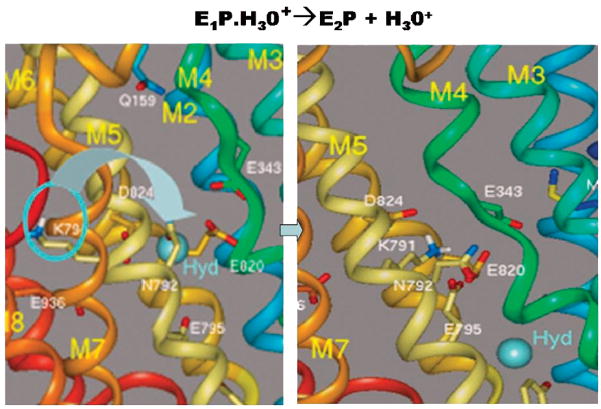
The next issue we address is the mechanism whereby the H3O+ is displaced by the formation of E1-P and transition to E2-P. Here, we identified lysine 791 as a unique residue that with conformational change in M5 could ligand the carboxylic acids binding H2. The affinity of the side chain for this domain would be sufficient to displace H30+ at a pKa low enough to result in the low pH reached by the H,K ATPase in vivo. This suggested model is shown in Figure 8 where lysine 791 motion is responsible for the expulsion of H30+ from the H2 site.
FIGURE 8.
The transport of H3O+ outward by the H,K ATPase depends on the substitution of this hydronium in the H2 position of Figure 7 by the group of lysine 791 owing to the changes in the conformation of TM5 and is accompanied by a change in the conformation of TM4 as also seen in the sr Ca ATPase transition. The left hand image shows the original position of the lysine and the right hand image the motion of the lysine into the H2 site of Figure 7 with displacement of the hydronium (hyd) toward the luminal face of the pump.
The displacement of hydronium from site H2 by Lys791 as suggested here is consistent with the effects of mutating the homologous lysine (Lys800) in the toad bladder H,K-ATPase.35 This pump is electroneutral and is known to transport Na+.36 However, a K+ stimulated outward current was observed in Na+ loaded oocytes injected with mutants K800A and K800E, showing that the replacement of the positive charge resulted in Na+ outward electrogenic transport. The corresponding S782R mutant of the normally electrogenic toad Na, K-ATPase was electroneutral.35 In each case, charge mutation or replacement resulted in electrogenic behavior opposite to wild type ATPase. These data are consistent with the presence of the R-NH3+ group of Lys791 in the ion transport site and support its postulated role in the electroneutral transport mechanism of the gastric H,K ATPase.
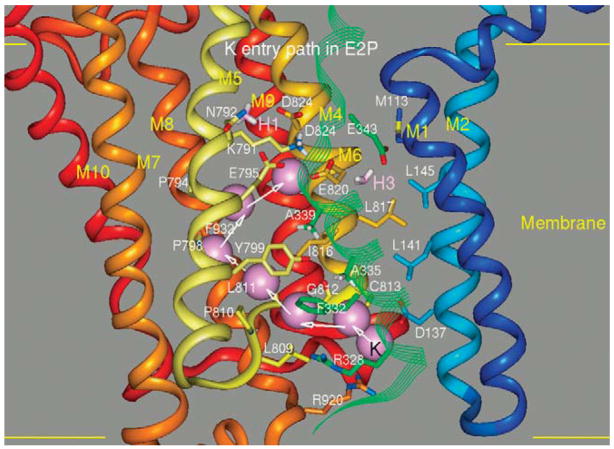
This conformation must allow K+ access to the ion binding site that now contains the of lysine, thus changing the E2-P conformation to E2.K+. The pathway for K+ entrance from the luminal surface is shown in Figure 9. The approach of the positively charged cation displaces glutamyls 795 and 820, allowing K+ to mobilize the lysine residue. The path was defined by applying a small steering force on the potassium to move it upwards in the channel allowing access to the ion binding region labeled H2 in Figure 7. The cation displaces lysine and then can move into the H3 binding site liganded by glutamyls 820 and 343 in the TM4 segment.
FIGURE 9.
The potassium entry pathway in the E2P conformation reaching the H2 binding domain displacing lysine 791 by binding glutamyls 795 and 820 is illustrated in Figure 7. As a result, the catalytic subunit dephosphorylates and the E2K form is generated before the transition to the E1K conformation.
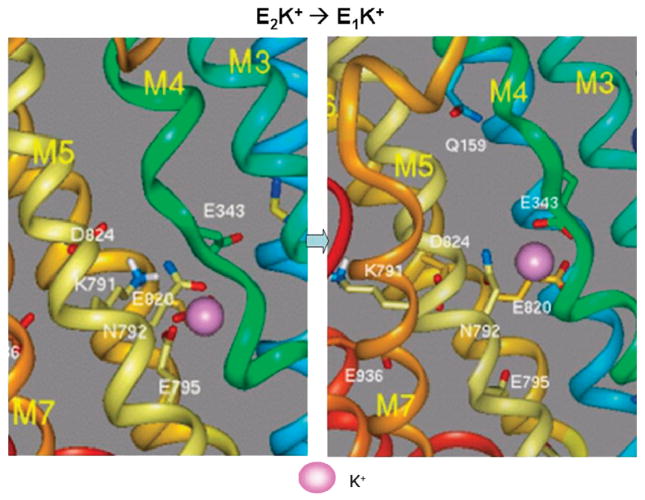
From this E2K conformation, the pump has now to reach the E1K conformation to allow exit of K to the cytoplasmic domain and lysine 791 must be further displaced to allow potassium to reach the initial point of exit. This model is shown in Figure 10.
FIGURE 10.
The transition from E2K to the E1K conformation whereby K can exit from the cytoplasmic surface of the pump. In the left hand image K is liganded by the carboxylates of glutamyls 795 and 820 with displacement of lysine 791. In the right hand image, lysine 791 has returned to the E1 conformation as have M1 and M2 and K has moved into a site where the carboxylates of glutamyl 820 in M6 and glutamyl 343 in M4 are now binding the potassium, partially the H3 site illustrated in Figure 7. E343 in M4 now moves with the transition of M1 and M1 to the E1 conformation providing a cytoplasmic exit pathway for K+.
H,K ATPase INHIBITORS
PPIs
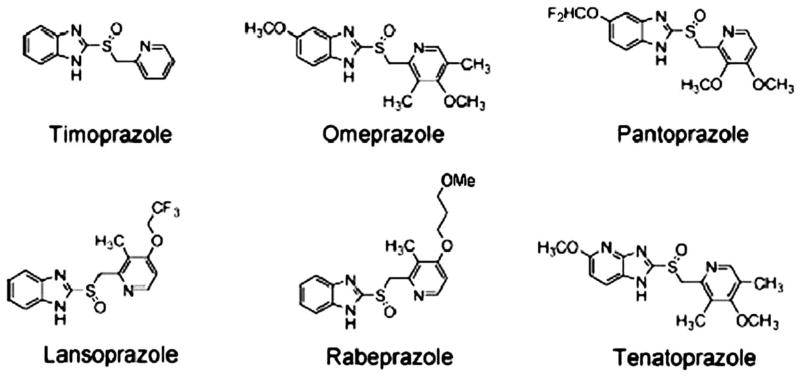
Beginning with the synthesis of timoprazole in 1975, the path to the development of PPIs began. The currently marketed PPIs have a core structure consisting of substituted pyridylmethylsulfinyl benzimidazoles and vary in terms of the substitutions on either the pyridine or the benzimidazole. Of the compounds in development one is an imidazopyridine rather than a benzimidazole, tenatoprazole. These structures are shown in Figure 11, illustrating the common core structure and the difference of tenatoprazole.
FIGURE 11.
The core structure of the PPIs, timoprazole, followed by the 4 currently marketed PPIs and tenatoprazole with its imidazopyridine moiety substituting for the benzimidazole in the other PPIs.
It was recognized in 1978, that timoprazole and another derivative, picoprazole, had a highly specialized mechanism of action on the proton pump. The first set of experiments investigated the possibility that the H,K ATPase was their target of action since they inhibited acid secretion independent of stimulus, whether extracellular such as histamine, gastrin or carbachol, or intracellular-like dibutyryl cAMP. These experiments were carried on nonacid transporting hog gastric ATPase and showed no inhibition. However, because it was disclosed that the compounds were acid labile, the next set of experiments were carried out under acid transport conditions on ion-tight vesicles. It was then found that these 2 compounds did in fact inhibit the ATPase. The critical experiment was performed using the uptake of acridine orange, a weak base that quenches fluorescence upon accumulation in the acidic space of the transporting vesicles. The result of these studies is shown in Figure 12. The control experiment shows a rapid quench of acridine orange fluorescence owing to its accumulation upon the addition of ATP. When ATP was added in the presence of the compound, the initial fluorescence quench was identical to the control experiment but then, after about 100 seconds, the fluorescence quench stopped and returned to pre-ATP levels after about 100 seconds. We interpreted these results to indicate that the compounds, being weak bases accumulate in the acidic space inside the vesicles which all have the pump oriented so that protons are pumped into the vesicular space. This accumulation is very rapid and cannot account for the delay in inhibition of the enzyme. The lag phase was interpreted, as being due to acid activation of the accumulated drug.4 Hence PPIs are acid activated prodrugs! Their chemistry is quite remarkable and unique for any approved class of drugs.
FIGURE 12.
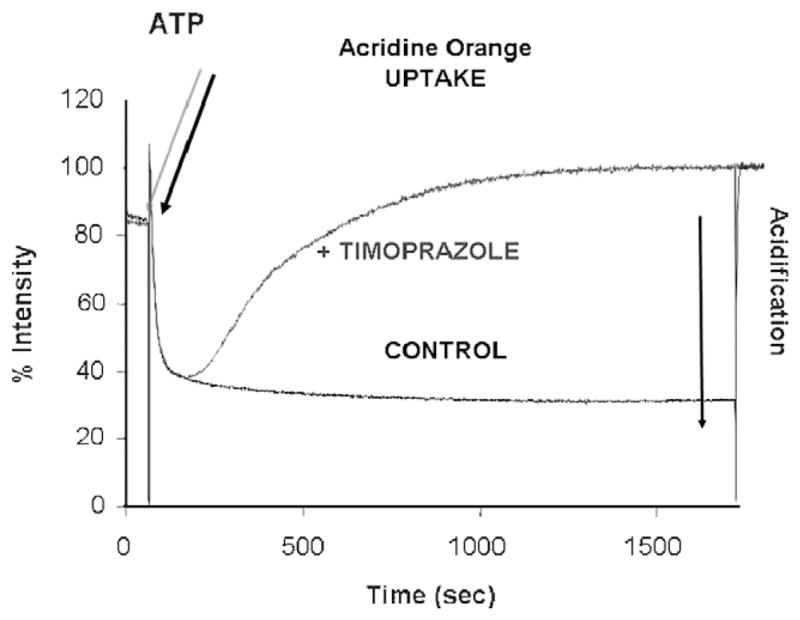
The experiment showing that the PPI core structure is an acid activated prodrug. In black is shown the acidification inside ion-tight gastric vesicles upon the addition of Mg ATP in the presence of KCl and valinomycin with a maintained proton gradient for at least 1500 seconds. In the presence of timoprazole, the addition of Mg.ATP (blue arrow) resulted in the same rate of acid transport and hence acridine orange for only about 100 seconds and then the fluorescence quench reversed, showing inhibition of acid transport (blue line). The lag phase for inhibition is due to the requirement of acid activation of these benzimidazoles, converting them from their inactive prodrug form to the active drug that inhibits the ATPase.
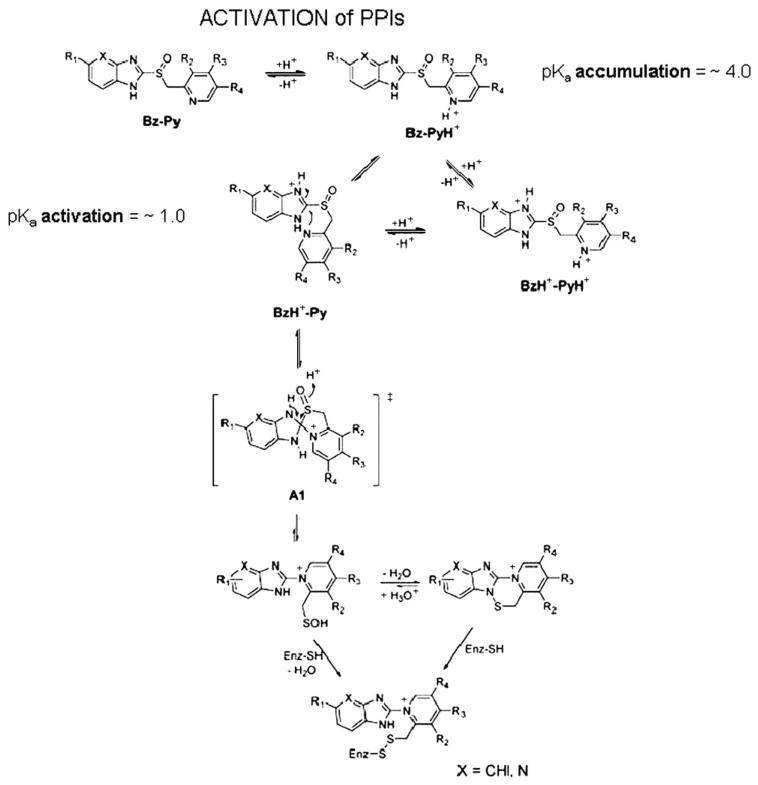
The acid activation was shown to be due to the formation of a tetracyclic compound that could be crystallized as the sulfenamide derivative of omeprazole.37 This would involve the rearrangement of the PPI to form a permanent action with the N of the pyridine now linked directly to the 2C of the benzimidazole (please see below). The protonation of the pyridine moiety was accepted for many years as the protonation reaction that initiated activation of the PPIs,37–39 but the experiments on this were performed initially at acidic pH and with high cysteine concentrations present and omeprazole was the only PPI on which these experiments were performed. With the introduction of other PPIs with generally similar pyridine pKas, different rates of activation were found which cannot be explained as being due to the pyridine. However, the substitutions on the benzimidazole or the introduction of the imidazopyridine in tenatoprazole indicated that it was the lower pKa of the nitrogen on this moiety of the PPI that determined the rate of acid activation of the PPIs. This was then confirmed by UV spectroscopic measurements of absorbance changes as a function of medium pH, which then led to a novel mechanism of activation. This activation pathway is illustrated in Figure 13 and is applicable to all the PPIs.40
FIGURE 13.
The pathway for activation of the PPIs to result in inhibition of the H,K ATPase. The top line shows the pyridine protonation that is responsible for accumulation of the PPIs in the acid space of the stimulated parietal cell with a pH<4.0. This protonation is followed by protonation of the benzimidazole or imidazopyridine moiety with a pKa~1.0 and this happens as shown on the left second row. The protonation of this moiety results in activation of the 2C position and the formation of a spiro intermediate as shown in the brackets. This rearranges to form the sulfenic acid, which is a highly thiophilic reagent. It can dehydrate to form the sulfenamide on the right or react directly with cysteines accessible from the luminal (acidic) surface of the pump to form covalent disulfides with cysteines accessible from the lumen. The sulfenamide is also thiophilic and can also bind covalently to the enzyme.
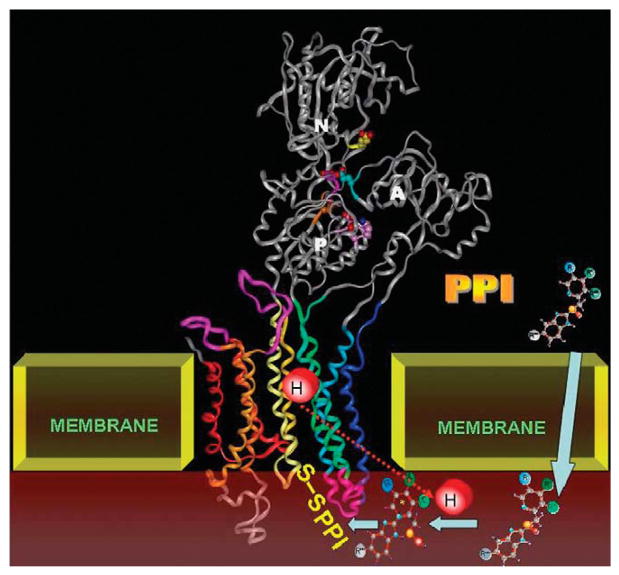
The PPI is thus activated in the lumen of the secretory canaliculus of the active parietal cell or directly on the surface of the pump while it is transporting protons and then binds to one or more cysteines that are accessible to this large thiophilic cation from the luminal surface. A diagram showing the structure of the pump and the movement of the PPI from parietal cell cytoplasm to the acid space, activation and formation of a disulfide bond is shown in Figure 14. All PPIs have to be given with acid protective coating to prevent conversion to the active principle in the lumen of the stomach, which then will react with any available sulfyhdryl group in food and will not penetrate to the lumen of the secretory canaliculus.
FIGURE 14.
A model showing the E2 structure of the pump to which the PPIs bind. During acid transport, the PPI becomes concentrated (arrows) in the secretory canaliculus (brown) and is then activated before binding to cysteines of the pump that are accessible from the lumen. Once bound to these the PPI forms a stable disulfide bond. There is some variation in stability, binding to cysteine 813 in the luminal vestibule of the pump can be reversed by the addition of glutathione, whereas binding to cysteine 822 cannot be reversed by this agent.41,42
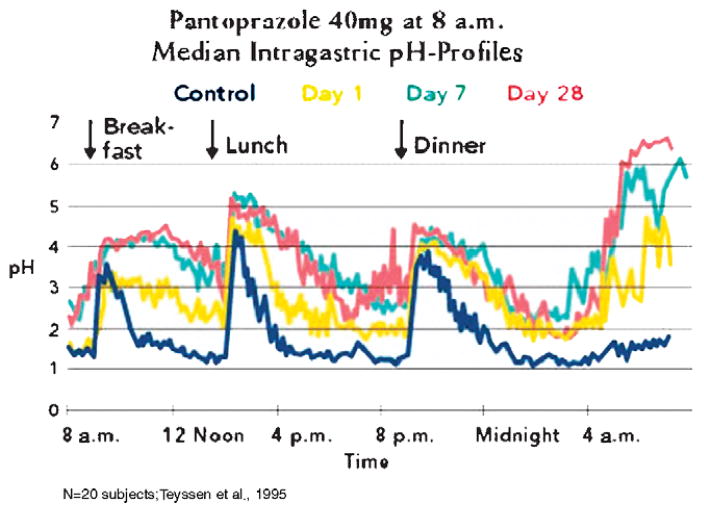
The PPIs currently on the market have a relatively short half-life of 60 to 90 minutes. However, the duration of inhibition is much longer owing to the covalent binding to the pump. Hence, these drugs provide a good profile of acid control as shown in Figure 15. The effect of the PPIs increases with day of dosage and should be given 30 minutes before meals. In the case of once a day dosing before breakfast, on the first day the residence time of the drug only is able to inhibit the pumps that are active during that time. Not all pumps are active. On the second day, most of these active pumps remain inhibited but then some of the pumps that are activated on the second day and pumps that are synthesized and pumps where inhibition has been reversed by glutathione reduction of the inhibitor disulfide bonds are again inhibited by the PPI. Thus inhibition improves on the second day. Generally by the third day, a steady state occurs where the fraction of pumps that remains inhibited over 2 hours reaches about 70% of the pump population. In contrast to histamine-2 receptor antagonists, there is no tolerance. However, as can be seen by the pH profile, elevation of intragastric pH is more effective during the day than at night. Even giving a second dose of a PPI with the evening meal does not prevent nocturnal acid secretion, because the pumps that are activated after the drug has disappeared are able to generate high acidity albeit at low volume. The median daytime pH achieved is between pH 3 and 4.0 and nighttime is between pH 2.0 and 2.5. Remembering that pH is logarithmic, there is a 90% reduction in acidity at night but if refluxed into the esophagus at sufficient volume will result in nighttime GERD. Nevertheless, the pH profile achieved by PPIs is superior to that found with histamine-2 receptor antagonists and therefore has resulted in these drugs being the preferred mode of treatment for this disease state. They are effective in healing esophageal erosions after 8 weeks of treatment but less effective in symptom relief because the degree of acid inhibition is sufficient to allow regeneration of the esophageal epithelium but the acidity is still able to trigger the afferent nerves in the esophageal epithelium which may have a threshold of about pH 5.0.
FIGURE 15.
A typical pH profile of PPI treatment, in this case with pantoprazole, once a day before breakfast. It can be seen in the yellow curve that there is already significant inhibition on the first day, but there is improvement in acid control by day 7 (blue) that is maintained until day 28 (red).
Although PPIs have been very successful and effective, there are drawbacks such as less than complete acid suppression, high acidity at night and requirement for mealtime dosing to ensure adequate levels of the drug during periods of pump activity. In principle, therefore, the performance of a PPI would be improved if the residence time of the drug could be prolonged to about 6 hours during which time most of the pumps would be activated. If such drugs were available, we could anticipate complete symptom relief and hence improved the rate of healing of esophageal erosions, effective treatment of nonerosive reflux disease (heartburn without esophageal erosion), efficacy of bedtime dosing, and meal independent effect.
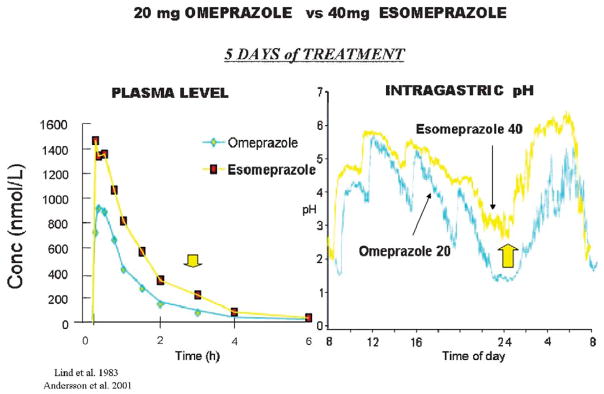
One approach that has been taken to this was the introduction of the S-enantiomer of omeprazole, which has a slower metabolism than the racemate comprising omeprazole. There seems to be some improvement in acid control by this esomeprazole as shown in Figure 16, both in terms of PK and intragastric pH.
FIGURE 16.
A comparison of once a day dosing between 20mg of omeprazole and 40mg of esomeprazole. The improved PK profile is shown on the left with an increase in the residence time in the blood (arrow). On the right is shown the improvement in the intragastric pH profile and the arrow shows the improvement in nighttime intragastric pH. The differences observed here required a large number of patients to show improvement in clinical outcome.
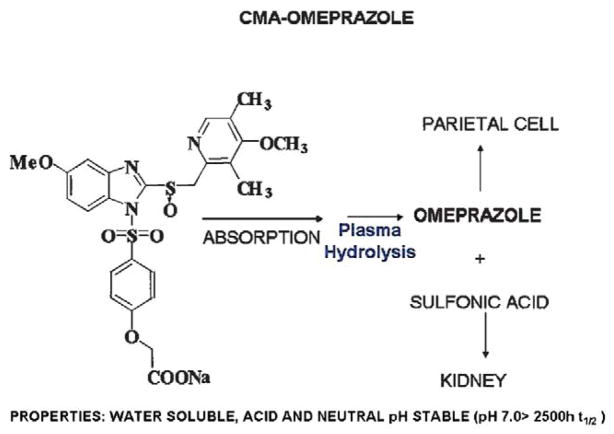
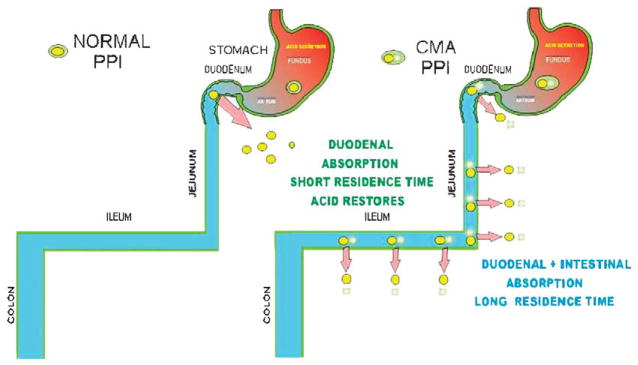
More recently, a new chemical entity was designed intended to deliver any PPI in a chemically metered absorption way. The principle was to generate a derivative that would be absorbed along the length of the small intestine and converted to the PPI immediately upon absorption. This would then contrast with the rapid absorption of the parent PPI in the duodenum. The chemical basis is shown in Figure 17. This chemically metered absorption (CMA)-omeprazole has the desired prolongation of residence time in the blood and provides superior pH control as compared with esomeprazole. It has the additional advantage of having a very long half-life in solution at neutral pH in contrast to omeprazole so would be much more convenient for IV use. The principle behind the improvement of pH control by this CMA-PPI is shown in Figure 18. It remains to be seen whether this class of drug undergoes development and fulfils its promise derived from intragastric pH measurements.
FIGURE 17.
The structure of the CMA-omeprazole, AGN 904, that has undergone phase I development and has been tested in human volunteers showing a superior pH profile.43
FIGURE 18.
On the left is shown the usual absorption of omeprazole in the duodenum where with the short half-life and absence of drug, acid secretion can return. On the right, the absorption of CMA-omeprazole or any other CMA-PPI occurs along the length of the small intestine. The continuous intestinal absorption provides increased availability of the agent and results in prolonged exposure of the parietal cells to omeprazole with subsequent considerable improvement of pH control, particularly at night in comparison with omeprazole.44
APAs
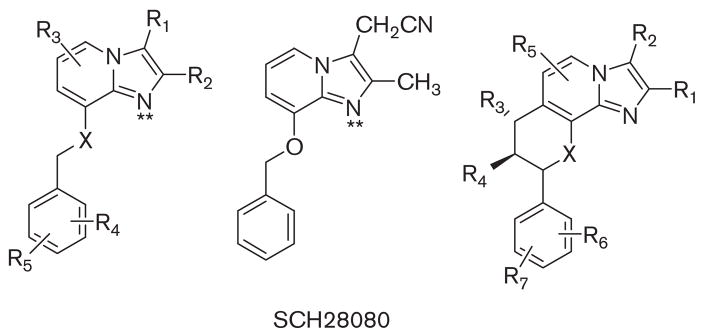
Although PPIs are effective drugs, clearly there was room for improvement in the speed of onset of acid suppression, Also, a mode of action that is independent of an acidic environment and better inhibition of the pump seemed desirable. In 1983, it was recognized that protonatable amines acted as K competitive inhibitors of the ATPase.45 An imidazo[1,2α] pyridine was being developed as a homolog of omeprazole but its side effects prevented further development. Exploration of this protonatable amine showed that it was indeed a K+ competitive inhibitor of the H,K ATPase.46 This initiated studies of a series of derivatives of SCH28080 as potential drugs for rapid and more complete control of cid secretion. Some of these are still in development but the high affinity of SCH28080 (Ki~50nM) and its K+ competitive property made it an excellent compound with which to derive information on the binding site of these APAs and their path of entry to the binding domain (Fig. 19).
FIGURE 19.
The structure of SCH28080, the forerunner of most of the APAs that are being developed in the center and on the left a series of analogs that have been tried in vivo and on the right the core structure of the fused ring compounds generated to mimic the active conformation of SCH28080 with the phenyl ring orthogonal to the imidazopyridine.
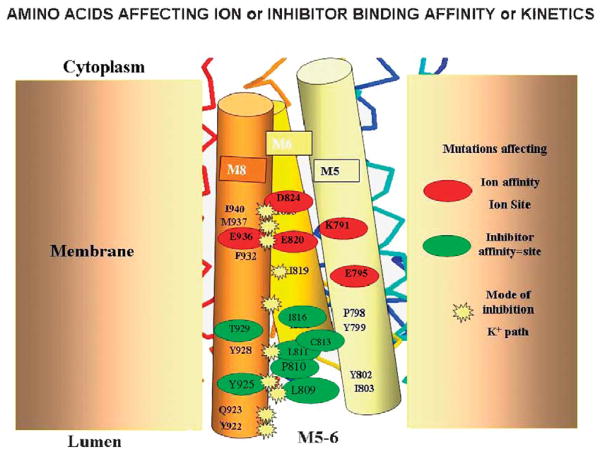
Early experiments before any knowledge of the 3-dimensional structure of the sr Ca ATPase and homology modeling used a radiolabeled photoaffinity derivative of SCH28080 where an azido group was placed on the para position of the phenyl ring and tritium was introduced by CT3I treatment derivatizing the pyridine N to make a cation that still showed good competitive inhibition and affinity for the pump. Labeling the pump with this compound (Me-DAZIP+) and tryptic digestion showed that the label was associated with TM1 and TM2. However, the phenyl tail is not the business end of the molecule and substitutions in the imidazo portion generally produced inactive compounds. With the ability to generate homology models and to express the H,K ATPase in HEK293 cells, a new era opened in analysis of the pump structure revealed by effects of site directed mutagenesis of the pump on 3 aspects of their activity, namely their affinity and the nature of their inhibition, whether still strictly K+ competitive or mixed or even noncompetitive. Figure 20 summarizes the results of many of the mutations and their effects superimposed on a model of the pump.
FIGURE 20.
A model of the location of amino acids whose mutation altered affinity (red oval), SCH28080 affinity (green oval), or changed inhibition from being purely competitive to either mixed or noncompetitive. The red ovals delineate the amino acids in the ion binding domain, the green ovals delineate amino acids whose mutation decrease APA inhibitor affinity, and the yellow stars delineate those amino acids whose mutation changes inhibition from purely competitive to either mixed or noncompetitive. These amino acids affect the ability of K+ to enter the ion binding site in the presence of SCH28080 hence changing competitive inhibition. The background stick molecule represents a scaled down version of the pump elements.
Notably mutations of the carboxylic acids in the TM4, 5, and 8 domains resulted in changes of counterion affinity as would be expected from the homology models discussed above. A series of mutations in amino acids located at the extracellular end of TM6, the loop between TM5 and TM6 and the luminal end of TM8 decreased inhibitor affinity, whereas a series of mutations at the interface between TM6 and TM8 altered inhibition from being purely competitive to either mixed or noncompetitive, showing that the counterion could access the ion binding domain even in the presence of the inhibitor.
These data allowed construction of the inhibitor binding region on our model of the H,K ATPase. The first issue was to generate a structure with sufficient space to allow inhibitor entry, that is, a water channel. This was aided by the knowledge of the omeprazole binding site at cysteine 813 and that omeprazole binding and SCH28080 inhibitions were mutually exclusive,47 thus allowing a general location of the pathway for SCH28080. This hydrated entry is shown in Figure 21, where there is now room for rapid entry and exit of the K competitive inhibitors between TM4 and TM5 the TM5/TM6 loop and TM6.
FIGURE 21.
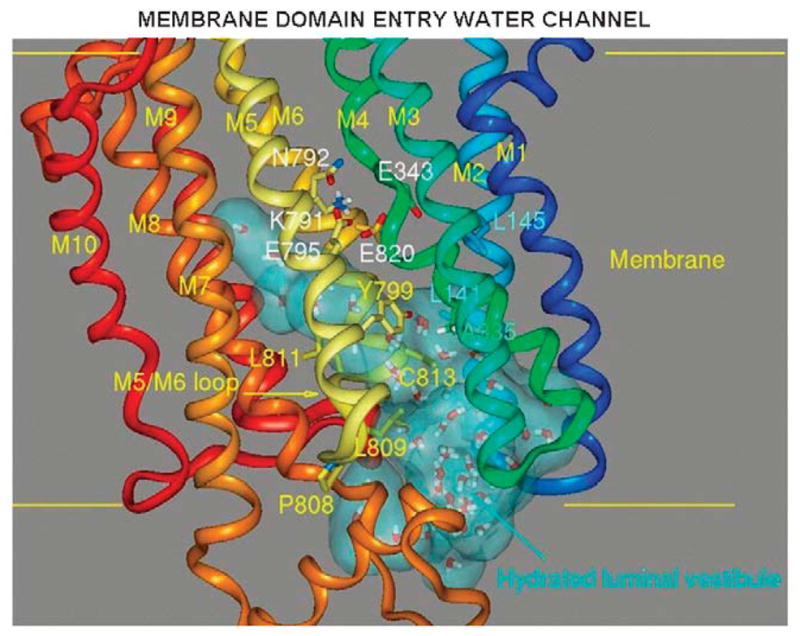
The entry path for SCH28080 generated by using the SOAK algorithm in the E2 configuration of the H,K ATPase model generated from the binding sites of ATPase inhibitors shown as a light blue cloud showing the presence of water of hydration. The path reaches all the way up to the H2 ion binding site of Figure 7.
This then allowed us to model the entry of SCH28080 into its binding site and using the mutant data, place the compound in a specific region of the ATPase. This sequence is shown in Figure 22. Here, the inhibitor enters at the mouth of the water channel and here we have placed a mutated site, where valine 331 is replaced by phenylalanine that has no effect on the properties of the ATPase or inhibition but allows us to expand the entry space. This is followed by movement up the channel and docking in the vestibule formed by amino acids of TM4, TM5, the loop between TM5 and TM6. This structure overlaps the cysteine 813 bound by omeprazole and is close to glutamyl 795, 1 of the carboxylic acids that are part of the K+ binding site. The phenyl ring is in proximity to its known binding site in TM1/TM2.
FIGURE 22.
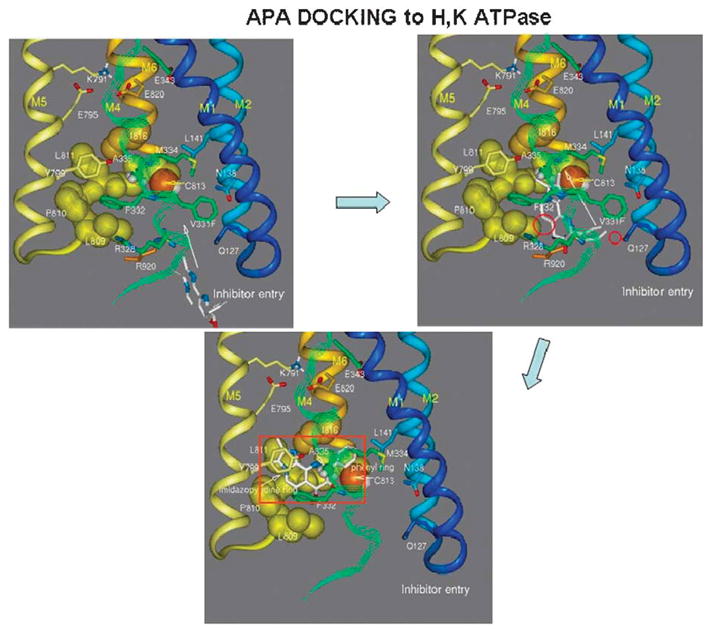
A model of the entry of SCH28080 into the luminal domain of the H,K ATPase on the top left, the path taken in the upper right image and the final binding site is show in the bottom image. In this model, valine 331 is substituted by phenylalanine to allow generation of sufficient space to allow inhibitor entry and exit via the water channel shown in Figure 21.
This model then was applied to the docking of an APA currently in clinical trial, soraprazan, which is a modification of SCH28080 with a fused ring structure to force the conformation known to be the active conformer of SCH28080 where the phenyl ring is orthogonal to the imidazopyridine (Fig. 23).48–50
FIGURE 23.
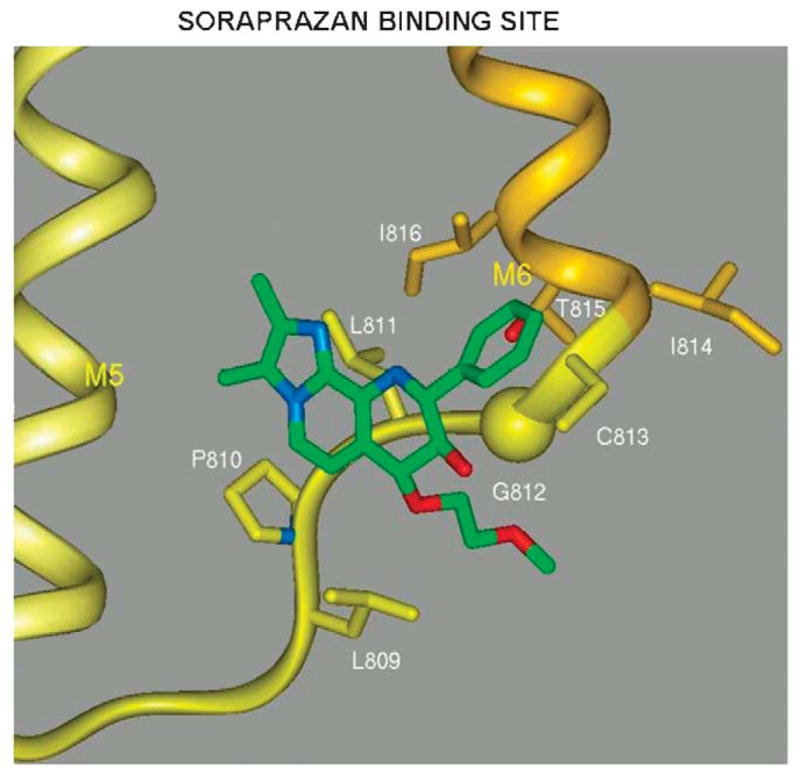
A model of the docking of soraprazan to the region of the H,K ATPase that can also be occupied by SCH28080 as shown in Figure 22. Nonessential elements have been omitted for clarity.
CONCLUSIONS AND FUTURE DIRECTIONS
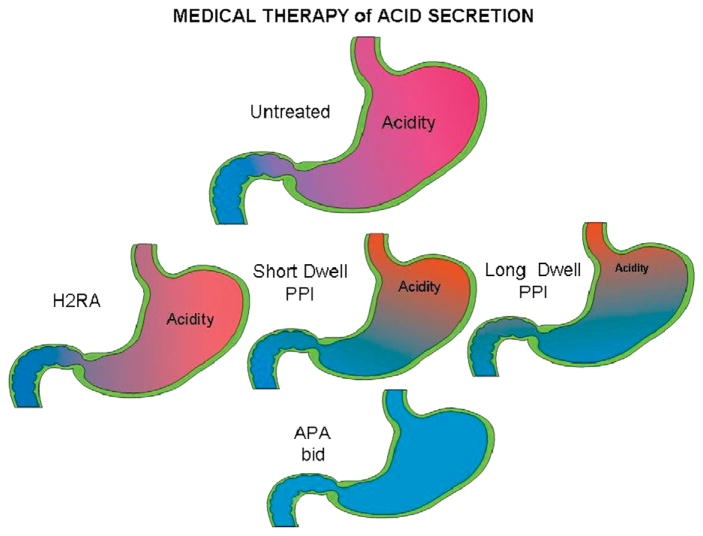
We have come a long way from the total gastrectomy necessary at the end of the 19th century as pioneered by Billroth, to the highly selective vagotomy of the middle of the 20th century. Also, development of PPIs which directly target the gastric acid pump was an advance over H2 receptor antagonists. One possibility is the development of more effective PPIs including the novel chemical mediated absorption chemicals that increase the residence time of the PPIs in the blood as shown in Figure 18. Development of other PPIs with a longer half-life is also possible such as tenatoprazole.41 The introduction of a clinically safe APA, which can suppress acid secretion rapidly and that does not require activation of the pumps for their action should facilitate complete inhibition of acid secretion on the first day of therapy. Figure 24 schematically maps the progress made in the development of methods to suppress acid secretion and improve the treatment of both PUD and GERD. Given the importance of GERD and its possible consequences, other novel methods of treatment of this disorder besides acid suppression may be developed in the future, such as compounds to regulate expression levels of the ATPase or its mechanism of activation.
FIGURE 24.
A cartoon showing the progression of improvement in acid control, for the untreated stomach (top) and increasing acid control from left to right with H2 receptor antagonists, PPIs, long dwell time PPIs, and the anticipated effect of BID APAs or a CMA-PPI as an ideal goal.
Acknowledgments
Supported by USVA and NIH grant nos DK46917, DK58333, DK53462, DK41301.
The authors thank Drs Irvin Modlin and Jeffery Kraut for careful reading of the manuscript.
References
- 1.Marshall BJ, Warren JR. Unidentified curved bacilli in the stomach of patients with gastritis and peptic ulceration. Lancet. 1984;1:1311–1315. doi: 10.1016/s0140-6736(84)91816-6. [DOI] [PubMed] [Google Scholar]
- 2.Sachs G, Shin JM, Munson K, et al. Review article: the control of gastric acid and Helicobacter pylori eradication. Aliment Pharmacol Ther. 2000;14:1383–1401. doi: 10.1046/j.1365-2036.2000.00837.x. [DOI] [PubMed] [Google Scholar]
- 3.Black JW, Duncan WAM, Durant CJ, et al. Definition and antagonism of histamine H2 receptors. Nature. 1972;236:385–390. doi: 10.1038/236385a0. [DOI] [PubMed] [Google Scholar]
- 4.Fellenius E, Berglindh T, Sachs G, et al. Substituted benzimidazoles inhibit gastric acid secretion by blocking (H+ + K+)ATPase. Nature. 1981;290:159–161. doi: 10.1038/290159a0. [DOI] [PubMed] [Google Scholar]
- 5.Toyoshima C, Asahi M, Sugita Y, et al. Modeling of the inhibitory interaction of phospholamban with the Ca2+ ATPase. Proc Natl Acad Sci USA. 2003;100:467–472. doi: 10.1073/pnas.0237326100. [DOI] [PMC free article] [PubMed] [Google Scholar]
- 6.Toyoshima C, Nakasako M, Nomura H, et al. Crystal structure of the calcium pump of sarcoplasmic reticulum at 2.6 A resolution. Nature. 2000;405:647–655. doi: 10.1038/35015017. [DOI] [PubMed] [Google Scholar]
- 7.Toyoshima C, Nomura H. Structural changes in the calcium pump accompanying the dissociation of calcium. Nature. 2002;418:605–611. doi: 10.1038/nature00944. [DOI] [PubMed] [Google Scholar]
- 8.Sachs G, Chang HH, Rabon E, et al. A nonelectrogenic H+ pump in plasma membranes of hog stomach. J Biol Chem. 1976;251:7690–7698. [PubMed] [Google Scholar]
- 9.Wolosin JM, Forte JG. Stimulation of oxyntic cell triggers K+ and Cl− conductances in apical H+-K+-ATPase membrane. Am J Physiol. 1984;246:C537–C545. doi: 10.1152/ajpcell.1984.246.5.C537. [DOI] [PubMed] [Google Scholar]
- 10.Forte JG, Forte TM, Black JA, et al. Correlation of parietal cell structure and function. J Clin Gastroenterol. 1983;5(suppl 1):17–27. doi: 10.1097/00004836-198312001-00003. [DOI] [PubMed] [Google Scholar]
- 11.Sawaguchi A, Aoyama F, Ide S, et al. The cryofixation of isolated rat gastric mucosa provides new insights into the functional transformation of gastric parietal cells: an in vitro experimental model study. Arch Histol Cytol. 2005;68:151–160. doi: 10.1679/aohc.68.151. [DOI] [PubMed] [Google Scholar]
- 12.Pettitt JM, Humphris DC, Barrett SP, et al. Fast freeze-fixation/freeze-substitution reveals the secretory membranes of the gastric parietal cell as a network of helically coiled tubule. A new model for parietal cell transformation. J Cell Sci. 1995;108(Pt 3):1127–1141. doi: 10.1242/jcs.108.3.1127. [DOI] [PubMed] [Google Scholar]
- 13.Ogata T, Yamasaki Y. Scanning EM of resting gastric parietal cells reveals a network of cytoplasmic tubules and cisternae connected to the intracellular canaliculus. Anat Rec. 2000;258:15–24. doi: 10.1002/(SICI)1097-0185(20000101)258:1<15::AID-AR2>3.0.CO;2-I. [DOI] [PubMed] [Google Scholar]
- 14.McMahon HT, Sudhof TC. Synaptic core complex of synaptobrevin, syntaxin, and SNAP25 forms high affinity alpha-SNAP binding site. J Biol Chem. 1995;270:2213–2217. doi: 10.1074/jbc.270.5.2213. [DOI] [PubMed] [Google Scholar]
- 15.Whiteheart SW, Gri IC, Brunner M, et al. SNAP family of NSF attachment proteins includes a brain-specific isoform. Nature. 1993;362:353–355. doi: 10.1038/362353a0. [DOI] [PubMed] [Google Scholar]
- 16.Lambrecht NW, Yakubov I, Zer C, et al. Transcriptomes of purified gastric ECL and parietal cells: identification of a novel pathway regulating acid secretion. Physiol Genomics. 2006;25:153–165. doi: 10.1152/physiolgenomics.00271.2005. [DOI] [PubMed] [Google Scholar]
- 17.Lambrecht NW, Yakubov I, Scott D, et al. Identification of the K efflux channel coupled to the gastric H-K-ATPase during acid secretion. Physiol Genomics. 2005;21:81–91. doi: 10.1152/physiolgenomics.00212.2004. [DOI] [PubMed] [Google Scholar]
- 18.Fujita A, Horio Y, Higashi K, et al. Specific localization of an inwardly rectifying K(+) channel, Kir4.1, at the apical membrane of rat gastric parietal cells; its possible involvement in K(+) recycling for the H(+)-K(+)-pump. J Physiol. 2002;540:85–92. doi: 10.1113/jphysiol.2001.013439. [DOI] [PMC free article] [PubMed] [Google Scholar]
- 19.Grahammer F, Herling AW, Lang HJ, et al. The cardiac K+ channel KCNQ1 is essential for gastric acid secretion. Gastroenterology. 2001;120:1363–1371. doi: 10.1053/gast.2001.24053. [DOI] [PubMed] [Google Scholar]
- 20.Malinowska DH, Sherry AM, Tewari KP, et al. Gastric parietal cell secretory membrane contains PKA− and acid-activated Kir2.1 K+ channels. Am J Physiol Cell Physiol. 2004;286:C495–C506. doi: 10.1152/ajpcell.00386.2003. [DOI] [PubMed] [Google Scholar]
- 21.Nakamura N, Suzuki Y, Sakuta H, et al. Inwardly rectifying K+ channel Kir7.1 is highly expressed in thyroid follicular cells, intestinal epithelial cells and choroid plexus epithelial cells: implication for a functional coupling with Na+,K+-ATPase. Biochem J. 1999;342(Pt 2):329–336. [PMC free article] [PubMed] [Google Scholar]
- 22.Heitzmann D, Grahammer F, von Hahn T, et al. Heteromeric KCNE2/KCNQ1 potassium channels in the luminal membrane of gastric parietal cells. J Physiol. 2004;561:547–557. doi: 10.1113/jphysiol.2004.075168. [DOI] [PMC free article] [PubMed] [Google Scholar]
- 23.Mizukawa Y, Nishizawa T, Nagao T, et al. Cellular distribution of parchorin, a chloride intracellular channel-related protein, in various tissues. Am J Physiol Cell Physiol. 2002;282:C786–C795. doi: 10.1152/ajpcell.00239.2001. [DOI] [PubMed] [Google Scholar]
- 24.Roepke TK, Anantharam A, Kirchho P, et al. The KCNE2 potassium channel ancillary subunit is essential for gastric acid secretion. J Biol Chem. 2006;281:23740–23747. doi: 10.1074/jbc.M604155200. [DOI] [PubMed] [Google Scholar]
- 25.Vallon V, Grahammer F, Volkl H, et al. KCNQ1-dependent transport in renal and gastrointestinal epithelia. Proc Natl Acad Sci USA. 2005;102:17864–17869. doi: 10.1073/pnas.0505860102. [DOI] [PMC free article] [PubMed] [Google Scholar]
- 26.Post RL, Hegyvary C, Kume S. Activation by adenosine triphosphate in the phosphorylation kinetics of sodium and potassium ion transport adenosine triphosphatase. J Biol Chem. 1972;247:6530–6540. [PubMed] [Google Scholar]
- 27.Wallmark B, Stewart HB, Rabon E, et al. The catalytic cycle of gastric (H+ + K+)-ATPase. J Biol Chem. 1980;255:5313–5319. [PubMed] [Google Scholar]
- 28.Stewart B, Wallmark B, Sachs G. The interaction of H+ and K+ with the partial reactions of gastric (H+ + K+)-ATPase. J Biol Chem. 1981;256:2682–2690. [PubMed] [Google Scholar]
- 29.Rabon E, Sachs G, Bassilian S, et al. A K(+)-competitive fluorescent inhibitor of the H,K-ATPase. J Biol Chem. 1991;266:12395–12401. [PubMed] [Google Scholar]
- 30.Blostein R, Dunbar L, Mense M, et al. Cation selectivity of gastric H,K-ATPase and Na,K-ATPase chimeras. J Biol Chem. 1999;274:18374–18381. doi: 10.1074/jbc.274.26.18374. [DOI] [PubMed] [Google Scholar]
- 31.Shin JM, Sachs G. Dimerization of the gastric H+, K(+)-ATPase. J Biol Chem. 1996;271:1904–1908. doi: 10.1074/jbc.271.4.1904. [DOI] [PubMed] [Google Scholar]
- 32.Geering K. The functional role of beta subunits in oligomeric P-type ATPases. J Bioenerg Biomembr. 2001;33:425–438. doi: 10.1023/a:1010623724749. [DOI] [PubMed] [Google Scholar]
- 33.Munson K, Garcia R, Sachs G. Inhibitor and ion binding sites on the gastric H,K-ATPase. Biochemistry. 2005;44:5267–5284. doi: 10.1021/bi047761p. [DOI] [PubMed] [Google Scholar]
- 34.Munson K, Vagin O, Sachs G, et al. Molecular modeling of SCH28080 binding to the gastric H,K-ATPase and MgATP interactions with SERCA- and Na,K-ATPases. Ann N Y Acad Sci. 2003;986:106–110. doi: 10.1111/j.1749-6632.2003.tb07146.x. [DOI] [PubMed] [Google Scholar]
- 35.Burnay M, Crambert G, Kharoubi-Hess S, et al. Electrogenicity of Na,K- and H,K-ATPase activity and presence of a positively charged amino acid in the fifth transmembrane segment. J Biol Chem. 2003;278:19237–19244. doi: 10.1074/jbc.M300946200. [DOI] [PubMed] [Google Scholar]
- 36.Rabon EC, Bassilian S, Sachs G, et al. Conformational transitions of the H,K-ATPase studied with sodium ions as surrogates for protons. J Biol Chem. 1990;265:19594–19599. [PubMed] [Google Scholar]
- 37.Lindberg P, Nordberg P, Alminger T, et al. The mechanism of action of the gastric acid secretion inhibitor omeprazole. J Med Chem. 1986;29:1327–1329. doi: 10.1021/jm00158a001. [DOI] [PubMed] [Google Scholar]
- 38.Brandstrom A, Bergman N-A, Lindberg P, et al. Chemical reaction of omeprazole and omeprazole analogues. II. Kinetics of the reaction of omeprazole in the presence of 2-mercaptoethanol. Acta Chemica Scand. 1989;43:549–568. [Google Scholar]
- 39.Brandstrom A, Lindberg P, Bergman N-A, et al. Chemical reactions of omeprazole and omeprazole analogues. I. A survey of the chemical transformations of omeprazole and its analogues. Acta Chemica Scand. 1989;43:536–548. [Google Scholar]
- 40.Shin JM, Cho YM, Sachs G. Chemistry of covalent inhibition of the gastric (H+, K+)-ATPase by proton pump inhibitors. J Am Chem Soc. 2004;126:7800–7811. doi: 10.1021/ja049607w. [DOI] [PubMed] [Google Scholar]
- 41.Shin JM, Homerin M, Domagala F, et al. Characterization of the inhibitory activity of tenatoprazole on the gastric H+, K+-ATPase in vitro and in vivo. Biochem Pharmacol. 2006;71:837–849. doi: 10.1016/j.bcp.2005.11.030. [DOI] [PubMed] [Google Scholar]
- 42.Shin JM, Sachs G. Differences in binding properties of two proton pump inhibitors on the gastric H+,K+-ATPase in vivo. Biochem Pharmacol. 2004;68:2117–2127. doi: 10.1016/j.bcp.2004.07.035. [DOI] [PubMed] [Google Scholar]
- 43.Hunt RH, Armstrong D, Yaghoobi M, et al. AGN 201904-Z (AGN), a novel enteric-coated PPI, produces greater, more prolonged acid supression than esomeprazole (ESO) in male healthy volunteers. Am J Gastroenterol. 2006;101(suppl):S92. [Google Scholar]
- 44.Hunt RH, Armstrong D, James C, et al. Effect on intragastric pH of a PPI with a prolonged plasma half-life: comparison between tenatoprazole and esomeprazole on the duration of acid suppression in healthy male volunteers. Am J Gastroenterol. 2005;100:1949–1956. doi: 10.1111/j.1572-0241.2005.41956.x. [DOI] [PubMed] [Google Scholar]
- 45.Im WB, Blakeman DP, Mendlein J, et al. Inhibition of (H+ + K+)-ATPase and H+ accumulation in hog gastric membranes by trifluoperazine, verapamil and 8-(N,N-diethylamino)octyl- 3,4,5- trimethoxybenzoate. Biochim Biophys Acta. 1984;770:65–72. doi: 10.1016/0005-2736(84)90074-9. [DOI] [PubMed] [Google Scholar]
- 46.Wallmark B, Briving C, Fryklund J, et al. Inhibition of gastric H+,K+-ATPase and acid secretion by SCH 28080, a substituted pyridyl(1,2a)imidazole. J Biol Chem. 1987;262:2077–2084. [PubMed] [Google Scholar]
- 47.Hersey SJ, Steiner L, Mendlein J, et al. SCH28080 prevents omeprazole inhibition of the gastric H+/K+-ATPase. Biochim Biophys Acta. 1988;956:49–57. doi: 10.1016/0167-4838(88)90296-8. [DOI] [PubMed] [Google Scholar]
- 48.Kaminski JJ, Doweyko AM. Antiulcer agents. 6. Analysis of the in vitro biochemical and in vivo gastric antisecretory activity of substituted imidazo[1,2-a]pyridines and related analogues using comparative molecular field analysis and hypothetical active site lattice methodologies. J Med Chem. 1997;40:427–436. doi: 10.1021/jm950700s. [DOI] [PubMed] [Google Scholar]
- 49.Kaminski JJ, Puchalski C, Solomon DM, et al. Antiulcer agents. 4. Conformational considerations and the antiulcer activity of substituted imidazo[1,2-a]pyridines and related analogues. J Med Chem. 1989;32:1686–1700. doi: 10.1021/jm00128a005. [DOI] [PubMed] [Google Scholar]
- 50.Kaminski JJ, Wallmark B, Briving C, et al. Antiulcer agents. 5. Inhibition of gastric H+/K(+)-ATPase by substituted imidazo[1,2-a]pyridines and related analogues and its implication in modeling the high affinity potassium ion binding site of the gastric proton pump enzyme. J Med Chem. 1991;34:533–541. doi: 10.1021/jm00106a008. [DOI] [PubMed] [Google Scholar]


