Abstract
Electrochemical aptamer-based (E-AB) sensors have emerged as a promising and versatile new biosensor platform. Combining the generality and specificity of aptamer–ligand interactions with the selectivity and convenience of electrochemical readouts, this approach affords the detection of a wide variety of targets directly in complex, contaminant-ridden samples, such as whole blood, foodstuffs and crude soil extracts, without the need for exogenous reagents or washing steps. Signaling in this class of sensors is predicated on target-induced changes in the conformation of an electrode-bound probe aptamer that, in turn, changes the efficiency with which a covalently attached redox tag exchanges electrons with the interrogating electrode. Aptamer selection strategies, however, typically do not select for the conformation-switching architectures, and as such several approaches have been reported to date by which aptamers can be re-engineered such that they undergo the binding-induced switching required to support efficient E-AB signaling. Here, we systematically compare the merits of these re-engineering approaches using representative aptamers specific to the small molecule adenosine triphosphate and the protein human immunoglobulin E. We find that, while many aptamer architectures support E-AB signaling, the observed signal gain (relative change in signal upon target binding) varies by more than two orders of magnitude across the various constructs we have investigated (e.g., ranging from −10% to 200% for our ATP sensors). Optimization of the switching architecture is thus an important element in achieving maximum E-AB signal gain and we find that this optimal geometry is specific to the aptamer sequence upon which the sensor is built.
Introduction
Recent years have seen the emergence of a large number of reagentless, electrochemical sensors based on the binding-induced “folding” of aptamers;1 DNA or RNA sequences selected in vitro to bind specific molecular targets.2 These electrochemical, aptamer-based (E-AB) sensors are versatile, with examples reported to date against a range of protein,3–9 small molecule,3–9 and inorganic ion10,11 targets. They are also quite convenient. For example, because all of the components in an E-AB sensor are physically attached to the electrode, the platform is self-reporting, reagentless, and readily reusable. Moreover, given the specificity of aptamer-based recognition, and the relative paucity of electroactive contaminants in even the most complex clinical or environmental samples, E-AB sensors are readily employed in blood and blood serum,5,12 saliva,3 foodstuffs,3 cellular extracts,9 and other highly complex sample matrices. These attributes render E-AB sensors a potentially promising platform for, for example, point-of-care and developing-world applications.13
E-AB sensors comprise a redox-tagged aptamer that is bound to an interrogating electrode.8,10–12,17,20–22 As such, E-AB signaling occurs when target binding induces a change in the efficiency with which the redox tag exchanges electrons with the electrode because of changes in aptamer conformation and/or flexibility.14 Unfortunately, however, while traditional aptamer selection methods have yielded a variety of aptamer structures directed against a wide range of molecular targets (see, e.g., ref. 15 and 16), they generally produce well-folded aptamers that fail to undergo any significant conformational change upon target binding. And while some aptamers support E-AB signaling even in the absence of any binding-induced conformational change (Fig. 1A), robust E-AB signaling generally requires that binding be coupled to a large-scale change in aptamer geometry.14 Fortunately, several approaches are available by which normally well-folded aptamers can be re-engineered to undergo a large-scale, binding-induced conformational change. These include: (1) destabilization of the native aptamer fold by truncation or the introduction of point mutations, which couples binding to the folding of the aptamer3,12,17 (Fig. 1B); (2) the introduction of an antisense sequence, which couples binding with a shift from a double-stranded aptamer-antisense duplex to the native fold8,18 (Fig. 1C); and (3) the addition of a long, unstructured DNA sequence that separates the aptamer into two domains that associate upon target binding forming a “pseudosandwich”19 (Fig. 1D).
Fig. 1.
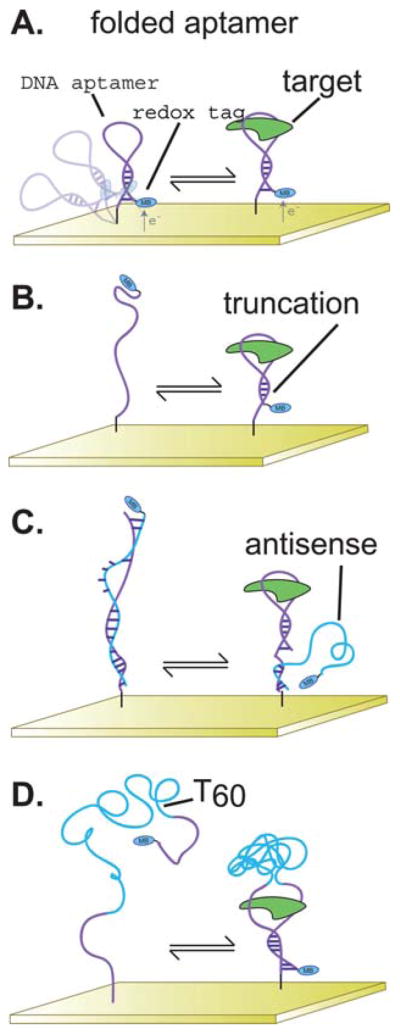
(A) Full-length, folded aptamers sometimes support E-AB signaling, albeit typically with only rather modest changes in signaling upon target binding.9,22 Several approaches have been reported, however, by which aptamers can be engineered to undergo large-scale, binding-induced conformational changes that significantly improve E-AB signaling.26,27 These approaches include (B) the destabilization of the wild type aptamer via introduction of sequence truncations or point mutations, (C) the introduction of antisense sequences, or (D) the introduction of long unstructured sequences internal to the aptamer. The overarching goal of each of these approaches is to create an alternative structure in equilibrium with the “native”, target-binding fold such that the presence of the target pushes the equilibrium back to this native fold.
The availability of several mechanisms by which binding-induced conformational change can be engineered into an aptamer has significant implications for the optimization of E-AB sensors. Specifically, recent studies suggest that the manner in which an aptamer is re-engineered to generate a binding-induced conformational change can significantly alter the signal gain (relative change in signal upon target binding, and thus the detection limit and sensitivity) of the resulting sensor. An illustrative example of this is provided by the several E-AB sensors that have been fabricated to date starting from the 15-nucleotide thrombin aptamer of Bock and co-workers.20 For example, Xiao et al. demonstrated that the fully folded aptamer supports E-AB signaling in a signal-off format (target binding reduces the observed current), albeit with only modest −20% gain.14 In contrast, under conditions in which the aptamer undergoes binding-induced folding it can, depending on the details, produce either a higher gain signal-off21 or signal-on22 sensor. Finally, Xiao et al. have described a strand-displacement architecture employing an antisense strand that produces a high gain, signal-on sensor.18 Motivated by the extent to which these studies suggest that aptamer architecture affects E-AB signaling we have investigated this question in systematic detail by performing side-by-side comparisons of several strategies for engineering binding-induced conformation change, and thus E-AB signaling, into two representative aptamers.
Results
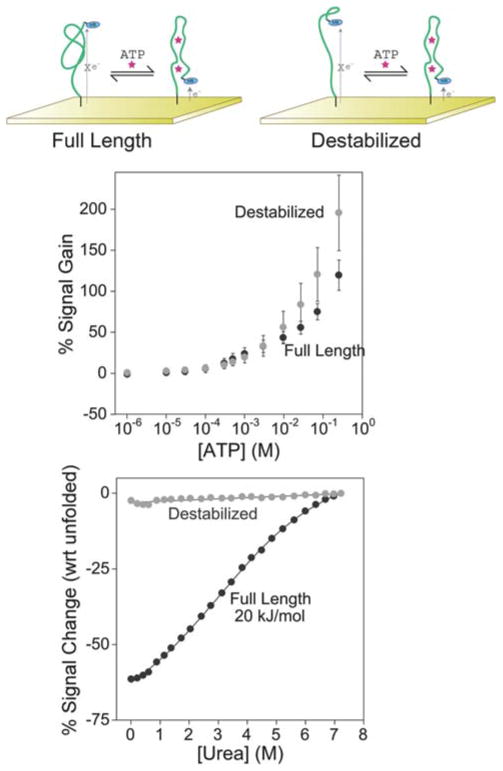
As our first test-bed we employed the 26-base adenosine triphosphate (ATP) binding aptamer of Huizenga et al.,23 which simultaneously binds two ATP molecules.24 Previous studies have adapted this aptamer to a number of optical25–29 and electrochemical8,9,30,31 sensors but prior to this work no reagentless (self-reporting) E-AB sensor had yet been reported. In our first attempt to convert this aptamer into an E-AB sensor we employed the full-length sequence of Huizenga modified only with a reporting methylene blue redox tag and a thiol for surface attachment. We find that, although previous fluorescence-based assays suggested that this aptamer does not undergo any significant binding-induced conformational change,28 this construct supports efficient E-AB sensing, achieving 130% gain at the highest target concentrations we have investigated (Fig. 2). The dynamic range of this sensor spans ~5 orders of magnitude, including the physiological range of 0.1–3 mM.32 Indeed, the dynamic range of the sensor is limited at the upper end by the solubility of ATP; the sensor does not appear to saturate at the highest ATP concentrations (250 mM) we have tested.
Fig. 2.
Both the full-length anti-ATP aptamer (top left) and a destabilized sequence (top right) support efficient E-AB signaling (middle). The destabilized sequence produces a gain (relative signal change in the presence of target) of 190%, which is slightly greater than the 130% observed for the full-length aptamer. Urea denaturation curves (bottom) performed on electrode-bound aptamers indicate that the full-length sequence is folded in the absence of ATP. The destabilized construct, in contrast, appears to be unstructured in the absence of target. Reported error bars reported here in and in the following figures represent the standard deviation of measurements taken from at least three independently fabricated sensors.
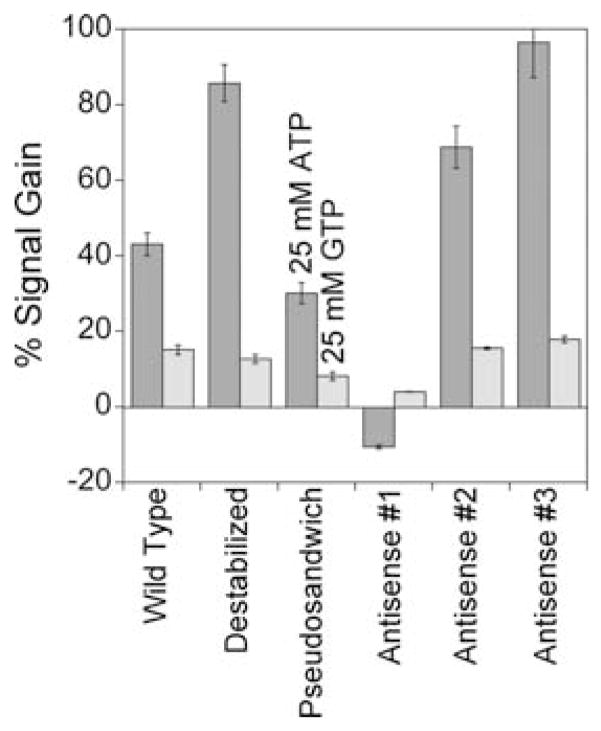
Whereas the full-length aptamer supports efficient E-AB signaling, a construct destabilized by the removal of two bases from both termini (and the introduction of a point mutation at the new 5′-end to prevent the formation of an alternative secondary structure) produces slightly greater gain of 190 ± 45% (Fig. 2). That is, destabilization of the full-length sequence such that, in the absence of its target, the unfolded state dominates the conformational equilibrium increases the signal change observed upon the addition of target. Urea denaturation studies (Fig. 2) support this mechanism: whereas the folding free energy of the full-length aptamer is 20 kJ mol−1 (indicating that >99.6% of the chains are folded even in the absence of target), the truncated, destabilized aptamer shows no change in signaling upon addition of this denaturant, indicating that it is largely unfolded in the absence of target. By analogy to most other E-AB sensors (e.g., see ref. 14), this unfolded construct presumably undergoes binding-induced folding, leading to an increase in the observed signal gain. Of note, neither destabilization nor any of the other modifications we have performed (below) affect the specificity of the sensor (Fig. 3).
Fig. 3.
The E-AB signal response to ATP is specific for all of the ATP-binding architectures we have explored. Shown are responses of each sensor to ATP (dark grey) and GTP (light grey), both at 25 mM. The signal drop (negative gain) observed for the first antisense sequence presumably results from binding-induced changes causing a decrease in electron transfer efficiency.
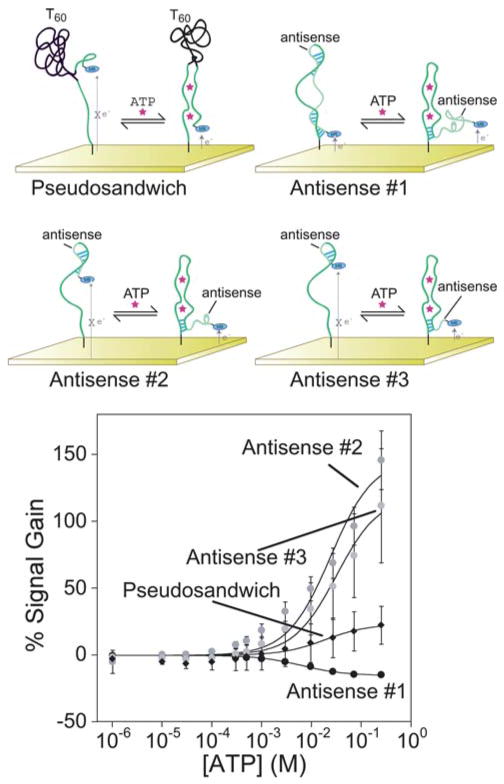
Applying the antisense method to generate the thrombin-detecting E-AB sensor produces a particularly high gain sensor18 and thus we have also explored this approach for creating alternate, non-target-binding conformations in the anti-ATP aptamer. Specially, we have added different sequences to the 3′-terminus that are complementary to the full-length aptamer to shift the folding equilibrium from the target-binding state to an alternative fold. We find, however, that at 146 ± 22% the gain of even the best of these constructs (construct AS2 in Fig. 4) falls short of that observed for the destabilized construct. The other two antisense constructs we have characterized signal more poorly still: the longest antisense sequence signals the presence of ATP with a modest decrease in signal of ~15% and the shortest sequence achieves a positive gain of ~100%, both at the highest ATP concentration we have employed.
Fig. 4.
The addition of antisense and unstructured sequences internal to the anti-ATP aptamer sequence also generates constructs that support E-AB signaling, albeit with varying levels of success. The introduction of a 60 base polythymine sequence (pseudosandwich) is the poorest performing sequence and exhibits very significant sensor-to-sensor variability. Introducing antisense sequences of varying length produce both signal-on and signal-off architectures. Antisense #1, the longest sequence at 28 bases (forming 11 base pairs) produces a modest, but very reproducible, signal-off signal. The shorter antisense sequences (AS2 and AS3) both produce greater signal changes upon ATP addition.
In our final approach to engineering a binding-induced conformational change into the anti-ATP aptamer we separated the aptamer into two “domains” via the introduction of a 60 base polythymine linker such that target binding causes the association of the two halves (by analogy to ref. 19). This “pseudosandwich” construct, however, does not support efficient E-AB signaling (Fig. 4). Moreover, for reasons that remain unclear, the sensor-to-sensor variation for this construct (calculated as the standard deviations for at least three independently fabricated sensors) is very high, precluding the quantitative determination of ATP concentrations.
While destabilization yields the highest gain ATP sensor (Fig. 2), this result is not universal for all aptamers. For example, the highest gain of the several thrombin sensors we have previously reported involves an antisense approach, which yields a gain several-fold greater than that observed via destabilization.18 These observations suggest that the optimal approach to aptamer re-engineering will vary from aptamer to aptamer. In order to more fully explore this issue we have employed the same engineering strategies employed above with an aptamer directed against the protein immunoglobulin E (IgE). This aptamer, first described by Wiegand et al.,33 is predicted by the well-established mfold algorithm34 to adopt a stem-loop type structure with a 5-base pair (4 GC) stem joining the 3′ and 5′ termini and a 26-base loop region (see Fig. 5). Starting from this full-length sequence we have generated aptamer geometries analogous to all of the ATP constructs described above.
Fig. 5.
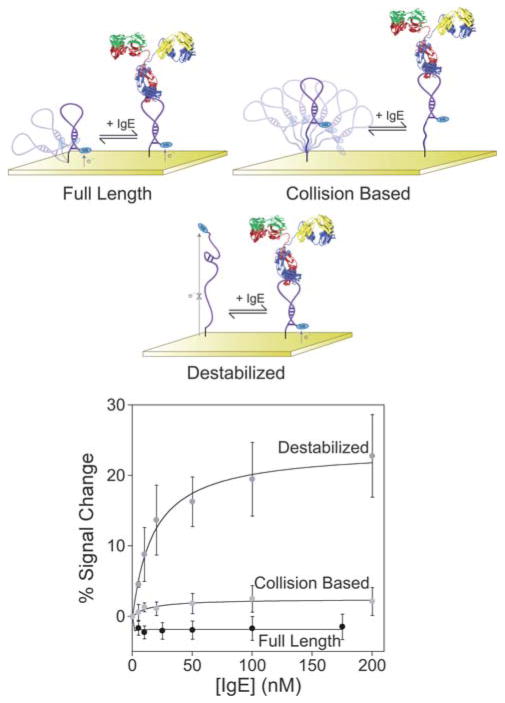
Neither the full-length anti-IgE aptamer nor a construct modified via the addition of a 10-base polythymine linker to increase flexibility supports efficient E-AB signaling. In contrast, a destabilized sequence (through point mutation) supports at least modest E-AB gain. The destabilized aptamer produces a signal change of 20% at saturating IgE concentrations (200 nM) with an apparent affinity of 18 ± 3 nM.
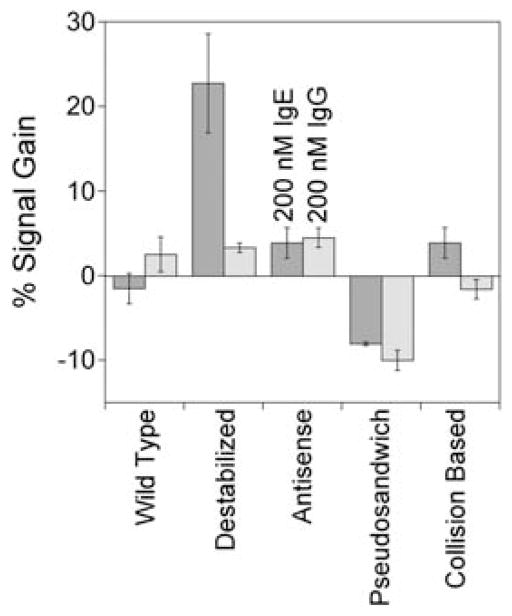
Given the high molecular weight and relatively large steric bulk of IgEs, we originally predicted that the binding of this target to even the full-length aptamer would alter the efficiency with which the attached redox tag strikes the electrode, and thus, we assumed the full-length aptamer would support E-AB signaling.14 However, despite numerous observations indicating that the surface-attached aptamer retains its ability to bind IgEs (see, e.g., Fischer et al.35 and Xiao et al.14) we see no significant signal change in the presence of this target (Fig. 5). This holds true even if we insert a flexible, 10-base polythymine linker between the full-length sequence and its surface attachment site, which we assumed would amplify any binding-induced change in collision efficiency (Fig. 5). In contrast, destabilization of the full-length stem-loop aptamer supports E-AB sensing, albeit with modest gain. Specifically, by introducing a G to T substitution at position 30 in the aptamer produces a destabilized variant that supports E-AB signaling with 22 ± 6% signal gain at the highest target concentrations (Fig. 5) and a binding affinity, 18 ± 3 nM, only slightly poorer than the 10 nM reported for the full-length aptamer.35 The sensor likewise remains as specific as the parent aptamer from which it was fabricated (Fig. 6).
Fig. 6.
Only the destabilized anti-IgE aptamer architecture exhibits a specific response to target. Shown are the responses of all IgE aptamer architectures tested for both 200 nM IgE (dark grey) and for 200 nM IgG (light grey).
While destabilization of the anti-IgE aptamer leads to modest E-AB signal gain, neither the introduction of antisense sequences nor the creation of a pseudosandwich construct supports efficient E-AB signaling. For example, a probe modified via the addition of a 12-base antisense extension to the 3′-terminus of the full-length aptamer (via a 4-thymine linker) exhibits effectively no signal change in the presence of IgE (Fig. S1†). Likewise, the inclusion of a flexible 60-base polythymine linkers in the middle or at the 5′ side of the aptamer’s loop region to form pseudosandwich constructs produces sensors in which the current decreases (i.e., the gain is negative) in the presence of IgE (Fig. S1†). This effect, however, appears to arise due to non-specific binding as the addition of human immunoglobulin Gs (IgGs), a negative control target (Fig. 6).
Discussion
Here we presented a side-by-side comparison of various strategies by which large-scale, binding-induced conformational changes can be re-engineered into normally well-folded aptamers such that they support E-AB signaling. Using aptamers directed against the small molecule adenosine triphosphate and the large protein immunoglobulin E we find that several of the approaches addressed in this study lead to signaling aptamer constructs. However, the gains of the constructs differ over orders of magnitude, further suggesting that aptamer architecture is a key parameter in the optimization of this class of sensors.
While destabilization of the native aptamer fold leads to the highest gain for both the ATP- and IgE-binding aptamers, a review of the literature suggests that this observation may not be universally true and that the optimal architecture may differ significantly from aptamer to aptamer. For example, a cocaine E-AB sensor employing the pseudosandwich approach to create a large-scale conformational change in the cocaine aptamer structure leads to a 4-fold increase in signal gain over the original destabilized cocaine construct.3,19 The effects of aptamer geometry are similarly illustrated by studies of the anti-thrombin aptamer: not only can the signal gain be significantly improved by varying the aptamer geometry, but the sign of the signal gain can be flipped from signal-off to signal-on as well. That is, by using a longer construct, the presence of thrombin is signaled by a decrease in faradaic current (e.g., see ref. 21). However, if the sequence is shortened to only include the binding region of the aptamer, or if an antisense approach is adopted, the presence of thrombin produces an increase in signal, as shown by Xiao et al.18 and Radi et al.22
Combining our findings with these previous reports of aptamer engineering to create signaling E-AB sensors, it is clear that identifying the right aptamer architecture is a ready means of optimizing E-AB signaling. Moreover, although the optimal architecture clearly differs among aptamer probes, the approaches presented within nevertheless provide a general guideline for the creation of future E-AB sensors.
Experimental
Reagents and DNA probes
Casein, urea, 6-mercapto-1-hexanol, adenosine-5′-triphosphate (ATP) disodium salt and guanosine-3′-triphosphate (GTP) disodium salt (Sigma Aldrich) were used as received. Solutions containing the appropriate molar concentrations of ATP and GTP were prepared using 1.0 M NaCl, 0.1 M Tris buffer and carefully adjusted to a final pH of 7.0. Immunoglobulin E–human myeloma plasma (Athens Research, Athens, GA) was used as received and stored at −20 °C until needed. Human immunoglobulin Gs (Equitech-Bio Inc, Kerrville, TX) were used as received. All aptamer-DNA sequences, as seen in Table 1 and 2, were used as received without further purification (HPLC-purified, Biosearch Technologies, Inc. Novato, CA). All solutions were prepared using ultrapure water (18 MΩ cm, Milli-Q Ultrapure Water Purification, Millipore, Billerica, MA).
Table 1.
ATP aptamer constructs
| Sequence (5′→3′) | |
|---|---|
| Full length | HSC6-ACCTGGGGGAGTATTGCGGAGGAAGGT-MB |
| Destabilized | HSC6-CTGGGGGAGTATTGCGGAGGAAA-MB |
| Antisense #1 (AS1) | HSC6-ACCTGGGGGAGTATTGCGGAGGAAGGTTTTTTTCT TCTTTTTTTTTTTCCAGGTG-MB |
| Antisense #2 (AS2) | HSC6-ACCTGGGGGAGTATTGCGGAGGAAGGTTTTTTTCTTC-MB |
| Antisense #3 (AS3) | HSC6-ACCTGGGGGAGTATTGCGGAGGAAGGTTTTTTCCT-MB |
| Pseudosandwich | HSC6-ACCTGGGGGAGTAT-T60-TGCGGAGGAAGGT-MB |
Table 2.
IgE aptamer constructs
| Sequence (5′→3′) | |
|---|---|
| Full length | HSC6-AGCCCATTTATCCGTTCCTCCTAGTGGTGGGC-MB |
| Destabilized | HSC6-AGCCCATTTATCCGTTCCTCCTAGTGGTGTGC-MB |
| Collision-based | HSC6-TTTTTTTTTTAGCCCATTTATCCGTTCCTCCTAGTGGTGGGC-MB |
| Antisense | HSC6-AGCCCATTTATCCGTTCCTCCTAGTGGTGGGCTT(T-MB)TTGCCCACCACTAG |
| Pseudosandwich #1 | HSC6-AGCCCA-T60-TTTATCCGTTCCTCCTAGTGGTGGGC-MB |
| Pseudosandwich #2 | HSC6-AGCCCATTTATCCGTTC-T60-CTCCTAGTGGTGGGC-MB |
E-AB sensor fabrication
E-AB sensors were fabricated using a previously well-documented procedure.36 Briefly, gold disk electrodes (CH Instruments, Austin TX) were first mechanically polished in a 1 micron diamond suspension (Buehler, Lake Bluff, IL) in oil followed by a 5 min sonication in ethanol. This was followed by mechanical polishing in a slurry of 50 nM alumina oxide particles (Buehler, Lake Bluff, IL) in water followed by sonication for 5 min in water. The electrodes were then subjected to an electrochemical cleaning protocol through successive scans in sulfuric acid solutions.36 All DNA solutions were reduced in 10 mM tris-(2-carboxyethyl)phosphine hydrochloride (Molecular Probes, Carlsbad, CA) for 1 h prior to immobilization onto the electrode surface. For ATP sensors, the gold electrodes were incubated for 30 min in 1 μM DNA in 1.0 M NaCl, 0.1 M Tris buffer (pH 7.0) followed by incubation in 3 mM 6-mercapto-1-hexanol for 2 h (in same buffer). The IgE sensors were incubated in respective DNA solutions at 0.2 μM (in a IgE buffer consisting of 20 mM Tris at a pH of 7.5, 100 mM NaCl and 5 mM MgCl2) for 1 h followed by a 1 h incubation in 3 mM 6-mercapto-1-hexanol for 1 h (same buffer solution). All sensors were used immediately after fabrication.
Electrochemical measurements
Electrochemical measurements were performed using a CH Instruments 630B electrochemical workstation. Sensors were interrogated using square wave voltammetry at a frequency of 60 Hz and peak amplitude of 25 mV. Prior to titrations with IgE (or IgG), IgE-aptamer sensors were incubated for 90 min in blocking buffer (IgE buffer with 10 mg ml−1 casein and 0.1% Tween-20) to passivate the electrode surface from non-specific adsorption effects.35 Prior to measurements, IgE sensors were allowed to sit in target solutions for 60 min. Signal gain in all of the data presented is calculated as the relative change in square-wave voltammetric (SWV) peak current with respect to the baseline peak current (i.e., 100% × (current with target–current without target)/(current without target)). Reported error bars reported in the figures represent the standard deviation of measurements taken from at least three sensors that were independently fabricated and tested.
Supplementary Material
Acknowledgments
This research was supported by the NIH (Grant EB007689-02 to K.W.P.), the Institute for Collaborative Biotechnologies through Grant DAAD19-03-D-0004 from the US Army Research Office (to K.W.P.), and a fellowship by National Institutes of Health under Ruth L. Kirschstein National Research Service Award (1 F32 GM087126-01A1) (to R.J.W.). R.J.W. would like to thank Dr. Vallée-Bélisle for helpful discussion and insight with regards to the urea denaturation experiments.
Footnotes
Electronic supplementary information (ESI) available: Schematics and binding curves of non-signaling anti-IgE aptamer geometries.
References
- 1.Hianik T, Wang J. Electroanalysis (N Y) 2009;21:1223–1235. [Google Scholar]
- 2.Ellington AD, Szostak JW. Nature. 1992;355:850–852. doi: 10.1038/355850a0. [DOI] [PubMed] [Google Scholar]
- 3.Baker BR, Lai RY, Wood MS, Doctor EH, Heeger AJ, Plaxco KW. J Am Chem Soc. 2006;128:3138–3139. doi: 10.1021/ja056957p. [DOI] [PubMed] [Google Scholar]
- 4.Ferapontova EE, Gothelf KV. Langmuir. 2009;25:4279–4283. doi: 10.1021/la804309j. [DOI] [PubMed] [Google Scholar]
- 5.Ferapontova EE, Olsen EM, Gothelf KV. J Am Chem Soc. 2008;130:4256–4258. doi: 10.1021/ja711326b. [DOI] [PubMed] [Google Scholar]
- 6.Zayats M, Huang Y, Gill R, Ma C-a, Willner I. J Am Chem Soc. 2006;128:13666–13667. doi: 10.1021/ja0651456. [DOI] [PubMed] [Google Scholar]
- 7.Zheng D, Seferos DS, Giljohann DA, Patel PC, Mirkin CA. Nano Lett. 2009;9:3258–3261. doi: 10.1021/nl901517b. [DOI] [PMC free article] [PubMed] [Google Scholar]
- 8.Zuo X, Song S, Zhang J, Pan D, Wang L, Fan C. J Am Chem Soc. 2007;129:1042–1043. doi: 10.1021/ja067024b. [DOI] [PubMed] [Google Scholar]
- 9.Zuo X, Xiao Y, Plaxco KW. J Am Chem Soc. 2009;131:6944–6945. doi: 10.1021/ja901315w. [DOI] [PMC free article] [PubMed] [Google Scholar]
- 10.Radi AE, O’Sullivan CK. Chem Commun. 2006:3432–3434. doi: 10.1039/b606804a. [DOI] [PubMed] [Google Scholar]
- 11.Xiao Y, Rowe AA, Plaxco KW. J Am Chem Soc. 2006;129:262–263. doi: 10.1021/ja067278x. [DOI] [PubMed] [Google Scholar]
- 12.Lai RY, Plaxco KW, Heeger AJ. Anal Chem. 2006;79:229–233. doi: 10.1021/ac061592s. [DOI] [PubMed] [Google Scholar]
- 13.Sassolas A, Blum LJ, Leca-Bouvier BD. Electroanalysis (N Y) 2009;21:1237–1250. [Google Scholar]
- 14.Xiao Y, Uzawa T, White RJ, DeMartini D, Plaxco KW. Electroanalysis (N Y) 2009;21:1267–1271. doi: 10.1002/elan.200804564. [DOI] [PMC free article] [PubMed] [Google Scholar]
- 15.Bunka DHJ, Stockley PG. Nat Rev Microbiol. 2006;4:588–596. doi: 10.1038/nrmicro1458. [DOI] [PubMed] [Google Scholar]
- 16.Gopinath SCB. Arch Virol. 2007;152:2137–2157. doi: 10.1007/s00705-007-1014-1. [DOI] [PubMed] [Google Scholar]
- 17.Stojanovic MN, de Prada P, Landry DW. J Am Chem Soc. 2001;123:4928–4931. doi: 10.1021/ja0038171. [DOI] [PubMed] [Google Scholar]
- 18.Xiao Y, Piorek BD, Plaxco KW, Heeger AJ. J Am Chem Soc. 2005;127:17990–17991. doi: 10.1021/ja056555h. [DOI] [PubMed] [Google Scholar]
- 19.White RJ, Plaxco KW. Proc SPIE-Int Soc Opt Eng. 2009;7321:732105-1–732105-9. doi: 10.1117/12.820419. [DOI] [PMC free article] [PubMed] [Google Scholar]
- 20.Bock LC, Griffin LC, Latham JA, Vermaas EH, Toole JJ. Nature. 1992;355:564–566. doi: 10.1038/355564a0. [DOI] [PubMed] [Google Scholar]
- 21.Xiao Y, Lubin AA, Heeger AJ, Plaxco KW. Angew Chem, Int Ed. 2005;44:5456–5459. doi: 10.1002/anie.200500989. [DOI] [PubMed] [Google Scholar]
- 22.Radi A-E, Acero Sanchez JL, Baldrich E, O’Sullivan CK. J Am Chem Soc. 2005;128:117–124. doi: 10.1021/ja053121d. [DOI] [PubMed] [Google Scholar]
- 23.Huizenga DE, Szostak JW. Biochemistry. 2002;34:656–665. doi: 10.1021/bi00002a033. [DOI] [PubMed] [Google Scholar]
- 24.Lin CH, Patei DJ. Chem Biol. 1997;4:817–832. doi: 10.1016/s1074-5521(97)90115-0. [DOI] [PubMed] [Google Scholar]
- 25.Jhaveri SD, Kirby R, Conrad R, Maglott EJ, Bowser M, Kennedy RT, Glick G, Ellington AD. J Am Chem Soc. 2000;122:2469–2473. [Google Scholar]
- 26.Nutiu R, Li Y. J Am Chem Soc. 2003;125:4771–4778. doi: 10.1021/ja028962o. [DOI] [PubMed] [Google Scholar]
- 27.Tang Z, Mallikaratchy P, Yang R, Kim Y, Zhu Z, Wang H, Tan W. J Am Chem Soc. 2008;130:11268–11269. doi: 10.1021/ja804119s. [DOI] [PubMed] [Google Scholar]
- 28.Urata H, Nomura K, Wada S-i, Akagi M. Biochem Biophys Res Commun. 2007;360:459–463. doi: 10.1016/j.bbrc.2007.06.075. [DOI] [PubMed] [Google Scholar]
- 29.Wang J, Jiang Y, Zhou C, Fang X. Anal Chem. 2005;77:3542–3546. doi: 10.1021/ac050165w. [DOI] [PubMed] [Google Scholar]
- 30.Han K, Chen L, Lin Z, Li G. Electrochem Commun. 2009;11:157–160. [Google Scholar]
- 31.Kim J, Kim IY, Choi MS, Wu Q. Chem Commun. 2009:4747–4749. doi: 10.1039/b908344h. [DOI] [PubMed] [Google Scholar]
- 32.Traut TW. Mol Cell Biochem. 1994;140:1–22. doi: 10.1007/BF00928361. [DOI] [PubMed] [Google Scholar]
- 33.Wiegand T, Williams P, Dreskin S, Jouvin M, Kinet J, Tasset D. J Immunol. 1996;157:221–230. [PubMed] [Google Scholar]
- 34.Zuker M. Methods Enzymol. 1989;180:262–288. doi: 10.1016/0076-6879(89)80106-5. [DOI] [PubMed] [Google Scholar]
- 35.Fischer NO, Tok JBH, Tarasow TM. PLoS One. 2008;3:e2720. doi: 10.1371/journal.pone.0002720. [DOI] [PMC free article] [PubMed] [Google Scholar]
- 36.Xiao Y, Lai RY, Plaxco KW. Nat Protocols. 2007;2:2875–2880. doi: 10.1038/nprot.2007.413. [DOI] [PubMed] [Google Scholar]
Associated Data
This section collects any data citations, data availability statements, or supplementary materials included in this article.


