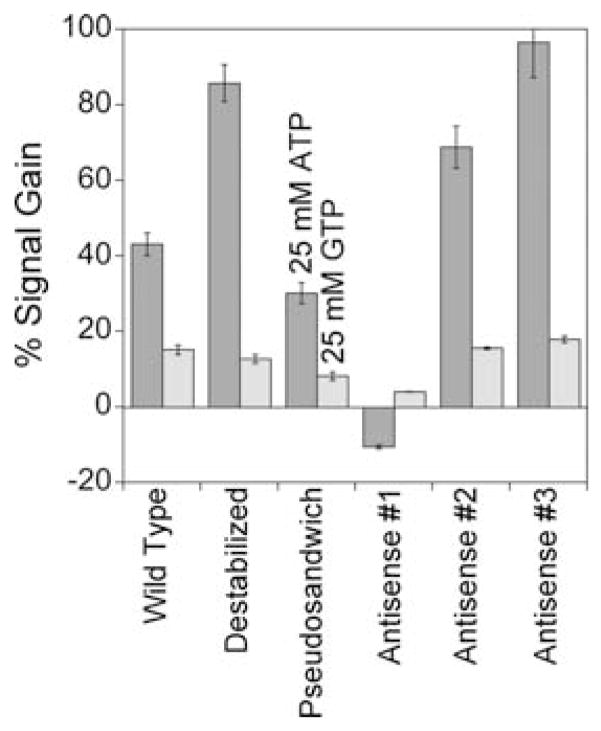
Fig. 3.
The E-AB signal response to ATP is specific for all of the ATP-binding architectures we have explored. Shown are responses of each sensor to ATP (dark grey) and GTP (light grey), both at 25 mM. The signal drop (negative gain) observed for the first antisense sequence presumably results from binding-induced changes causing a decrease in electron transfer efficiency.

