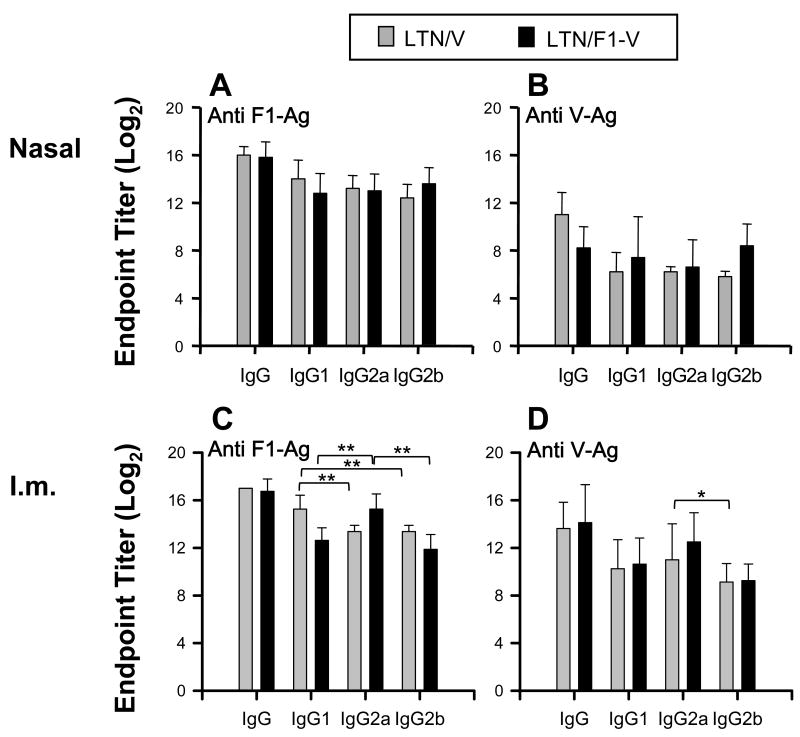
Fig. 3.
IgG subclass responses to F1-Ag and V-Ag from LTN DNA vaccinated mice. Sera (the same as those from those in Fig. 2) from LTN/V-Ag DNA and LTN/F1-V DNA vaccinated mice by the (A,B) nasal or (C,D) i.m. route on week 12. Endpoint titers depicted as the mean ± SD for 10 mice/group. * P < 0.05 and ** P < 0.01 are significant differences between each IgG subclass response.

