

Abstract
Background
Vascular endothelial growth factor (VEGF) is an endothelial cell mitogen that stimulates vasculogenesis. It has also been shown to act as a neurotrophic factor in vitro and in vivo. Deletion of the hypoxia response element of the promoter region of the gene encoding VEGF in mice causes a reduction in neural VEGF expression, and results in adult-onset motor neurone degeneration that resembles amyotrophic lateral sclerosis (ALS). Investigating the molecular pathways to neurodegeneration in the VEGFδ/δ mouse model of ALS may improve understanding of the mechanisms of motor neurone death in the human disease.
Results
Microarray analysis was used to determine the transcriptional profile of laser captured spinal motor neurones of transgenic and wild-type littermates at 3 time points of disease. 324 genes were significantly differentially expressed in motor neurones of presymptomatic VEGFδ/δ mice, 382 at disease onset, and 689 at late stage disease. Massive transcriptional downregulation occurred with disease progression, associated with downregulation of genes involved in RNA processing at late stage disease. VEGFδ/δ mice showed reduction in expression, from symptom onset, of the cholesterol synthesis pathway, and genes involved in nervous system development, including axonogenesis, synapse formation, growth factor signalling pathways, cell adhesion and microtubule-based processes. These changes may reflect a reduced capacity of VEGFδ/δ mice for maintenance and remodelling of neuronal processes in the face of demands of neural plasticity. The findings are supported by the demonstration that in primary motor neurone cultures from VEGFδ/δ mice, axon outgrowth is significantly reduced compared to wild-type littermates.
Conclusions
Downregulation of these genes involved in axon outgrowth and synapse formation in adult mice suggests a hitherto unrecognized role of VEGF in the maintenance of neuronal circuitry. Dysregulation of VEGF may lead to neurodegeneration through synaptic regression and dying-back axonopathy.
Background
Amyotrophic lateral sclerosis (ALS) is a fatal neurodegenerative disorder in which selective loss of motor neurones in the cerebral cortex, brainstem and spinal cord leads to progressive paralysis. In the majority of cases of ALS, the cause of motor neurone degeneration is unknown, although a number of pathogenic processes, including oxidative stress, excitotoxicity, inflammation, and mitochondrial and neurofilament dysfunction, are thought to play important roles. Ten percent of cases of ALS are familial, and in 20% of these, a causative mutation is found in the gene encoding superoxide dismutase I (SOD1), a free radical scavenger. In the SOD1 rodent model of ALS, overexpression of human mutant SOD1 causes adult onset motor neurone degeneration.
Vascular endothelial growth factor (VEGF) is an endothelial cell mitogen that stimulates angiogenesis in response to hypoxia, in the developing embryo and in a number of pathological conditions, such as tumour growth. VEGF transcription is upregulated by binding of hypoxia inducible factor (HIF-1) to a hypoxia response element (HRE) in the 5' promoter region of the gene. In 2001, Oosthuyse et al deleted the HRE of the VEGF gene in mice, to generate VEGFδ/δ mice [1], which express reduced levels of Vegf in neural tissue under both baseline and hypoxic conditions. VEGFδ/δ mice show 60% mortality at or around birth, and surviving transgenic mice are slightly smaller than their wild-type littermates. At 5 months of age, they develop a motor neurodegenerative phenotype that resembles ALS, with impairment of motor behaviours and motor tests, such as the treadmill test. Electrophysiological studies show signs of denervation and compensatory reinnervation, muscle histology shows neurogenic atrophy, and peripheral nerves show loss of large myelinated motor axons. In the spinal cord and brainstem, similar numbers of motor neurones are present until 3 months of age, but by 17 months, there is a 30% reduction in motor neurone numbers, with a reactive astrocytosis, and neurofilament inclusions in surviving neurones [1]. The mechanism of neurodegeneration in VEGFδ/δ mice is unknown. Chronic hypoxia has been proposed, as although vascular structure in the sciatic nerve and spinal cord is normal, baseline neural blood flow is reduced by 44%. In addition to vascular development, however, VEGF plays a central role in the development of the nervous system, and may be required for survival of adult neurones [2]. Disruption of these functions may determine the development of neuronal degeneration in VEGFδ/δ mice.
VEGF has neurotrophic effects in vitro in a wide range of culture conditions, promoting cell survival and neurite outgrowth, via its tyrosine kinase receptor, VEGFR2 [3]. In vivo, VEGF administration prolongs survival in the SOD1 model of ALS [4]. This is likely to be a direct neuroprotective effect, as SOD1 mice crossed with mice with neuronal overexpression of VEGFR2 also exhibit delayed disease progression [5]. In the developing nervous system, VEGF released by neuroblasts and glia induces the ingrowth of capillaries, and deletion of a single copy of VEGF is lethal [6,7]. VEGF stimulates neurogenesis directly [8], and via endothelial cell proliferation, to form vascular niches in which neurogenesis is stimulated by endothelial-derived BDNF [9,10]. Further interaction between vascular and neuronal development is seen in the closely aligned growth of blood vessels and peripheral nerves, directed by attractive and repulsive cues on the growth cone [11]. The VEGF co-receptor, Neuropilin-1 mediates both repulsive signals of the semaphorin family, and attractant signals of VEGF [11,12]. Thus VEGF, with its angiogenic and neurotrophic actions via VEGFR2, and shared receptor with the semaphorin axon guidance factors, may be a key player in the parallel development of vascular and nervous systems.
A recent meta-analysis of association studies of VEGF polymorphisms with ALS showed an increased risk of ALS in male patients with the -2578AA genotype, which lowers VEGF expression[13]. We have previously shown that levels of expression of VEGF and its main agonist receptor are reduced in the spinal cord of patients with ALS[14]. This study aims to clarify the molecular mechanisms of neurodegeneration in the VEGFδ/δ mouse, by determination of the transcriptional profile of isolated spinal motor neurones in the transgenic mouse, compared to its wild type littermate. Understanding the role of VEGF in the survival and death of motor neurones in this mouse model of ALS may have implications for the human disease.
We report that adult VEGFδ/δ mice show reduction in expression, from symptom onset, of genes involved in nervous system development, particularly in axonogenesis and synapse formation, and that axon outgrowth is reduced in motor neurone cultures derived from VEGFδ/δ mice. These changes suggest a role for VEGF in the maintenance of neuronal circuitry, disruption of which may result in a dying-back axonopathy.
Methods
Experimental animals
Adult female VEGFδ/δ mice and wild type littermates (Vesalius Research Institute, Leuven, Belgium) were used in this study. VEGFδ/δ mice, on a Swiss/129 background, had homozygous deletion of the HIF-1 response element (hypoxia response element) in the promoter region of the VEGF gene, and were generated as previously described [1]. All mice were housed in conventional facilities with a 12 h light/dark cycle with access to food at libitum. The local animal ethical committee, the Ethische Commissie Dierproeven (ECD) at the Catholic University Leuven, Belgium, approved the VEGFδ/δ mouse experiments.
Tissue collection
Three female VEGFδ/δ transgenic mice, and three gender-matched wild-type littermate controls were sacrificed at 3 months (pre-symptomatic), 5 months (onset of symptoms) and 14 months (late stage disease) of age, by overdose of isoflurane inhalational anaesthetic. Post mortem, animals were perfused by intracardiac injection of 15 ml sterile phosphate buffer with 30% sucrose, and the CNS was dissected and frozen in Cryo-M-Bed embedding compound (Bright, Huntingdon, UK). The procedure of sucrose perfusion and dissection of the spinal cord was conducted rapidly, within a maximum of ten minutes from terminal anaesthesia to snap freezing of tissue, to ensure optimal preservation of RNA quality. Lumbar spinal cord sections (10 μm) were fixed in 70% ethanol, washed in DEPC-treated water, and stained for 1 minute in a solution of 0.1% w/v Toluidine Blue in 0.1 M sodium phosphate. They were then washed and dehydrated through graded ethanol concentrations (70, 90 and 100%), and xylene.
Laser capture microdissection, RNA isolation and amplification
Spinal motor neurones, identified by staining, anatomical location, size and morphology, were isolated on Capsure Macro LCM caps using the Arcturus PixCell II laser capture microdissection system (Arcturus Bioscience, Mountain View, CA). Approximately 1500 motor neurones were dissected from each spinal cord, and >50 ng RNA extracted using the PicoPure™ RNA isolation kit (Arcturus), according to manufacturer's instructions. RNA amplification was carried out using a linear amplification process in 2 cycles, with the GeneChip two cycle target labelling and control kit (Affymetrix, Santa Clara, USA), and MEGAscript® T7 kit (Ambion, Austin, USA). The linear amplification technique has been shown to generate highly reproducible gene expression profiles from small starting quantities of RNA [15]. This procedure produced 50-100 μg of biotin labelled antisense RNA for each sample, the quality and quantity of which was assayed using the Agilent bioanalyser and Nanodrop™ 1000 spectrophotometer (Thermo Scientific, Wilmington, USA).
Quality control parameters
At each stage of extraction, amplification and microarray analysis, we carried out quality control (QC) measures, according to Affymetrix protocols, to ensure that RNA was of sufficient quality and was matched between samples. Where QC outliers were identified, these samples were excluded from the analysis. We used visual interpretation of RNA profiles from bioanalyser traces of extracted and amplified RNA to determine RNA quality, as the 28S:18S ratio has been shown to have only weak correlation with gene expression levels in downstream experiments[16]. The RNA profiles obtained from laser captured material in this study were comparable to profiles with modest RNA degradation, that has been shown to have little effect on the results of microarray analysis [17,18] (Figure 1) Following amplification, the most frequent length of RNA amplicons, at 500-1000 kB, was consistent with Affymetrix protocols. Affymetrix and Bioconductor software was used to generate, from microarray data, the QC measures of average background, signal intensity, percent present calls, and RNA degradation plots, to ensure that samples were comparable in all parameters.
Figure 1.
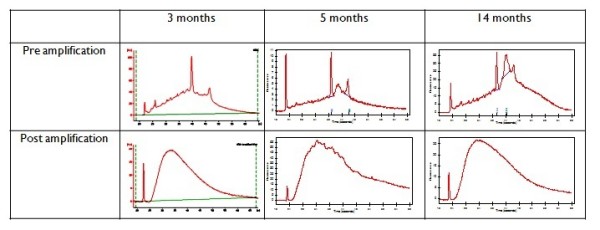
Representative bioanalyser traces of RNA samples pre- and post-amplification at 3 months, 5 months and 14 months.
Affymetrix GeneChip processing
15 μg amplified cRNA was fragmented by heating to 94°C for 20 minutes, and spiked hybridization controls were added. Each sample was hybridized to one mouse 430A2 GeneChip (Affymetrix) according to manufacturer's protocols. Following overnight hybridization at 42°C, GeneChips underwent stringency washes in a Fluidics Station 400, then were scanned in the GeneChip Scanner 3000 to detect fluorescent hybridization signals. These were analysed by the Affymetrix GeneChip Operating System (GCOS) to generate an overall hybridization signal for each transcript from 11 representative perfect match and mismatch probe pairs.
Microarray data analysis
CEL files generated by GCOS were imported for further analysis into Array Assist software (Stratagene, La Jolla, USA), where probe level analysis was carried out using the GC Robust Multichip Average (GC-RMA) algorithm. Following GCRMA processing, data was filtered to remove those genes whose expression was at or around the background signal level of the chip. Any probe set that returned a signal of <50 on more than 3 chips at each time point was excluded from further analysis. This signal filter did not remove genes that were only expressed in one experimental group. Differential gene expression was determined using an unpaired t-test, to generate a list of genes that were significantly differentially expressed between transgenic mice and their wild type littermates, at each time point.
Gene ontology analysis
Gene Ontology (GO) terms that reflect the function of the corresponding genes are assigned to each probe set by Affymetrix software. This GO information was used to determine which functionally related groups of genes were over-represented amongst significantly differentially expressed genes at each time point. The frequencies of GO terms represented in the significant gene lists were compared to a denominator list of genes that can be expressed by motor neurones in health or disease. GO analysis was carried out without regard for fold change, in order to limit type II errors and in order to detect more subtle changes in gene expression, for example in transcriptional regulators, which may be biologically significant. The denominator list was generated from the array data for each time point, by extracting those genes whose representative probe sets returned a signal of >50 in 3 or more chips. Statistical analysis of GO term enrichment was carried out using DAVID software (NIAID/NIH; http://david.abcc.ncifcrf.gov/summary.jsp, [19]. Literature review was also used to identify significantly differentially expressed genes with functions relating to those identified as enriched by DAVID analysis.
Verification of microarray results by Quantitative rt-PCR (QPCR)
A proportion of genes identified as significantly differentially expressed were selected for verification by QPCR, on the basis of robust microarray data confirming differential gene expression, involvement in a biological process identified as enriched by GO analysis, or a known function in neurodegeneration. Verification addresses the possibility of false positive microarray signals, due to cross-hybridization with related genes, concern about the accuracy of array probe sets, and uncertainty about the hybridization kinetics of multiple reactions occurring on the miniature scale of an array chip. RNA was extracted from 1000-1500 cells, isolated by laser capture microdissection from the lumbar spinal cord of the population of mice used in the microarray experiment and, where available, a second population of transgenic mice with wild-type littermates. RNA was extracted, quantified as previously described, and reverse transcribed to cDNA using Superscript II reverse transcriptase, according to manufacturer's protocol (Invitrogen, San Diego, CA). Primers used in for verification are shown in Table 1. QPCR was performed using 12.5 ng cDNA, 1×SYBR Green PCR master mix (Applied Biosystems, Foster City, CA), and forward and reverse primers at optimized concentrations, to a total volume of 20 μl. After an initial denaturation at 95°C for 10 mins, templates were amplified by 40 cycles of 95°C for 15 secs and 60°C for 1 minute, on an MX3000P Real-Time PCR system (Stratagene). A dissociation curve was then generated to ensure amplification of a single product, and absence of primer dimers. For each primer pair, a standard curve was generated to determine the efficiency of the PCR reaction over a range of template concentrations from 0.3 ng/μl to 25 ng/μl, using cDNA synthesized from mouse universal RNA. The efficiency for each set of primers was 100+/-10%, such that gene expression values, normalized to ß-actin expression, could be determined using the ddCt calculation (ABI PRISM 7700 Sequence Detection System protocol; Applied Biosystems). An unpaired t-test was used to determine the statistical significance of any differences in gene expression. β-actin hybridization signals determined by microarray analysis confirmed that there was no significant difference in β-actin expression between wild type and transgenic mice. To determine the effect of the choice of the normalizing gene on the verification of microarray results by QPCR, the expression of four genes was also determined using two alternative normalizing genes, HspB8 and Nme1. These were identified by microarray analysis as having the most consistent levels of expression in spinal motor neurones at each time point, with the lowest coefficient of variation of hybridization signals.
Table 1.
Primer pairs used for QPCR experiments
| Gene symbol | Forward sequence | Reverse Sequence | Optimal primer conc F/R (fmol) |
|---|---|---|---|
| 3' Actin | GCTCTGGCTCCTAGCACCAT | AGCCACCGATCCACACAGAGT | 300/300 |
| HspB8 | GGGCCTGCTCATCATCGA | GAGGAAGCTCGTTGTTGAAGCT | 300/300 |
| Nme1 | CGCAGAACTGGATCTATGAGTGA | CCCCTGCCTGTGAGAACAA | 300/300 |
| Zfp101 | GGATGAAATCCTGTTCCCATACAT | TGTCCTGGATTAGATACTGTATTTTGATA | 900/900 |
| Fos | ATTGTCGAGGTGGTCTGAATGTT | AACGTTTTCATGGAAAACTGTTAATG | 300/300 |
| Rln | AAGCACTCGCAAACAAAATTACAT | CCTAAGCGACCTTCGTCTTCTG | 900/900 |
| HspA5 | CCTCAGAGTGGAGTTGAAAATGCTA | GACCCCAAGACATGTGAGCAA | 300/900 |
| Ldlr | ACCTGGCTCGGTTTTCATTCT | AGAGTATCACCCCAGCCTAACCT | 900/900 |
| Scd1 | GACCAGTCAAAGTGCAAGACTACCTA | AAGGTTTCCTGCAATGGTTTTC | 300/300 |
| Nrp1 | CGGTAACAACAGGAATCATGTACAA | TTACCCAAATGAAACCAAGAGAAGA | 300/300 |
| Mtap1B | CCGTTGCACCTTTCGTAGCT | AGCCAATGCAAGACAAAGGAA | 100/100 |
| Alcam | GGACACATATCTTGCCCAATCAG | ATCCTATGGTGCTCCTAACTCTCAA | 300/900 |
| HNRPDL | TTGTAAAAGACTTTGTACTCTAGATCAGAGA | TGGCAGCTATATAGACTTCCAGAGA | 300/900 |
| Tnrc6a | ATGTTGGACACCGTAACCTAAGC | TATGGACATCAACACACACCGAAT | 300/300 |
| VEGF | ATGCTCCCCGGGGTGTAT | CATAGGAGTCCTTCTGACCCATTC | 600/600 |
Neural VEGF quantitation
Ten 10 μm sections of cervical cord were taken from each mouse used in the microarray study. RNA was extracted using the PicoPure™ RNA isolation kit (Arcturus) and reverse transcribed to cDNA with Superscript II reverse transcriptase (Invitrogen), according to manufacturer's protocols. Neural VEGF expression was assessed by QPCR, as described above, normalized to the expression of ß-actin. Primer sequences and concentrations are shown in Table 1. VEGF expression was compared between VEGFδ/δ and wild-type mice using an unpaired t test.
Isolation of embryonic motor neurons and quantification of axonal outgrowth
Cultures of spinal motor neurons from E12.5 mice (VEGFwt/wt, n = 8; VEGFδ/wt, n = 14; and VEGFδ/δ, n = 4) were prepared by a panning technique using a monoclonal anti-p75NTR antibody (Millipore Bioscience Research Reagents)[20]. The ventrolateral parts of individual lumbar spinal cords were dissected and transferred to HBSS containing 10 mM 2-mercaptoethanol. After treatment with trypsin (0.05%, 10 min), single cell suspensions were generated by titration. The cells were plated on an anti-p75NTR coated culture dish (24 well; Greiner) and left at room temperature for 30 min. The individual wells were subsequently washed with HBSS (three times), and the attaching cells were then isolated from the plate with depolarizing saline (0.8% NaCl, 35 mM KCl, and 1 mM 2-mercaptoethanol) and plated at a density of 1500 cells per well on laminin-coated coverslips in Greiner four-well culture dishes. Motor neurons from single embryos were cultured for 7 days in quadruplicates in the presence of BDNF and CNTF (1 ng/ml each, 2000 cells/well initially). Surviving neurons were counted on day 0, 1 and day 7. Initial counting of plated cells was done when all cells were attached to the culture dish at 4 h after plating. At day 7, wells were fixed with fresh 4% paraformaldehyde in phosphate buffer and subjected to immunocytochemistry. Two coverslips with motor neurons of each embryo were stained with antibodies against MAP2 and P-Tau to distinguish between axons and dendrites. Axon lengths of VEGFwt/wt (n = 202), VEGFδ/wt, (n = 406) and VEGFδ/δ (n = 122) neurones were measured using the Leica Confocal Software (Leica, Germany), and compared using a t test.
Results
Neural VEGF expression
VEGFδ/δ mice used in this study showed a reduction in expression of VEGF mRNA in the cervical spinal cord of 33% compared to their wild type littermates (data not shown). A similar reduction in baseline spinal VEGF protein expression in the spinal cord, although not of mRNA expression, was described by Oosthuyse et al [1].
General features of differential gene expression between VEGFδ/δ and wild type mice
Between 15 and 18% of probe sets at each time point passed the signal filter, and their corresponding genes were considered expressed by motor neurones. Statistical analysis of these genes showed that 324 genes were significantly differentially expressed (at p < 0.05 level) between VEGFδ/δ and wild type mice at 3 months, 382 genes at 5 months, and 689 genes at late stage. The total numbers of genes which are upregulated and downregulated, with three different p values (0.05, 0.01 and 0.001) are given for each time point in Table 2. Prior to symptom onset, the majority of differentially expressed genes were upregulated. At disease onset, this pattern had reversed, and the majority of genes were significantly downregulated. At late stage disease there was marked transcriptional downregulation, shown in Figure 2. Fold changes between VEGFδ/δ mice and their littermates were, in general, smaller than those seen in parallel experimental design using the mutant SOD1 model of ALS [21].
Table 2.
Numbers of significantly differentially expressed genes at each time point
| 3 months | ALL FC | >1.5 | >2 | ||||
|---|---|---|---|---|---|---|---|
| PROBE SETS THAT PASS SIGNAL FILTER | UP | DOWN | UP | DOWN | UP | DOWN | |
| 6563 | p < 0.05 | 207 | 117 | 16 | 27 | 2 | 6 |
| p < 0.01 | 26 | 28 | 6 | 9 | 1 | 2 | |
| p < 0.001 | 3 | 7 | 2 | 2 | 1 | 1 | |
| 5 months | ALL FC | >1.5 | >2 | ||||
| PROBE SETS THAT PASS SIGNAL FILTER | UP | DOWN | UP | DOWN | UP | DOWN | |
| 7236 | p < 0.05 | 73 | 311 | 10 | 138 | 2 | 23 |
| p < 0.01 | 10 | 60 | 0 | 31 | 0 | 6 | |
| p < 0.001 | 1 | 5 | 0 | 3 | 0 | 1 | |
| 14 months | ALL FC | >1.5 | >2 | ||||
| PROBE SETS THAT PASS SIGNAL FILTER | UP | DOWN | UP | DOWN | UP | DOWN | |
| 8200 | p < 0.05 | 75 | 614 | 7 | 120 | 2 | 22 |
| p < 0.01 | 10 | 146 | 2 | 57 | 0 | 12 | |
| p < 0.001 | 1 | 22 | 0 | 9 | 0 | 2 | |
Figure 2.
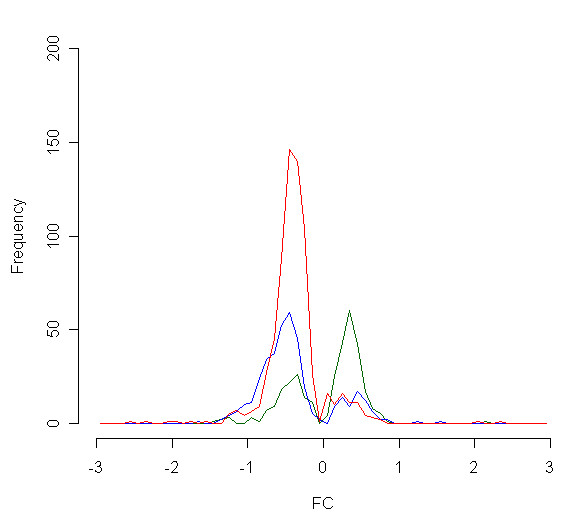
Histogram of fold change values of significantly differentially expressed genes at 3 months (green), 5 months (blue) and late stage (red). Upregulated genes are plotted on the positive axis, downregulated genes on the negative axis.
Gene ontology analysis
Gene ontology (GO) terms which were significantly enriched (at level p < 0.05) amongst genes significantly differentially expressed between transgenic and wild type mice were identified for each time point. Over-represented GO terms at each time point are given in Tables 3, 4 and 5. Four GO clusters were identified: Ontology terms concerned with mitochondrial function and energy production, with steroid metabolism, with axonogenesis and nervous system development, and with gene expression and RNA metabolism. There is overlap between GO terms enriched at 3 months and 5 months, and between 5 months and late stage disease, suggesting that the processes represented by these terms are affected in transgenic mice in a sequential manner, as disease progresses.
Table 3.
GO terms significantly enriched amongst differentially expressed genes at 3 months
| Gene ontology term | No. of genes | Fold Enrichment | p value |
|---|---|---|---|
| Energy production | |||
| tricarboxylic acid cycle intermediate metabolic process | 4 | 9.8 | 0.0066 |
| generation of precursor metabolites and energy | 18 | 1.9 | 0.0128 |
| Carbohydrate metabolic process | 14 | 1.8 | 0.0454 |
| Other | |||
| cardiac muscle cell differentiation | 3 | 12.7 | 0.0212 |
| striated muscle cell differentiation | 4 | 6.2 | 0.0246 |
| cardiac cell differentiation | 3 | 9.8 | 0.0348 |
| response to temperature stimulus | 4 | 4.9 | 0.0454 |
Table 4.
GO terms significantly enriched amongst differentially expressed genes at 5 months
| Gene ontology term | No. of genes | Fold Enrichment | p value |
|---|---|---|---|
| Nervous system development | |||
| axon extension | 6 | 8.1 | 0.0006 |
| cell part morphogenesis | 18 | 2.4 | 0.0010 |
| cell projection organization and biogenesis | 18 | 2.4 | 0.0010 |
| cell projection morphogenesis | 18 | 2.4 | 0.0010 |
| regulation of axon extension | 5 | 10.2 | 0.0010 |
| regulation of axonogenesis | 6 | 5.6 | 0.0035 |
| regulation of neurogenesis | 7 | 4.5 | 0.0040 |
| cellular morphogenesis during differentiation | 13 | 2.5 | 0.0055 |
| positive regulation of cell adhesion | 4 | 8.9 | 0.0087 |
| axonogenesis | 11 | 2.6 | 0.0090 |
| neurite development | 13 | 2.3 | 0.0093 |
| nervous system development | 27 | 1.7 | 0.0105 |
| cell morphogenesis | 23 | 1.7 | 0.0135 |
| cellular structure morphogenesis | 23 | 1.7 | 0.0135 |
| neurite morphogenesis | 11 | 2.4 | 0.0175 |
| neuron morphogenesis during differentiation | 11 | 2.4 | 0.0175 |
| neuron development | 13 | 2.1 | 0.0183 |
| microtubule-based process | 12 | 2.1 | 0.0249 |
| negative regulation of axon extension | 3 | 10.5 | 0.0304 |
| neuron differentiation | 14 | 1.9 | 0.0346 |
| negative regulation of neurogenesis | 4 | 5.4 | 0.0348 |
| Neurogenesis | 16 | 1.7 | 0.0403 |
| cell migration | 13 | 1.9 | 0.0413 |
| generation of neurons | 15 | 1.8 | 0.0457 |
| negative regulation of axonogenesis | 3 | 8.1 | 0.0493 |
| Cholesterol metabolism | |||
| cholesterol metabolic process | 7 | 3.9 | 0.0083 |
| steroid biosynthetic process | 8 | 4.3 | 0.0021 |
| sterol biosynthetic process | 6 | 5.9 | 0.0030 |
| sterol metabolic process | 8 | 3.9 | 0.0039 |
| steroid metabolic process | 10 | 2.9 | 0.0064 |
| cholesterol biosynthetic process | 5 | 6.1 | 0.0078 |
| RNA metabolism | |||
| nuclear mRNA splicing, via spliceosome | 7 | 3.4 | 0.0153 |
| RNA splicing, via transesterification reactions | 7 | 3.4 | 0.0153 |
| Energy production | |||
| generation of precursor metabolites and energy | 20 | 1.7 | 0.0282 |
| Other | |||
| protein import | 8 | 3.3 | 0.0106 |
| leukocyte migration | 4 | 8.1 | 0.0112 |
| protein import into nucleus | 7 | 3.6 | 0.0115 |
| leukocyte migration | 4 | 8.1 | 0.0112 |
| protein import into nucleus | 7 | 3.6 | 0.0115 |
| nuclear import | 7 | 3.5 | 0.0140 |
| nucleocytoplasmic transport | 9 | 2.5 | 0.0249 |
| feeding behaviour | 4 | 6.1 | 0.0253 |
| nuclear transport | 9 | 2.5 | 0.0265 |
| alcohol metabolic process | 14 | 1.9 | 0.0296 |
Table 5.
GO terms significantly enriched amongst differentially expressed genes at 14 months
| Gene ontology term | No. of genes | Fold Enrichment | p value |
|---|---|---|---|
| RNA metabolism and regulation of gene expression | |||
| protein-RNA complex assembly | 11 | 2.5 | 0.011 |
| mRNA metabolic process | 23 | 1.7 | 0.012 |
| mRNA processing | 21 | 1.8 | 0.014 |
| gene expression | 136 | 1.2 | 0.015 |
| RNA splicing | 18 | 1.8 | 0.018 |
| Regulation of gene expression | 98 | 1.2 | 0.024 |
| Regulation of transcription | 91 | 1.2 | 0.032 |
| regulation of nucleoside, nucleotide and nucleic acid metabolic process | 92 | 1.2 | 0.040 |
| transcription | 93 | 1.2 | 0.047 |
| negative regulation of gene expression, epigenetic | 4 | 4.7 | 0.048 |
| Nervous system development | |||
| neurite morphogenesis | 14 | 2.0 | 0.018 |
| neuron morphogenesis during differentiation | 14 | 2.0 | 0.018 |
| axonogenesis | 13 | 2.1 | 0.019 |
| neurite development | 15 | 1.8 | 0.037 |
| cellular morphogenesis during differentiation | 14 | 1.8 | 0.040 |
| neuron development | 16 | 1.7 | 0.045 |
| Other | |||
| nuclear export | 8 | 4.6 | 0.001 |
| protein export from nucleus | 5 | 6.9 | 0.004 |
| negative regulation of metabolic process | 23 | 1.6 | 0.029 |
| phosphatidylinositol metabolic process | 4 | 5.5 | 0.032 |
| nucleocytoplasmic transport | 11 | 2.1 | 0.034 |
| macromolecule biosynthetic process | 41 | 1.4 | 0.034 |
| nuclear transport | 11 | 2.1 | 0.036 |
| negative regulation of cellular metabolic process | 20 | 1.6 | 0.046 |
| phospholipid metabolic process | 11 | 2.0 | 0.047 |
| heme metabolic process | 4 | 4.7 | 0.048 |
Mitochondrial function and energy production
In presymptomatic mice, fewer transcriptional changes were seen in transgenic mice, compared to their wild-type littermates than at the other time points of disease. The most significantly over-represented GO terms related to cellular energy production (TCA cycle metabolism, generation of precursor metabolites and energy and carbohydrate metabolism). The differentially expressed genes included several genes encoding TCA cycle enzymes and components of the electron transport chain (Table 6). Three genes encoding TCA cycle enzymes, Mdh2, Ldh2 and Oxct1, are upregulated, while Ldh1, an isoform that favours glycolysis over oxidative metabolism [22], is downregulated. In the electron transport chain, genes that produce components of 4 out of the 5 complexes, and Pcdc8, which is required for mitochondrial oxidative phosphorylation [23], show upregulation (Figure 3). These gene expression changes would be consistent with a small but significant increase in oxidative metabolism in neurones of VEGFδ/δ mice in the early stages of disease. Concomitant with this increase, there was upregulation of the free radical scavenging enzymes, Prdx2 and Sod2.
Table 6.
Differentially regulated genes involved in cellular energy production at 3 months
| Probe ID | Gene title | Symbol | p value | FC | Regn |
|---|---|---|---|---|---|
| Electron transport chain | |||||
| 1438159 | NADH dehydrogenase (ubiquinone) flavoprotein 2 | Ndufv2 | 0.0330 | 1.15 | up |
| 1435757 | Ubiquinol cytochrome C reductase core protein 2 | Uqcrc2 | 0.0066 | 1.21 | up |
| 1456588 | Cytochrome c oxidase, subunit Vb | Cox5b | 0.0460 | 1.16 | up |
| 1450561 | Surfeit gene 1 | Surf1 | 0.0187 | 1.16 | up |
| 1449710 | ATP synthase H+ transporting, mitochondrial F1 complex, α subunit, isoform 1 | Atp5a1 | 0.0216 | 1.09 | up |
| 1454661 | ATP synthase H+ transporting, mitochondrial F0 complex, subunit c, isoform 3 | Atp5g3 | 0.0309 | 1.06 | up |
| 1418127 | Programmed cell death 8 (Apoptosis inducing factor) | Pcdc8 | 0.0185 | 1.26 | up |
| TCA cycle | |||||
| 1419737 | Lactate dehydrogenase 1, A chain | Ldh1 | 0.0077 | 1.86 | down |
| 1433984 | Malate dehydrogenase 2, NAD | Mdh2 | 0.0188 | 1.16 | up |
| 1455235 | Lactate dehydrogenase 2, B chain | Ldh2 | 0.0216 | 1.12 | up |
| 1436750 | 3-oxoacid CoA transferase1 | Oxct1 | 0.0441 | 1.30 | up |
| Free radical scavenging | |||||
| 1430979 | Peroxiredoxin 2 | Prdx2 | 0.0397 | 1.27 | up |
| 1444531 | Superoxide dismutase 2, mitochondrial | Sod2 | 0.0417 | 1.20 | up |
Figure 3.
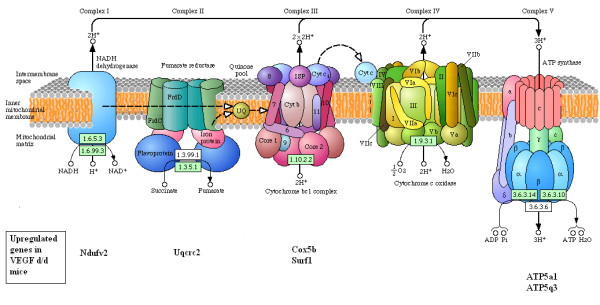
Diagrammatic representation of the components of the mitochondrial electron transport chain, and the constituent proteins encoded by genes significantly upregulated in VEGFδ/δ mice.
Cholesterol metabolism
At disease onset, there was enrichment of genes assigned GO terms relating to steroid metabolism, all of which were downregulated (Table 7). These included five genes that catalyse reactions in the final committed pathway to cholesterol synthesis pathway (Figure 4). Sqle is a rate limiting step in this pathway [24]. Prkaa2 is a catalytic subunit of AMPK, which regulates HMG CoA reductase activity. Ldlr and Sorl1 have similar functions in binding LDL, the major cholesterol carrying lipoprotein of plasma, and transporting it into cells. Hsd17b7 catalyses the synthesis of steroid hormones from cholesterol, while Stard4 promotes transport of cholesterol across the mitochondrial membrane, and stimulates steroidogenesis [25]. Nr3c1 is the glucocorticoid receptor.
Table 7.
Differentially expressed genes in the category of 'Steroid metabolism' at 5 months
| Probe ID | Gene Title | Symbol | p value | FC | Regn |
|---|---|---|---|---|---|
| 1416222 | NAD(P) dependent steroid dehydrogenase-like | Nsdhl | 0.0372 | 1.77 | down |
| 1421821 | low density lipoprotein receptor | Ldlr | 0.0172 | 2.13 | down |
| 1422185 | cytochrome b5 reductase 3 | Cyb5r3 | 0.0248 | 2.24 | down |
| 1423078 | sterol-C4-methyl oxidase-like | Sc4mol | 0.0161 | 2.10 | down |
| 1429240 | StAR-related lipid transfer (START) domain containing 4 | Stard4 | 0.0044 | 1.83 | down |
| 1438322 | farnesyl diphosphate farnesyl transferase 1 | Fdft1 | 0.0442 | 1.56 | down |
| 1448130 | farnesyl diphosphate farnesyl transferase 1 | Fdft1 | 0.0323 | 1.86 | down |
| 1457248 | hydroxysteroid (17-beta) dehydrogenase 7 | Hsd17b7 | 0.0250 | 1.74 | down |
| 1460390 | sortilin-related receptor, LDLR class A | Sorl1 | 0.0499 | 1.33 | down |
| 1415993 | squalene epoxidase | Sqle | 0.0204 | 1.97 | down |
Figure 4.
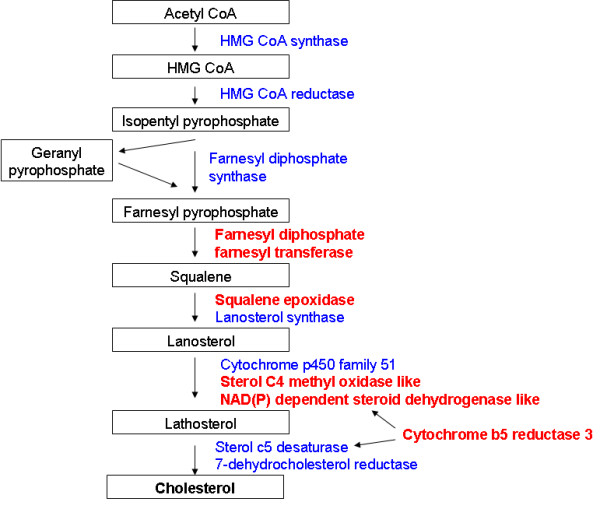
Schematic representation of the cholesterol biosynthesis pathway, with genes that are differentially regulated in VEGFδ/δ mice at 5 months highlighted in red. Cytochrome B5 reductase is an electron carrier for 5-desaturase and methyl sterol oxidase [119]
Nervous system development
At all stages of disease, there was differential expression of genes involved in nervous system development, with prominent enrichment of GO terms relating to nervous system development in the significant gene lists at both 5 months and 14 months. Genes with functions relating to nervous system development at these time points, the majority of which are downregulated, are shown in Table 8 and Figure 5. Several are identified by more than one probe set or at more than one time point.
Table 8.
Differentially expressed genes in the category of 'Nervous system development'
| Probe ID | Gene Title | Symbol | p value | FC | Regn | Time point |
|---|---|---|---|---|---|---|
| Neurite outgrowth | ||||||
| 1428393 | neuritin 1 | Nrn1 | 0.0090 | 3.82 | down | 14 months |
| 1428089 | SLIT and NTRK-like family, member 1 | Slitrk1 | 0.0156 | 1.35 | down | 5 months |
| 1416666 | serine peptidase inhibitor, clade E, member 2 | Serpine2 | 0.0414 | 1.65 | down | 5 months |
| 1437308 | coagulation factor II (thrombin) receptor | F2r | 0.0346 | 1.59 | up | 3 months |
| 1437308 | coagulation factor II (thrombin) receptor | F2r | 0.0286 | 1.22 | up | 5 months |
| 1455252 | tuberous sclerosis 1 | Tsc1 | 0.0073 | 1.37 | up | 5 months |
| 1422600 | RAS protein-specific guanine nucleotide-releasing factor 1 | Rasgrf1 | 0.0011 | 1.63 | down | 14 months |
| 1435614 | RAS protein-specific guanine nucleotide-releasing factor 1 | Rasgrf1 | 0.0002 | 1.44 | down | 14 months |
| 1455027 | RUN and FYVE domain containing 2 | Rufy3 | 0.0360 | 1.43 | down | 5 months |
| 1424402 | RUN and FYVE domain containing 2 | Rufy3 | 0.0382 | 1.32 | down | 5 months |
| 1452342 | amyloid beta precursor protein-binding, family B, member 2 | Apbb2 | 0.0415 | 1.21 | down | 14 months |
| 1449439 | Kruppel-like factor 7 (ubiquitous) | Klf7 | 0.0008 | 1.62 | down | 5 months |
| Growth factor signalling pathways | ||||||
| 1420838 | neurotrophic tyrosine kinase, receptor, type 2 | Ntrk2 | 0.0067 | 1.29 | down | 5 months |
| 1418057 | T-cell lymphoma invasion and metastasis 1 | Tiam1 | 0.0006 | 1.66 | down | 5 months |
| 1418057 | T-cell lymphoma invasion and metastasis 1 | Tiam1 | 0.0031 | 1.43 | down | 14 months |
| 1439015 | glial cell line derived neurotrophic factor receptor alpha 1 | Gfra1 | 0.0454 | 1.95 | down | 5 months |
| 1455018 | lemur tyrosine kinase 2 | Lmtk2 | 0.0107 | 1.32 | down | 14 months |
| TGFß signalling pathway | ||||||
| 1450923 | transforming growth factor, beta 2 | Tgfb2 | 0.0397 | 1.47 | down | 5 months |
| 1450839 | DNA segment, human D4S114 | D0H4S114 | 0.0093 | 2.00 | down | 3 months |
| 1450839 | DNA segment, human D4S114 | D0H4S114 | 0.0190 | 1.98 | down | 5 months |
| 1450839 | DNA segment, human D4S114 | D0H4S114 | 0.0025 | 1.50 | down | 14 months |
| 1422487 | MAD homolog 4 (Drosophila) | Smad4 | 0.0368 | 1.41 | down | 5 months |
| 1452143 | spectrin beta 2 | Spnb2 | 0.0023 | 1.21 | down | 5 months |
| 1425116 | spectrin beta 4 | Spnb4 | 0.0463 | 1.14 | up | 14 months |
| Rho-GTPase pathway | ||||||
| 1416329 | cytoplasmic FMR1 interacting protein 1 | Cyfip1 | 0.0158 | 1.36 | down | 5 months |
| 1448600 | vav 3 oncogene | Vav3 | 0.0304 | 1.32 | down | 5 months |
| Microtubule-based processes | ||||||
| 1455719 | tubulin, beta 5 | Tubb5 | 0.0034 | 1.60 | down | 5 months |
| 1421851 | microtubule-associated protein 1 B | Mtap1b | 0.0142 | 2.10 | down | 5 months |
| 1457316 | microtubule-associated protein 6 | Mtap6 | 0.0105 | 1.75 | down | 5 months |
| 1424719 | microtubule-associated protein tau | Mapt | 0.0482 | 1.50 | down | 5 months |
| 1417005 | kinesin 2 | Kns2 | 0.0484 | 1.17 | down | 5 months |
| 1433926 | dynein, cytoplasmic, light intermediate chain 2 | Dnclic2 | 0.0121 | 1.36 | down | 5 months |
| 1437875 | bicaudal D homolog 2 | Bicd2 | 0.0236 | 1.45 | down | 5 months |
| 1451630 | tubulin tyrosine ligase | Ttl | 0.0016 | 1.45 | down | 5 months |
| 1428282 | tubulin-specific chaperone e | Tbce | 0.0348 | 1.24 | down | 14 months |
| 1423626 | dystonin | Dst | 0.0358 | 1.24 | down | 5 months |
| Axon guidance | ||||||
| 1418084 | neuropilin 1 | Nrp1 | 0.0092 | 2.02 | down | 5 months |
| 1448944 | neuropilin 1 | Nrp1 | 0.0151 | 1.58 | down | 5 months |
| 1456778 | neuropilin 2 | Nrp2 | 0.0020 | 1.28 | down | 5 months |
| 1420416 | semaphorin 3A | Sema3a | 0.0010 | 1.35 | down | 5 months |
| 1420416 | semaphorin 3A | Sema3a | 0.0341 | 1.26 | down | 14 months |
| 1415877 | dihydropyrimidinase-like 3 | Dpysl3 | 0.0461 | 2.25 | down | 5 months |
| 1450863 | double cortin and calcium/calmodulin-dependent protein kinase-like 1 | Dcamkl1 | 0.0364 | 1.29 | down | 5 months |
| Synapse formation and plasticity | ||||||
| 1427898 | ring finger protein (C3H2C3 type) 6 | Rnf6 | 0.0182 | 1.59 | down | 5 months |
| 1452004 | calcitonin-related polypeptide, alpha | Calca | 0.0283 | 1.26 | down | 5 months |
| 1422639 | calcitonin-related polypeptide, beta | Calcb | 0.0389 | 1.78 | down | 5 months |
| 1449465 | reelin | Reln | 0.0006 | 2.38 | down | 3 months |
| 1423100 | FBJ osteosarcoma oncogene | Fos | 0.0313 | 2.32 | down | 3 months |
| 1423100 | FBJ osteosarcoma oncogene | Fos | 0.0123 | 2.17 | down | 5 months |
| 1452901 | cAMP responsive element binding protein 1 | Creb1 | 0.0148 | 1.44 | down | 14 months |
| Wingless signalling pathway | ||||||
| 1437301 | dishevelled, dsh homolog 1 (Drosophila) | Dvl1 | 0.0166 | 1.38 | down | 14 months |
| 1434439 | glycogen synthase kinase 3 beta | Gsk3b | 0.0023 | 1.23 | down | 14 months |
| 1437351 | CXXC finger 4 | Cxxc4 | 0.0462 | 1.37 | down | 5 months |
| 1437351 | CXXC finger 4 | Cxxc4 | 0.0341 | 1.30 | down | 14 months |
| Cell adhesion molecules | ||||||
| 1437466 | activated leukocyte cell adhesion molecule | Alcam | 0.0329 | 1.94 | down | 5 months |
| 1437467 | activated leukocyte cell adhesion molecule | Alcam | 0.0233 | 1.60 | down | 5 months |
| 1437466 | activated leukocyte cell adhesion molecule | Alcam | 0.0400 | 1.65 | down | 14 months |
| 1426301 | activated leukocyte cell adhesion molecule | Alcam | 0.0045 | 1.51 | down | 14 months |
| 1437467 | activated leukocyte cell adhesion molecule | Alcam | 0.0414 | 1.50 | down | 14 months |
| 1416034 | CD24a antigen | Cd24a | 0.0165 | 1.96 | down | 5 months |
| 1416891 | numb gene homolog (Drosophila) | Numb | 0.0394 | 1.45 | down | 14 months |
| 1424954 | phosphatidylinositol-4-phosphate 5-kinase, type 1 gamma | Pip5k1c | 0.0166 | 1.14 | down | 14 months |
| 1418615 | astrotactin 1 | Astn1 | 0.0461 | 1.65 | down | 5 months |
| 1416474 | immunoglobulin superfamily, DCC subclass, member 4 | Igdcc4 | 0.0342 | 1.19 | down | 5 months |
| 1449286 | netrin G1 | Ntng1 | 0.0119 | 1.87 | down | 14 months |
| 1442659 | protocadherin 9 | Pcdh9 | 0.0166 | 1.64 | down | 14 months |
| 1420429 | protocadherin beta 3 | Pcdhb3 | 0.0365 | 1.89 | down | 14 months |
| 1425092 | cadherin 10 | Cdh10 | 0.0208 | 1.39 | down | 14 months |
| 1433788 | neurexin III | Nrxn3 | 0.0021 | 1.78 | down | 14 months |
| 1422798 | contactin associated protein-like 2 | Cntnap2 | 0.0077 | 1.37 | down | 5 months |
| 1417378 | synaptic cell adhesion molecule | Syncam | 0.0400 | 1.40 | down | 14 months |
| 1417377 | synaptic cell adhesion molecule | Syncam | 0.0191 | 1.38 | down | 14 months |
| 1422445 | integrin alpha 6 | Itga6 | 0.0221 | 1.50 | down | 5 months |
| Others | ||||||
| 1457015 | Neurofilament 3, medium | Nef3 | 0.0209 | 1.40 | up | 14 months |
| 1416533 | EGL nine homolog 2 | Egln2 | 0.0203 | 1.46 | down | 5 months |
| 1420475 | myotrophin | Mtpn | 0.0120 | 1.67 | down | 5 months |
| 1417133 | peripheral myelin protein | Pmp22 | 0.0159 | 1.89 | down | 5 months |
| 1449353 | wild-type p53-induced gene 1 | Wig1 | 0.0249 | 1.57 | down | 5 months |
| 1417624 | Ngfi-A binding protein 1 | Nab1 | 0.0119 | 1.44 | down | 5 months |
Figure 5.
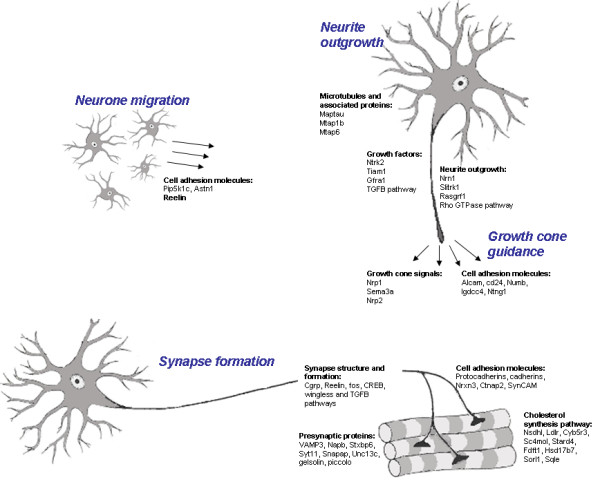
Schematic representation of genes involved in neuronal migration, neurite outgrowth and formation and maintenance of the neuromuscular junction, which are all downregulated in the VEGF transgenic mouse.
There is downregulation in VEGFδ/δ mice of genes that promote neurite outgrowth, such as Nrn1 [26], Slitrk1 [27], RasGrf1[28] and Serpine2, which is an inhibitor of thrombin [29]. Thrombin causes neurite retraction and neuronal death via its receptor F2r, which is upregulated at 3 and 5 months [30]. Tsc1, which inhibits axon growth, is also upregulated at both time points [31]. Growth factors such and NGF, BDNF, GDNF and TGFß2 promote neuronal differentiation and outgrowth [32,33], There is downregulation in motor neurones of VEGFδ/δ mice of the BDNF receptor, Ntrk2, and its downstream mediator, Tiam1 [34]; the GDNF receptor, Gfra1; several components of the TGFß2 signaling pathway; and Lmtk2, a mediator of NGF signalling [35]. Rufy3 is implicated in the formation of a single axon, to determine neuronal polarity [36]. Apbb2 interacts with amyloid precursor protein, which is required for the maintenance of dendrites and synapses [37]. KLF7 is a transcription factor with a key role in neuronal morphogenesis. Null mutations in Klf7 lead to deficits in neuronal outgrowth and axon guidance [38]. The Rho GTPase pathway controls cytoskeletal reorganization to regulate neurone outgrowth, and the maturation and maintenance of dendritic spines. The Rho GTPase, Rac, is activated by vav3 [39]. Cyfip1 interacts with Rac and null mutations lead to defects in axon growth, guidance and branching, and in the organization of the neuromuscular junction [40].
The GO category 'microtubule-based process' is over-represented at 5 months, with downregulation of genes that are assigned this function. Microtubules are prominent elements of the neuronal cytoskeleton, involved in the growth and maintenance of neurites, and along which motor proteins move. Microtubule associated proteins bind to the tubulin substrate that make up microtubules, and regulate their stability [41]. Tubulin ß5 and three microtubule associated proteins, Maptau, Mtap1b and Mtap6, are downregulated in VEGFδ/δ mice, as are two motor proteins, kinesin 2 and Dnclic2, and BICD2 which binds cargoes to dynein. Disruption of the dynein-dynactin pathway through prevention of BICD2 uncoupling causes motor neurone degeneration in mice [42]. Ttl causes post-translational modifications of αtubulin that are essential to neurite extension and normal brain development [43]. Tbce is a tubulin chaperone, required for stabilization of neuronal processes, a mutation of which causes the progressive motor neuronopathy of the pmn mouse [44]. Dystonin is thought to have a role in cytoskeletal cross-linking leading to axonal stability [45].
Differentially expressed genes in the VEGFδ/δ model encode a number of proteins that mediate attractive and repulsive growth cone signals during axonal guidance, including Nrp1 and its ligand sema3A [46] and Nrp2 [47]. Two downregulated genes have regulatory functions in the growth cone tip: Dpysl3 and DCAMKII [48,49].
Cellular adhesion molecules are important in contact-dependent regulation of axonal growth, and in the control of neuronal migration. Fourteen adhesion molecules and related molecules are downregulated in the VEGFδ/δ mouse. Alcam is a member of the immunoglobulin superfamily which has a specific role in the guidance of motor axons and formation of neuromuscular junctions (NMJs) [50]. Both L1 and cd24 interact and cooperate with each other as potent stimulators of neurite outgrowth [51]. Cd24, and Numb, which mediates endocytosis of the cell-adhesion molecule L1 [52] are downregulated in VEGFδ/δ mice. The DCC (deleted in colon cancer) subgroup of the immunoglobulin superfamily are ligands for netrin, with roles in the migration and guidance of axonal growth cones. Igdcc4 is a newly recognized member of this group, which is downregulated at 5 months [53], as is the netrin Ntng1[54]. Both Pip5k1c and Astn1 are required for normal neurone migration [55,56].
The formation of synapses involves guidance of axonal processes towards target cells, target recognition, followed by recruitment of pre- and post-synaptic elements. The synaptic connections between motor neurones and muscle exhibit both functional and anatomical plasticity after maturation, with changes in synaptic strength, and the formation and retraction of neuronal sprouts from synaptic terminals or Nodes of Ranvier. This enables the neuromuscular system to compensate for growth, changes in muscle use, and damage or disease [57]. Adhesion molecules play a central role in the formation and plasticity of synapses, several of which are downregulated in the VEGFδ/δ mouse, including two protocadherins; cadherin 10 [58,59]; two members of the neurexin family, Nrxn3 and Cntnap2, which bind postsynaptic neuroligins [60,61]; and SynCAM, a member of the immunoglobulin superfamily. Rnf6 binds to LIM kinase 1, which regulates actin dynamics and is important in determining synaptic structure [62]. Calcitonin-gene-related peptide, of which both polypeptide chains are downregulated in the VEGFδ/δ mouse, is released from motor neurones to stimulate acetylcholine receptor synthesis by muscle, at the NMJ [63]. Reelin is an extracellular matrix protein with a well-recognized function in neuronal migration. More recently, it has been shown to play a role in synaptic plasticity [64], and in the maturation of synaptic contacts during development, by refinement of NMDA-receptor subunit composition [65]. The activation of downstream signalling pathways of reelin is cholesterol-dependent [66]. Fos and Jun form the heterodimer, AP-1, which plays a central role in controlling development, growth, survival and plasticity of neurones. AP-1 has also been shown to positively regulate synapse strength and number, acting upstream of CREB [67]. Both Fos and CREB are downregulated in the VEGFδ/δ mouse.
Proteins of the canonical wingless signalling pathway participate in the assembly of the NMJ, with crucial components being the wingless co-receptor, arrow, Dishevelled and GSK3ß. GSK3ß functions by regulating the structure of the microtubule cytoskeleton, probably via the microtubule-associated protein, MAP1B. Mutations in this pathway cause aberrant NMJ formation, with reduction in number of synaptic boutons [68]. Dishevelled, GSK3ß and MAP1B are downregulated in the VEGFδ/δ model, as is CXXC4 which regulates the wnt-dishevelled signalling pathway [69]. TGFß also plays role in the development and functioning of synapses [70]. There is downregulation in the VEGFδ/δ mouse of TGFß2; D0H4S114, which regulates TGF signalling [71]; Smad4 and ß-spectrin at disease onset, which associate in response to TGFß, and are required for the assembly of the NMJ [72,73].
Pre-synaptic proteins
Concomitant with the downregulation of genes involved in the formation and morphological plasticity of synapses, a reduction was seen in the expression of several genes encoding proteins that comprise the pre-synaptic machinery (Table 9), including several genes involved in the fusion of synaptic vesicles, which is mediated by the SNARE complex of VAMP/synaptobrevin, syntaxin and SNAP25. Both VAMP3 and Napb were downregulated in VEGFδ/δ mice, as was the syntaxin-binding protein, Stxbp6; SytI1, one of a family of calcium-binding proteins that need to be bound to the SNARE complex for pore opening to occur; the SNAP associated protein, Snapap, which enhances association of synaptotagmin with the SNARE complex [74]; Unc13C which binds to and activates syntaxin [75]; gelsolin which disassembles the actin network to liberate synaptic vesicles for release [76]; piccolo, which is a scaffolding protein involved in the organization of synaptic active zones, where synaptic vesicles dock and fuse [77]; and synapsins I and II, which modulate neurotransmitter release, possibly by maintaining a pool of synaptic vesicles near to the active zone [78]. PPI controls activity of ion channels and signal transduction enzymes to determine functional synaptic plasticity, and downregulation of several of its regulatory and catalytic subunits was seen, in addition to Phactr1 and 2, which regulate PPI activity [79].
Table 9.
Genes encoding presynaptic proteins, differentially expressed in VEGFδ/δ mice
| Probe ID | Gene name | Symbol | p value | FC | Reg | Time point |
|---|---|---|---|---|---|---|
| 1456245 | vesicle-associated membrane protein 3 | Vamp3 | 0.0159 | 1.47 | down | 14 months |
| 1423173 | N-ethylmaleimide sensitive fusion protein ß | Napb | 0.0021 | 1.59 | down | 14 months |
| 1423172 | N-ethylmaleimide sensitive fusion protein ß | Napb | 0.0024 | 1.55 | down | 14 months |
| 1433788 | N-ethylmaleimide sensitive fusion protein ß | Napb | 0.0021 | 1.78 | down | 14 months |
| 1435396 | syntaxin binding protein 6 | Stxbp6 | 0.0290 | 1.46 | down | 5 months |
| 1435396 | syntaxin binding protein 6 | Stxbp6 | 0.0179 | 1.33 | down | 14 months |
| 1429314 | synaptotagmin XI | Syt11 | 0.0274 | 1.47 | down | 5 months |
| 1415756 | SNAP-associated protein | Snapap | 0.0058 | 1.70 | down | 5 months |
| 1455304 | unc-13 homolog C | Unc13c | 0.0070 | 2.86 | down | 14 months |
| 1436991 | gelsolin | Gsn | 0.0092 | 1.62 | down | 5 months |
| 1419392 | piccolo | Pclo | 0.0267 | 1.47 | down | 14 months |
| 1451484 | synapsin I | Syn1 | 0.0098 | 1.49 | down | 5 months |
| 1435511 | synapsin II | Syn2 | 0.0146 | 1.74 | down | 5 months |
| 1435667 | regulating synaptic membrane exocytosis 1 | Rims1 | 0.0370 | 1.32 | up | 3 months |
| 1422880 | synaptophysin-like protein | Sypl | 0.0384 | 1.15 | down | 3 months |
| 1417919 | protein phosphatase 1, regulatory subunit 7 | Ppp1r7 | 0.0256 | 1.30 | down | 5 months |
| 1433691 | protein phosphatase 1, regulatory subunit 3C | Ppp1r3c | 0.0218 | 1.49 | down | 5 months |
| 1440285 | protein phosphatase 1, regulatory subunit 9A | Ppp1r9a | 0.0063 | 1.24 | down | 5 months |
| 1452046 | protein phosphatase 1, catalytic subunit, gamma | Ppp1cc | 0.0276 | 1.38 | down | 5 months |
| 1434895 | protein phosphatase 1, regulatory subunit 13B | Ppp1r13b | 0.0280 | 1.32 | down | 14 months |
| 1456072 | protein phosphatase 1, regulatory subunit 9A | Ppp1r9a | 0.0217 | 1.32 | down | 14 months |
| 1440285 | protein phosphatase 1, regulatory subunit 9A | Ppp1r9a | 0.0304 | 1.22 | down | 14 months |
| 1420734 | protein phosphatase 1, regulatory subunit 3F | Ppp1r3f | 0.0102 | 1.17 | down | 14 months |
| 1456606 | phosphatase and actin regulator 1 | Phactr1 | 0.0196 | 1.35 | down | 5 months |
| 1455101 | phosphatase and actin regulator 2 | Phactr2 | 0.0489 | 1.66 | down | 5 months |
| 1455101 | phosphatase and actin regulator 2 | Phactr2 | 0.0463 | 1.41 | down | 14 months |
RNA processing
At late stage disease, GO terms related to gene expression and its regulation are enriched amongst significantly differentially expressed genes, including the sub-categories of mRNA metabolism and processing, and RNA splicing (Table 10). Of the 651 named genes differentially expressed at 14 months, 143 (22%) have functions relating to gene expression, and of these, 132 (92%) are downregulated. This finding is interesting in light of the massive transcriptional downregulation seen at late stage disease.
Table 10.
Differentially expressed genes in the category 'Gene expression'
| Probe ID | Gene Title | Symbol | p value | FC | Regn |
|---|---|---|---|---|---|
| 1437984 | HLA-B-associated transcript 1A | Bat1a | 0.0101 | 1.18 | down |
| 1436549 | heterogeneous nuclear ribonucleoprotein A1 | Hnrpa1 | 0.0354 | 1.30 | down |
| 1452712 | heterogeneous nuclear ribonucleoprotein A3 | Hnrpa3 | 0.0176 | 1.47 | down |
| 1423873 | LSM1 homolog, U6 small nuclear RNA associated | Lsm1 | 0.0450 | 1.19 | down |
| 1434704 | myeloid/lymphoid or mixed-lineage leukaemia 5 | Mll5 | 0.0024 | 1.66 | down |
| 1424136 | peptidyl prolyl isomerase H | Ppih | 0.0123 | 1.40 | down |
| 1451909 | PRP4 pre-mRNA processing factor 4 homolog B | Prpf4b | 0.0366 | 1.38 | down |
| 1438420 | RNA-binding region (RNP1, RRM) containing 2 | Rnpc2 | 0.0004 | 1.76 | down |
| 1459765 | splicing factor 1 | Sf1 | 0.0405 | 1.34 | down |
| 1436898 | splicing factor proline/glutamine rich | Sfpq | 0.0101 | 1.88 | down |
| 1416151 | splicing factor, arginine/serine-rich 3 | Sfrs3 | 0.0305 | 1.24 | down |
| 1423130 | splicing factor, arginine/serine-rich 5 | Sfrs5 | 0.0494 | 1.59 | down |
| 1416721 | splicing factor, arginine/serine-rich 6 | Sfrs6 | 0.0232 | 1.26 | down |
| 1424033 | splicing factor, arginine/serine-rich 7 | Sfrs7 | 0.0264 | 1.30 | down |
| 1437180 | small nuclear ribonucleoprotein 48 | Snrnp48 | 0.0285 | 1.68 | down |
| 1437007 | ubiquitin specific peptidase 39 | Usp39 | 0.0047 | 1.33 | down |
| 1450845 | basic leucine zipper and W2 domains 1 | Bzw1 | 0.0269 | 1.27 | up |
| 1437841 | cold shock domain containing C2, RNA binding | Csdc2 | 0.0130 | 1.43 | up |
| 1415920 | cleavage stimulation factor, 3' pre-RNA subunit 2, tau | Cstf2t | 0.0092 | 1.27 | down |
| 1437071 | eukaryotic translation initiation factor 1A, Y-linked | Eif1ay | 0.0281 | 1.21 | down |
| 1434538 | eukaryotic translation initiation factor 2B, subunit 2 beta | Eif2b2 | 0.0149 | 1.23 | down |
| 1454664 | eukaryotic translation initiation factor 5 | Eif5 | 0.0439 | 1.12 | down |
| 1424252 | heterogeneous nuclear ribonucleoprotein D-like | Hnrpdl | 0.0046 | 2.20 | down |
| 1415911 | imprinted and ancient | Impact | 0.0009 | 1.47 | down |
| 1451125 | poly(A) binding protein interacting protein 2B | Paip2b | 0.0327 | 1.14 | down |
| 1424216 | poly (A) polymerase alpha | Papola | 0.0286 | 1.55 | down |
| 1427544 | poly (A) polymerase alpha | Papola | 0.0305 | 1.22 | down |
| 1436586 | ribosomal protein S14 | Rps14 | 0.0321 | 1.25 | down |
| 1416065 | ankyrin repeat domain 10 | Ankrd10 | 0.0494 | 1.27 | down |
| 1435307 | ankyrin repeat domain 34B | Ankrd34B | 0.0154 | 5.84 | down |
| 1452342 | amyloid beta (A4) precursor protein-binding, family B, member 2 | Apbb2 | 0.0415 | 1.21 | down |
| 1455647 | androgen receptor | Ar | 0.0248 | 1.30 | down |
| 1420985 | ash1 (absent, small, or homeotic)-like | Ash1l | 0.0413 | 1.23 | down |
| 1450072 | ash1 (absent, small, or homeotic)-like | Ash1l | 0.0416 | 1.22 | down |
| 1449947 | AT motif binding factor 1 | Atbf1 | 0.0213 | 1.49 | down |
| 1438992 | activating transcription factor 4 | Atf4 | 0.0069 | 1.35 | down |
| 1418271 | basic helix-loop-helix domain containing, class B5 | Bhlhb5 | 0.0456 | 1.69 | down |
| 1452850 | breast cancer metastasis-suppressor 1-like | Brms1l | 0.0371 | 1.28 | down |
| 1435445 | cyclin T2 | Ccnt2 | 0.0159 | 1.52 | down |
| 1420497 | CCAAT/enhancer binding protein zeta | Cebpz | 0.0435 | 1.28 | down |
| 1454641 | CGG triplet repeat binding protein 1 | Cggbp1 | 0.0063 | 1.42 | down |
| 1434002 | checkpoint supressor 1 | Ches1 | 0.0452 | 1.37 | down |
| 1438255 | checkpoint supressor 1 | Ches1 | 0.0459 | 1.41 | down |
| 1436980 | CCR4-NOT transcription complex, subunit 2 | Cnot2 | 0.0089 | 1.36 | down |
| 1456576 | CCR4-NOT transcription complex, subunit 2 | Cnot2 | 0.0046 | 1.31 | down |
| 1437982 | COX15 homolog, cytochrome c oxidase assembly protein | Cox15 | 0.0406 | 1.14 | up |
| 1452901 | cAMP responsive element binding protein 1 | Creb1 | 0.0148 | 1.44 | down |
| 1436983 | CREB binding protein | Crebbp | 0.0428 | 1.23 | down |
| 1452857 | CREB/ATF bZIP transcription factor | Crebzf | 0.0245 | 1.45 | down |
| 1454931 | CREBBP/EP300 inhibitory protein 2 | Cri2 | 0.0384 | 1.24 | down |
| 1429618 | cylindromatosis (turban tumor syndrome) | Cyld | 0.0025 | 1.55 | down |
| 1448234 | DnaJ (Hsp40) homolog, subfamily B, member 6 | Dnajb6 | 0.0214 | 1.23 | down |
| 1459805 | dihydrouridine synthase 3-like | Dus3l | 0.0103 | 1.39 | down |
| 1418850 | enhancer of polycomb homolog 1 | Epc1 | 0.0133 | 1.23 | down |
| 1455267 | estrogen-related receptor gamma | Esrrg | 0.0026 | 1.50 | down |
| 1456615 | fetal Alzheimer antigen | Falz | 0.0130 | 1.33 | down |
| 1423709 | phenylalanine-tRNA synthetase-like, beta subunit | Farslb | 0.0270 | 1.34 | down |
| 1459861 | F-box and leucine-rich repeat protein 10 | Fbxl10 | 0.0052 | 1.32 | down |
| 1428890 | fem-1 homolog c | Fem1c | 0.0498 | 1.22 | down |
| 1417113 | germ cell-less homolog | Gcl | 0.0341 | 1.31 | down |
| 1424296 | glutamate-cysteine ligase, catalytic subunit | Gclc | 0.0143 | 1.38 | down |
| 1448381 | G elongation factor 1 | Gfm1 | 0.0045 | 1.35 | down |
| 1437163 | general transcription factor II H, polypeptide 4 | Gtf2h4 | 0.0446 | 1.17 | up |
| 1425628 | transcription factor TFII-I-alpha | Gtf2i | 0.0296 | 1.32 | down |
| 1416176 | high mobility group box 1 | Hmgb1 | 0.0077 | 1.29 | down |
| 1455626 | homeo box A9 | Hoxa9 | 0.0190 | 1.61 | down |
| 1454760 | HIV TAT specific factor 1 | Htatsf1 | 0.0337 | 1.28 | down |
| 1460669 | interleukin enhancer binding factor 3 | Ilf3 | 0.0213 | 1.27 | down |
| 1455762 | kinase D-interacting substrate 220 | Kidins220 | 0.0152 | 1.26 | down |
| 1456341 | Kruppel-like factor 9 | Klf9 | 0.0080 | 1.38 | down |
| 1455214 | microphthalmia-associated transcription factor | Mitf | 0.0081 | 1.30 | down |
| 1435547 | MKL/myocardin-like 2 | Mkl2 | 0.0335 | 1.35 | down |
| 1443500 | myeloid/lymphoid or mixed lineage-leukemia translocation to 10 | Mllt10 | 0.0080 | 1.16 | up |
| 1457632 | myeloid ecotropic viral integration site-related gene 1 | Mrg1 | 0.0333 | 2.40 | down |
| 1424204 | mitochondrial ribosomal protein L13 | Mrpl13 | 0.0101 | 1.24 | down |
| 1434971 | mitochondrial ribosomal protein L15 | Mrpl15 | 0.0463 | 1.13 | down |
| 1440989 | mitochondrial ribosomal protein L35 | Mrpl15 | 0.0041 | 1.35 | down |
| 1456109 | mitochondrial ribosomal protein S15 | Mrps15 | 0.0311 | 1.30 | down |
| 1452608 | c-myc binding protein | Mycbp | 0.0004 | 1.47 | down |
| 1423201 | nuclear receptor co-repressor 1 | Ncor1 | 0.0107 | 1.26 | down |
| 1447693 | Neogenin | Neo1 | 0.0410 | 1.18 | down |
| 1448963 | nuclear transcription factor-Y gamma | Nfyc | 0.0215 | 1.19 | down |
| 1434398 | NF-kappaB repressing factor | Nkrf | 0.0074 | 1.71 | down |
| 1419112 | nemo like kinase | Nlk | 0.0478 | 1.27 | down |
| 1416958 | nuclear receptor subfamily 1, group D, member 2 | Nr1d2 | 0.0079 | 1.57 | down |
| 1454851 | nuclear receptor subfamily 2, group C, member 2 | Nr2c2 | 0.0491 | 1.15 | down |
| 1448493 | polyadenylate-binding protein-interacting protein 2 | Paip2 | 0.0261 | 1.42 | down |
| 1426878 | polybromo1 | Pbrm1 | 0.0033 | 1.22 | down |
| 1427266 | polybromo1 | Pbrm1 | 0.0046 | 1.31 | down |
| 1417493 | polycomb group ring finger 4 | Pcgf4 | 0.0091 | 1.24 | down |
| 1453271 | PHD finger protein 14 | Phf14 | 0.0151 | 1.52 | down |
| 1456395 | peroxisome proliferative activated receptor, γ, coactivator 1a | Ppargc1a | 0.0001 | 1.66 | down |
| 1456037 | prolactin regulatory element binding | Preb | 0.0147 | 1.41 | down |
| 1428254 | purine rich element binding protein B | Purb | 0.0102 | 1.29 | down |
| 1436979 | RNA binding motif protein 14 | Rbm14 | 0.0106 | 1.19 | down |
| 1422660 | RNA binding motif protein 3 | Rbm3 | 0.0398 | 1.54 | up |
| 1443922 | REST corepressor 3 (Rcor3), mRNA | Rcor3 | 0.0495 | 1.32 | up |
| 1434521 | regulatory factor X domain containing 2 homolog | Rfxdc2 | 0.0103 | 1.39 | down |
| 1438505 | ribonuclease III, nuclear | Rnasen | 0.0341 | 1.14 | down |
| 1426660 | ribosomal protein L23a | Rpl23a | 0.0332 | 1.26 | down |
| 1437975 | ribosomal protein L23a | Rpl23a | 0.0488 | 1.18 | down |
| 1436046 | ribosomal protein L29 | Rpl29 | 0.0144 | 1.15 | down |
| 1448846 | ribosomal protein L29 | Rpl29 | 0.0314 | 1.20 | down |
| 1454627 | ribosomal protein L29 | Rpl29 | 0.0113 | 1.38 | down |
| 1455348 | ribosomal protein L29 | Rpl29 | 0.0203 | 1.21 | down |
| 1420381 | ribosomal protein L31 | Rpl31 | 0.0134 | 1.40 | down |
| 1438986 | ribosomal protein S17 | Rps17 | 0.0496 | 1.24 | down |
| 1430288 | ribosomal protein S21 | Rps21 | 0.0471 | 1.19 | down |
| 1415876 | ribosomal protein S26 | Rps26 | 0.0311 | 1.33 | down |
| 1423763 | ribosomal protein S28 | Rps28 | 0.0406 | 1.15 | down |
| 1435816 | ribosomal protein S6 | Rps6 | 0.0011 | 1.15 | up |
| 1448584 | arginine/serine-rich coiled-coil 1 | Rsrc1 | 0.0148 | 1.25 | down |
| 1428219 | RING1 and YY1 binding protein | Rybp | 0.0223 | 1.46 | down |
| 1416008 | special AT-rich sequence binding protein 1 | Satb1 | 0.0242 | 1.28 | down |
| 1417892 | sirtuin 3 (silent mating type information regulation 2, homolog) 3 | Sirt3 | 0.0200 | 1.27 | down |
| 1426668 | solute carrier family 30 (zinc transporter), member 9 | Slc30a9 | 0.0325 | 1.34 | down |
| 1429624 | SAFB-like transcription modulator | Sltm | 0.0193 | 1.21 | down |
| 1436703 | small nuclear RNA activating complex, polypeptide 2 | Snapc2 | 0.0432 | 1.14 | up |
| 1444531 | Superoxide dismutase 2, mitochondrial | Sod2 | 0.0254 | 1.21 | up |
| 1451542 | single-stranded DNA binding protein 2 | Ssbp2 | 0.0262 | 1.40 | down |
| 1434238 | RNA polymerase II, TATA box binding protein-associated factor | Taf2 | 0.0063 | 1.54 | down |
| 1436318 | TAR DNA binding protein | Tardbp | 0.0104 | 1.60 | down |
| 1452593 | transcription elongation factor B (SIII), polypeptide 1 | Tceb1 | 0.0360 | 1.15 | up |
| 1421147 | telomeric repeat binding factor 2 | Terf2 | 0.0355 | 1.24 | down |
| 1460545 | thyroid hormone receptor associated protein 3 | Thrap3 | 0.0201 | 1.11 | down |
| 1416812 | cytotoxic granule-associated RNA binding protein 1 | Tia1 | 0.0287 | 1.47 | down |
| 1416814 | cytotoxic granule-associated RNA binding protein 1 | Tia1 | 0.0115 | 1.50 | down |
| 1434898 | trinucleotide repeat containing 6a | Tnrc6a | 0.0004 | 1.57 | down |
| 1434899 | trinucleotide repeat containing 6a | Tnrc6a | 0.0039 | 1.43 | down |
| 1438376 | tripartite motif protein 27 | Trim27 | 0.0415 | 1.15 | down |
| 1426954 | tripartite motif protein 33 | Trim33 | 0.0320 | 1.27 | down |
| 1447780 | Tu translation elongation factor, mitochondrial | Tufm | 0.0433 | 1.16 | down |
| 1435389 | ubiquitin A-52 residue ribosomal protein fusion product 1 | Uba52 | 0.0105 | 1.35 | down |
| 1455222 | upstream binding protein 1 | Ubp1 | 0.0403 | 1.35 | down |
| 1427097 | WW domain containing E3 ubiquitin protein ligase 1 | Wwp1 | 0.0464 | 1.25 | down |
| 1420011 | X-box binding protein 1 | Xbp1 | 0.0167 | 1.24 | down |
| 1437223 | X-box binding protein 1 | Xbp1 | 0.0496 | 1.33 | down |
| 1422569 | YY1 transcription factor | Yy1 | 0.0313 | 1.35 | down |
| 1457285 | zinc finger protein 187 | Zfp187 | 0.0332 | 1.20 | down |
| 1426895 | zinc finger protein 191 | Zfp191 | 0.0081 | 1.18 | down |
| 1456824 | zinc finger protein 612 | Zfp612 | 0.0388 | 1.16 | down |
| 1437873 | zinc finger protein 799 | Zfp799 | 0.0078 | 1.48 | down |
| 1448875 | zinc fingers and homeoboxes protein 1 | Zhx1 | 0.0471 | 1.18 | down |
| 1426531 | zinc finger, MYND domain containing 11 | Zmynd11 | 0.0005 | 1.32 | down |
Among the changes seen in this functionally category of genes, was downregulation of a number of splicing factors, and other genes involved in mRNA processing. Several ribosomal components also showed reduced expression. The cAMP responsive element binding protein, CREB1 is a stimulus-inducible transcription factor which mediates nuclear responses underlying the development, function and plasticity of the nervous system [80]. Downregulation of several members of the CREB family is seen in VEGFδ/δ mice-CREB1, CREBBP, CREBzf, its interacting partner, ATF4 (CREB2), and Cri2. Inactivation of neuronal CREB1 has been shown to cause defects in neurone migration, similar to those observed with reelin [81], and to stimulate neurodegeneration [82]. There is also downregulation of the androgen receptor, and related nuclear receptors, Nr1d2, Nr2c2 and the oestrogen receptor, Esrrg. Steroid hormones have wide ranging effects on the structure and function of the nervous system. Androgen receptor function is known to be important for motor neurone survival, and disruption of this function in Kennedy's disease contributes to the motor neurone degeneration seen in this condition [83].
Verification of microarray results by QPCR
The results of QPCR verification for the 15 representative genes chosen is shown in Table 11. Eight genes showed a significant downregulation of expression in VEGFδ/δ mice, which supported the microarray findings. A further 4 showed a trend towards downregulation which failed to reach significance, while 4 showed no change in expression despite a finding of significant expression by microarray analysis. The majority of microarray publications have indicated that arrays and QPCR analysis usually support each other qualitatively. However, it is well recognized that significant quantitative differences occur between microarray and QPCR data [84]. This may be related to gene specific variation in the hybridization kinetics associated with the two technologies, low fold changes or hybridization signals in the microarray experiment, or lack of transcript concordance between the probes used for microarray and QPCR analysis. The proportion of genes validated by this study using QPCR, with the larger sample sizes at 3 and 5 months, is comparable to that found by other studies [85,86]. Although not all changes seen on microarray were validated by QPCR, it has been argued that where the focus of microarray analysis is the overall pattern of gene expression rather than the response of a few genes, as in this study, there is less utility in confirming the expression differences of individual genes [87].
Table 11.
Comparison of QPCR and microarray data of the 15 genes selected for verification
| Microarray result | QPCR result | |||||
|---|---|---|---|---|---|---|
| Time point | Gene Symbol | FC | P value | n | FC | P value |
| 3 months | Zfp101 | +4.35 | 0.01 | 6 | No change | |
| Fos | -2.32 | 0.03 | 6 | -2.59 | 0.0003 | |
| Reelin | -1.88 | 0.004 | 6 | -1.68 | 0.03 | |
| HspA5 | -1.44 to -1.46 | 0.02 to 0.01 | 6 | -1.34 | 0.06 | |
| 5 months | Fos | -2.17 | 0.01 | 6 | -2.13 | 0.0007 |
| Ldlr | -2.14 | 0.02 | 6 | -1.42 | 0.006 | |
| Scd1 | -2.07 | 0.02 | 6 | -1.19 | 0.01 | |
| Nrp1 | -1.58 to -2.02 | 0.02 to 0.009 | 6 | No change | ||
| Mtap1B | -2.10 | 0.01 | 6 | No change | ||
| Alcam | -1.60 to -1.94 | 0.03 to 0.02 | 6 | -1.43 | 0.01 | |
| 14 months | Reelin | -2.41 | 0.007 | 3 | -2.1 | 0.008 |
| HSPA5 | -1.48 | 0.004 | 3 | -1.27 | 0.2 | |
| Hnrpdl | -2.20 | 0.005 | 3 | -1.21 | 0.2 | |
| Tnrc6a | -1.43 to -1.57 | 0.004 to 0.0004 | 3 | No change | ||
| Alcam | -1.50 to -1.65 | 0.04 to 0.004 | 3 | -1.59 | 0.003 | |
Significant results are highlighted in bold; n = no. of transgenic mice used for QPCR verification, with an equal number of gender matched littermate controls.
Reduced axon growth of VEGFδ/δ motor neurones grown in vitro
Downregulation of genes involved in nervous system development and axonogenesis was observed in motor neurones of VEGFδ/δ mice. A functional correlation of this finding was demonstrated by the growth of primary motor neurones from VEGFwt/wt, VEGFδ/wt and VEGFδ/δ mice in vitro. Survival of primary motor neurone cultures grown under basal conditions for 7 days was unaffected by deletion of the hypoxia response element of the VEGF gene (data not shown). A significant reduction in the length of axons was observed in cultures of motor neurones homozygous for the HRE deletion, compared to wild-type motor neurones (472 ± 26 μm vs 562 ± 31 μm, p = 0.047; figure 6a). The outgrowth of dendrites was unaffected (p = 0.34; figure 6b).
Figure 6.
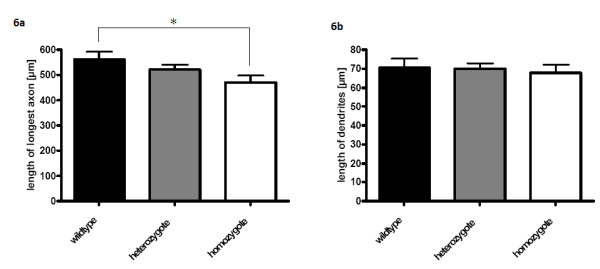
The average length of the longest axonal process observed in primary motor neuron cultures isolated from E12.5VEGFδ/δ (n = 4), VEGFδ/wt (n = 14) and VEGFwt/wt (n = 8) mice (Figure 6a). These motor neurons were grown for 7 days on laminin with BDNF and CNTF. The average length of dendrites isolated from the same mice is also shown (Figure 6b). Asterisk indicates p < 0.05.
Discussion
Upregulation of oxidative phosphorylation in presymptomatic mice
A small but significant upregulation of genes involved in the TCA cycle and oxidative phosphorylation was observed in VEGFδ/δ mice in presymptomatic stages. This finding is not in keeping with the 'chronic ischaemia' hypothesis of neurodegeneration in the VEGFδ/δ mouse model: were motor neurones in a state of chronic oxygen deprivation due to reduced baseline neural blood flow, oxidative phosphorylation would have been downregulated. A similar upregulation of oxidative phosphorylation was seen in motor neurones in the SOD1 mouse model of ALS [21], and this may be a non-specific adaptation to cellular stress in the early stages of disease.
Transcriptional downregulation and changes in the regulation of gene expression
One of the most marked changes observed in the VEGFδ/δ mouse model was transcriptional downregulation with disease progression, which was accompanied in late stage disease by a reduction in expression of genes involved in the regulation of gene expression, particularly mRNA processing. Similar transcriptional downregulation was observed in a study of the SOD1 mouse model of ALS [21], and in the ageing human brain [88]. The cause of this transcriptional downregulation is not known, although several mechanisms may be proposed. Firstly, it may be due to low level oxidative modification of nuclear DNA, which has been shown to accompany downregulation of gene expression in the ageing human brain [88]. Secondly, reduction in expression of VEGF could result in reduced induction of sequence-specific transcription factors, such as Fos, which was robustly downregulated in this study, with consequent downregulation of genes regulated by those factors [89,90]. Thirdly, epigenetic modifications which cause suppression of gene expression, such as DNA methylation, increase with age and are accelerated in neurodegenerative diseases [91].
Downregulation of cholesterol metabolism at disease onset
Five genes in the final committed pathway to cholesterol synthesis, and two receptors which bind cholesterol and transport it into the cells, were downregulated in the VEGFδ/δ mouse. Neuronal cholesterol is either synthesised by neurones or produced by astrocytes, bound to apolipoprotein E (APOE), and taken up by neurones via the low density lipoprotein receptor[92]. Cholesterol-rich lipid rafts in the growth cone are required for downstream signaling of adhesion molecules and guidance receptors during axon growth and guidance. Cholesterol stimulates the formation of synapses, and has important roles in synaptic function, and the release of neurotransmitters [93-96]. A recent study showed that the neurotrophic factor, BDNF, promotes synaptic development in cortical neurones via the stimulation of cholesterol biosynthesis [97], and the findings of this study suggest that VEGF may have a similar function. Cholesterol homeostasis is already implicated in the pathogenesis of neurodegenerative disease. There is a strong association between Alzheimer's disease and the APOE4 allele, which has reduced efficacy in cholesterol delivery to cells, and in stimulating neurite outgrowth [98]. Downregulation in the expression of genes involved in the cholesterol synthesis pathway is seen in cortical tissue of patients with Huntington's disease, and in mouse and cell models of the disease [99,100].
Neurite outgrowth and synaptogenesis
In adult mice, reduction in neural expression of VEGF, through deletion of its hypoxia-response element, causes downregulation of genes which are known to play a role in the growth of neuronal processes and formation of synapses during embryonic development. These include promoters of outgrowth of neuronal processes, components of neurotrophic signalling pathways, cell adhesion molecules, and the cholesterol synthesis pathway. The most significantly enriched functional gene categories at 5 months relate to axon extension and axon maintenance. This finding was supported by in vitro data: primary motor neurones from VEGFδ/δ mice show a significant reduction in axon outgrowth compared to their wild-type littermates. This effect of VEGF was specific to that neuronal compartment, with no effect on dendrite growth, or on cell survival. Exogenous VEGF protein stimulates axon outgrowth in cultures of primary motor neurones [20] although to a lesser degree than exogenous BDNF and CNTF. Despite addition of BDNF and CNTF to the primary neurone cultures in this study, axon outgrowth from VEGFδ/δ motor neurones was significantly reduced, indicating that the effect of VEGF on axonal outgrowth cannot be substituted for by the presence of other growth factors.
Differential expression of genes relating to the growth of neuronal processes, and formation of synapses was an unexpected finding in the adult animal, but there is growing evidence that changes involved in the plasticity of the nervous system and in the maintenance of neuronal networks in the adult animal recapitulate, to some degree, those underlying the formation of neuronal networks during development: cell adhesion molecules that mediate target recognition and synapse formation during embryogenesis also lead to changes in synaptic efficacy in the adult nervous system [101]; BMP signalling at the Drosophila NMJ is not only required for normal synaptic growth, but also for synaptic stabilization, via LIM kinase-1, and disruption of this pathway leads to synaptic disassembly and retraction [102]; the wnt signalling pathway maintains activity-dependent axon stability in adult olfactory neurones [103]; neurotrophins were first recognized as target-dependent survival factors for developing neurones during embryogenesis, but they have also been shown to promote synaptic stability and maintain neuronal processes in response to mechanical axonal injury [104].
Although the NMJ is considered a relatively stable structure, plasticity of the motor system is seen in response to changing physiological demands and to pathological conditions. Alterations in synaptic structure and function occur in the motor cortex, spinal cord and NMJ in response to exercise [105-107], while partial denervation or paralysis results in sprouting and reinnervation from adjacent nerve fibres [57]. The observation of fibre-type grouping in ageing muscle indicates that denervation and reinnervation of muscle fibres occurs with normal ageing [108]. Motor units differ in the plasticity of their synapses. Synapses formed on Fast Synapsing (FaSyn) muscle, or by fast-fatiguable (FF)-type motor units exhibit relatively little synaptic plasticity, compared to Delayed Synapsing (DeSyn) or slow (S)-type motor units. Motor units with less synaptic plasticity exhibit early susceptibility to loss in motor neurone degenerative disease, and in the SOD1 mouse model of ALS, a progressive impairment of stimulus-induced synaptic sprouting was observed over the course of the disease, suggesting that the absence of synaptic plasticity, and disease-induced synaptic loss are mechanistically linked [109,110].
The transcriptional changes observed in VEGFδ/δ mice would be predicted to result in a reduced capacity for the morphological adaptations that occur during plasticity of the motor unit, resulting in increased vulnerability to degeneration. As neuronal processes and synapses are required continuously to retract and reform during the process of synaptic plasticity, downregulation of genes involved in neurite growth and synapse formation would be likely to result in gradual attrition of synapses and distal cellular processes. Synapse retraction causes loss of access of the neurone to trophic signals from target tissue. A recent study has shown that muscle hypermetabolism is sufficient to cause degeneration of NMJs, and subsequent loss of spinal cord motor neurones [111]. Although ALS is characterized pathologically by loss of motor neurone somata, and gliosis in the anterior horn of the spinal cord, these post mortem findings may not reflect changes occurring earlier in the disease. There is evidence in both human ALS and in mouse models, that motor neurone death occurs by the type of 'dying back' axonal degenerative pathophysiology, that would be predicted in this model, with defects of neuromuscular transmission, end-plate denervation, and 'peripheral pruning' of axons as the earliest observed events [112-114]. VEGFδ/δ mice similarly show relative preservation of spinal motor neurones, at stages of disease where there is marked axonal loss [1].
The relevance of this finding in the VEGFδ/δ mouse model of ALS to the human disease is unknown, but failure of synaptic plasticity has been proposed as a pathogenic mechanism in Alzheimer's disease [115]. A failure to maintain neuronal processes and synapses in the face of increasing demands of neuronal plasticity would explain two epidemiological observations in ALS: the associations between exposure to vigorous physical activity [116,117] or skeletal fractures [118], and the risk of developing the disease.
An alternative hypothesis is that the pathogenic insult in VEGFδ/δ mice occurs during their development, when a lack of VEGF may lead to aberrant neuronal guidance and formation of neural networks. Subtle defects in neuronal positioning and in synaptic circuitry in VEGFδ/δ mice could result in reduced stability of synaptic connections, or a reduction in target-derived neurotrophic support, with consequent increased loss of motor neurones during ageing. This hypothesis is supported by the observation that embryonic motor neurones show a reduction in axonal outgrowth in vitro.
Conclusions
Reduction in expression of VEGF, through deletion of a regulatory promoter region of the gene, results in adult-onset motor neurone degeneration that resembles human ALS. We have presented evidence here that this phenotype is accompanied by reduction in expression, from symptom onset, of the cholesterol synthesis pathway, and genes involved in nervous system development, including axonogenesis, synapse formation, growth factor signalling pathways, cell adhesion and microtubule-based processes. These findings raise the possibility that VEGF is required for the maintenance of distal neuronal processes in the adult animal, perhaps through promotion of remodelling of distal processes and synapses in the face of the demands of neuronal plasticity. A reduction in VEGF expression in VEGFδ/δ mice may lead to failure of the maintenance of neuronal circuitry, causing axonal retraction and cell death.
Authors' contributions
AB carried out the laser capture microdissection, RNA processing and microarray analysis and QPCR studies, and drafted the manuscript; PH participated in the study design and in the microarray analysis; HH participated in the laser capture microdissection, microarray analysis and QPCR studies; PK carried out the preparation of neural tissue from VEGFδ/δ mice for laser capture microdissection; FB carried out the in vitro studies of axon outgrowth and survival; FC participated in the design of the study, maintenance of the VEGFδ/δ mouse colony, selection and preparation of mice for the study; DL and MS conceived, designed and supervised the in vitro studies of axon outgrowth and survival, and DL helped to draft the manuscript; PC and PJS conceived of the study, and participated in its design and coordination, PJS helped to draft the manuscript. All authors read and approved the final manuscript.
Contributor Information
Alice Brockington, Email: alicebrockington@yahoo.co.uk.
Paul R Heath, Email: p.heath@sheffield.ac.uk.
Hazel Holden, Email: h.holden@sheffield.ac.uk.
Paul Kasher, Email: P.R.Kasher@amc.uva.nl.
Florian LP Bender, Email: benderflp@googlemail.com.
Filip Claes, Email: Filip.Claes@pmintl.com.
Diether Lambrechts, Email: diether.lambrechts@vib-kuleuven.be.
Michael Sendtner, Email: Sendtner_M@klinik.uni-wuerzburg.de.
Peter Carmeliet, Email: peter.carmeliet@vib-kuleuven.ac.be.
Pamela J Shaw, Email: pamela.shaw@shef.ac.uk.
Acknowledgements
PJS is supported by Wellcome Trust and the Motor Neuron Disease Association. AB is supported by a Wellcome Trust Clinical Training fellowship. DL and PC are supported by the Geneeskundige stichting Koningin Elisabeth (GSKE), the Muscular Dystrophy Association (MDA), the Motor Neuron Disease (MND) association, and by the Institute for the Promotion of Innovation by Science and Technology in Flanders (IWT).
References
- Oosthuyse B, Moons L, Storkebaum E, Beck H, Nuyens D, Brusselmans K, Van Dorpe J, Hellings P, Gorselink M, Heymans S. et al. Deletion of the hypoxia-response element in the vascular endothelial growth factor promoter causes motor neuron degeneration. Nat Genet. 2001;28:131–138. doi: 10.1038/88842. [DOI] [PubMed] [Google Scholar]
- Brockington A, Lewis C, Wharton S, Shaw PJ. Vascular endothelial growth factor and the nervous system. Neuropathol Appl Neurobiol. 2004;30:427–446. doi: 10.1111/j.1365-2990.2004.00600.x. [DOI] [PubMed] [Google Scholar]
- Ruiz de Almodovar C, Lambrechts D, Mazzone M, Carmeliet P. Role and therapeutic potential of VEGF in the nervous system. Physiol Rev. 2009;89:607–648. doi: 10.1152/physrev.00031.2008. [DOI] [PubMed] [Google Scholar]
- Azzouz M, Ralph GS, Storkebaum E, Walmsley LE, Mitrophanous KA, Kingsman SM, Carmeliet P, Mazarakis ND. VEGF delivery with retrogradely transported lentivector prolongs survival in a mouse ALS model. Nature. 2004;429:413–417. doi: 10.1038/nature02544. [DOI] [PubMed] [Google Scholar]
- Storkebaum E, Lambrechts D, Dewerchin M, Moreno-Murciano MP, Appelmans S, Oh H, Van Damme P, Rutten B, Man WY, De Mol M. et al. Treatment of motoneuron degeneration by intracerebroventricular delivery of VEGF in a rat model of ALS. Nat Neurosci. 2005;8:85–92. doi: 10.1038/nn1360. [DOI] [PubMed] [Google Scholar]
- Carmeliet P, Ferreira V, Breier G, Pollefeyt S, Kieckens L, Gertsenstein M, Fahrig M, Vandenhoeck A, Harpal K, Eberhardt C. et al. Abnormal blood vessel development and lethality in embryos lacking a single VEGF allele. Nature. 1996;380:435–439. doi: 10.1038/380435a0. [DOI] [PubMed] [Google Scholar]
- Ferrara N, Carver-Moore K, Chen H, Dowd M, Lu L, O'Shea KS, Powell-Braxton L, Hillan KJ, Moore MW. Heterozygous embryonic lethality induced by targeted inactivation of the VEGF gene. Nature. 1996;380:439–442. doi: 10.1038/380439a0. [DOI] [PubMed] [Google Scholar]
- Jin K, Zhu Y, Sun Y, Mao XO, Xie L, Greenberg DA. Vascular endothelial growth factor (VEGF) stimulates neurogenesis in vitro and in vivo. Proc Natl Acad Sci USA. 2002;99:11946–11950. doi: 10.1073/pnas.182296499. [DOI] [PMC free article] [PubMed] [Google Scholar]
- Louissaint A Jr, Rao S, Leventhal C, Goldman SA. Coordinated interaction of neurogenesis and angiogenesis in the adult songbird brain. Neuron. 2002;34:945–960. doi: 10.1016/S0896-6273(02)00722-5. [DOI] [PubMed] [Google Scholar]
- Palmer TD, Willhoite AR, Gage FH. Vascular niche for adult hippocampal neurogenesis. J Comp Neurol. 2000;425:479–494. doi: 10.1002/1096-9861(20001002)425:4<479::AID-CNE2>3.0.CO;2-3. [DOI] [PubMed] [Google Scholar]
- Carmeliet P. Blood vessels and nerves: common signals, pathways and diseases. Nat Rev Genet. 2003;4:710–720. doi: 10.1038/nrg1158. [DOI] [PubMed] [Google Scholar]
- Schwarz Q, Gu C, Fujisawa H, Sabelko K, Gertsenstein M, Nagy A, Taniguchi M, Kolodkin AL, Ginty DD, Shima DT, Ruhrberg C. Vascular endothelial growth factor controls neuronal migration and cooperates with Sema3A to pattern distinct compartments of the facial nerve. Genes Dev. 2004;18:2822–2834. doi: 10.1101/gad.322904. [DOI] [PMC free article] [PubMed] [Google Scholar]
- Lambrechts D, Poesen K, Fernandez-Santiago R, Al-Chalabi A, Del Bo R, Van Vught PW, Khan S, Marklund S, Brockington A, Van Marion I. et al. Meta-analysis of VEGF variations in ALS: increased susceptibility in male carriers of the -2578AA genotype. J Med Genet. 2009;46(12):840–846. doi: 10.1136/jmg.2008.058222. [DOI] [PubMed] [Google Scholar]
- Brockington A, Wharton SB, Fernando M, Gelsthorpe CH, Baxter L, Ince PG, Lewis CE, Shaw PJ. Expression of vascular endothelial growth factor and its receptors in the central nervous system in amyotrophic lateral sclerosis. J Neuropathol Exp Neurol. 2006;65:26–36. doi: 10.1097/01.jnen.0000196134.51217.74. [DOI] [PubMed] [Google Scholar]
- Luzzi V, Mahadevappa M, Raja R, Warrington JA, Watson MA. Accurate and reproducible gene expression profiles from laser capture microdissection, transcript amplification, and high density oligonucleotide microarray analysis. J Mol Diagn. 2003;5:9–14. doi: 10.1016/S1525-1578(10)60445-X. [DOI] [PMC free article] [PubMed] [Google Scholar]
- Schroeder A, Mueller O, Stocker S, Salowsky R, Leiber M, Gassmann M, Lightfoot S, Menzel W, Granzow M, Ragg T. The RIN: an RNA integrity number for assigning integrity values to RNA measurements. BMC Mol Biol. 2006;7:3. doi: 10.1186/1471-2199-7-3. [DOI] [PMC free article] [PubMed] [Google Scholar]
- Schoor O, Weinschenk T, Hennenlotter J, Corvin S, Stenzl A, Rammensee HG, Stevanovic S. Moderate degradation does not preclude microarray analysis of small amounts of RNA. Biotechniques. 2003;35:1192–1196. doi: 10.2144/03356rr01. [DOI] [PubMed] [Google Scholar]
- Weis S, Llenos IC, Dulay JR, Elashoff M, Martinez-Murillo F, Miller CL. Quality control for microarray analysis of human brain samples: The impact of postmortem factors, RNA characteristics, and histopathology. J Neurosci Methods. 2007;165:198–209. doi: 10.1016/j.jneumeth.2007.06.001. [DOI] [PubMed] [Google Scholar]
- Dennis G Jr, Sherman BT, Hosack DA, Yang J, Gao W, Lane HC, Lempicki RA. DAVID: Database for Annotation, Visualization, and Integrated Discovery. Genome Biol. 2003;4:P3. doi: 10.1186/gb-2003-4-5-p3. [DOI] [PubMed] [Google Scholar]
- Poesen K, Lambrechts D, Van Damme P, Dhondt J, Bender F, Frank N, Bogaert E, Claes B, Heylen L, Verheyen A. et al. Novel role for vascular endothelial growth factor (VEGF) receptor-1 and its ligand VEGF-B in motor neuron degeneration. J Neurosci. 2008;28:10451–10459. doi: 10.1523/JNEUROSCI.1092-08.2008. [DOI] [PMC free article] [PubMed] [Google Scholar]
- Ferraiuolo L, Heath PR, Holden H, Kasher P, Kirby J, Shaw PJ. Microarray analysis of the cellular pathways involved in the adaptation to and progression of motor neuron injury in the SOD1 G93A mouse model of familial ALS. J Neurosci. 2007;27:9201–9219. doi: 10.1523/JNEUROSCI.1470-07.2007. [DOI] [PMC free article] [PubMed] [Google Scholar]
- Laughton JD, Charnay Y, Belloir B, Pellerin L, Magistretti PJ, Bouras C. Differential messenger RNA distribution of lactate dehydrogenase LDH-1 and LDH-5 isoforms in the rat brain. Neuroscience. 2000;96:619–625. doi: 10.1016/S0306-4522(99)00580-1. [DOI] [PubMed] [Google Scholar]
- Porter AG, Urbano AG. Does apoptosis-inducing factor (AIF) have both life and death functions in cells? Bioessays. 2006;28:834–843. doi: 10.1002/bies.20444. [DOI] [PubMed] [Google Scholar]
- Eilenberg H, Shechter I. A possible regulatory role of squalene epoxidase in Chinese hamster ovary cells. Lipids. 1984;19:539–543. doi: 10.1007/BF02534487. [DOI] [PubMed] [Google Scholar]
- Strauss JF, Kishida T, Christenson LK, Fujimoto T, Hiroi H. START domain proteins and the intracellular trafficking of cholesterol in steroidogenic cells. Mol Cell Endocrinol. 2003;202:59–65. doi: 10.1016/s0303-7207(03)00063-7. [DOI] [PubMed] [Google Scholar]
- Naeve GS, Ramakrishnan M, Kramer R, Hevroni D, Citri Y, Theill LE. Neuritin: a gene induced by neural activity and neurotrophins that promotes neuritogenesis. Proc Natl Acad Sci USA. 1997;94:2648–2653. doi: 10.1073/pnas.94.6.2648. [DOI] [PMC free article] [PubMed] [Google Scholar]
- Aruga J, Mikoshiba K. Identification and characterization of Slitrk, a novel neuronal transmembrane protein family controlling neurite outgrowth. Mol Cell Neurosci. 2003;24:117–129. doi: 10.1016/S1044-7431(03)00129-5. [DOI] [PubMed] [Google Scholar]
- Robinson KN, Manto K, Buchsbaum RJ, MacDonald JI, Meakin SO. Neurotrophin-dependent tyrosine phosphorylation of Ras guanine-releasing factor 1 and associated neurite outgrowth is dependent on the HIKE domain of TrkA. J Biol Chem. 2005;280:225–235. doi: 10.1074/jbc.M410454200. [DOI] [PubMed] [Google Scholar]
- Houenou LJ, Turner PL, Li L, Oppenheim RW, Festoff BW. A serine protease inhibitor, protease nexin I, rescues motoneurons from naturally occurring and axotomy-induced cell death. Proc Natl Acad Sci USA. 1995;92:895–899. doi: 10.1073/pnas.92.3.895. [DOI] [PMC free article] [PubMed] [Google Scholar]
- Turgeon VL, Houenou LJ. The role of thrombin-like (serine) proteases in the development, plasticity and pathology of the nervous system. Brain Res Brain Res Rev. 1997;25:85–95. doi: 10.1016/S0165-0173(97)00015-5. [DOI] [PubMed] [Google Scholar]
- Choi YJ, Di Nardo A, Kramvis I, Meikle L, Kwiatkowski DJ, Sahin M, He X. Tuberous sclerosis complex proteins control axon formation. Genes Dev. 2008;22:2485–2495. doi: 10.1101/gad.1685008. [DOI] [PMC free article] [PubMed] [Google Scholar]
- Lu J, Wu Y, Sousa N, Almeida OF. SMAD pathway mediation of BDNF and TGF beta 2 regulation of proliferation and differentiation of hippocampal granule neurons. Development. 2005;132:3231–3242. doi: 10.1242/dev.01893. [DOI] [PubMed] [Google Scholar]
- Markus A, Patel TD, Snider WD. Neurotrophic factors and axonal growth. Curr Opin Neurobiol. 2002;12:523–531. doi: 10.1016/S0959-4388(02)00372-0. [DOI] [PubMed] [Google Scholar]
- Miyamoto Y, Yamauchi J, Tanoue A, Wu C, Mobley WC. TrkB binds and tyrosine-phosphorylates Tiam1, leading to activation of Rac1 and induction of changes in cellular morphology. Proc Natl Acad Sci USA. 2006;103:10444–10449. doi: 10.1073/pnas.0603914103. [DOI] [PMC free article] [PubMed] [Google Scholar]
- Kawa S, Fujimoto J, Tezuka T, Nakazawa T, Yamamoto T. Involvement of BREK, a serine/threonine kinase enriched in brain, in NGF signalling. Genes Cells. 2004;9:219–232. doi: 10.1111/j.1356-9597.2004.00714.x. [DOI] [PubMed] [Google Scholar]
- Mori T, Wada T, Suzuki T, Kubota Y, Inagaki N. Singar1, a novel RUN domain-containing protein, suppresses formation of surplus axons for neuronal polarity. J Biol Chem. 2007;282:19884–19893. doi: 10.1074/jbc.M700770200. [DOI] [PubMed] [Google Scholar]
- Chan SL, Furukawa K, Mattson MP. Presenilins and APP in neuritic and synaptic plasticity: implications for the pathogenesis of Alzheimer's disease. Neuromolecular Med. 2002;2:167–196. doi: 10.1385/NMM:2:2:167. [DOI] [PubMed] [Google Scholar]
- Laub F, Lei L, Sumiyoshi H, Kajimura D, Dragomir C, Smaldone S, Puche AC, Petros TJ, Mason C, Parada LF, Ramirez F. Transcription factor KLF7 is important for neuronal morphogenesis in selected regions of the nervous system. Mol Cell Biol. 2005;25:5699–5711. doi: 10.1128/MCB.25.13.5699-5711.2005. [DOI] [PMC free article] [PubMed] [Google Scholar]
- Aoki K, Nakamura T, Fujikawa K, Matsuda M. Local phosphatidylinositol 3,4,5-trisphosphate accumulation recruits Vav2 and Vav3 to activate Rac1/Cdc42 and initiate neurite outgrowth in nerve growth factor-stimulated PC12 cells. Mol Biol Cell. 2005;16:2207–2217. doi: 10.1091/mbc.E04-10-0904. [DOI] [PMC free article] [PubMed] [Google Scholar]
- Schenck A, Bardoni B, Langmann C, Harden N, Mandel JL, Giangrande A. CYFIP/Sra-1 controls neuronal connectivity in Drosophila and links the Rac1 GTPase pathway to the fragile X protein. Neuron. 2003;38:887–898. doi: 10.1016/S0896-6273(03)00354-4. [DOI] [PubMed] [Google Scholar]
- Georges PC, Hadzimichalis NM, Sweet ES, Firestein BL. The yin-yang of dendrite morphology: unity of actin and microtubules. Mol Neurobiol. 2008;38:270–284. doi: 10.1007/s12035-008-8046-8. [DOI] [PubMed] [Google Scholar]
- Teuling E, van Dis V, Wulf PS, Haasdijk ED, Akhmanova A, Hoogenraad CC, Jaarsma D. A novel mouse model with impaired dynein/dynactin function develops amyotrophic lateral sclerosis (ALS)-like features in motor neurons and improves lifespan in SOD1-ALS mice. Hum Mol Genet. 2008;17:2849–2862. doi: 10.1093/hmg/ddn182. [DOI] [PubMed] [Google Scholar]
- Fukushima N, Furuta D, Hidaka Y, Moriyama R, Tsujiuchi T. Post-translational modifications of tubulin in the nervous system. J Neurochem. 2009;109:683–693. doi: 10.1111/j.1471-4159.2009.06013.x. [DOI] [PubMed] [Google Scholar]
- Schaefer MK, Schmalbruch H, Buhler E, Lopez C, Martin N, Guenet JL, Haase G. Progressive motor neuronopathy: a critical role of the tubulin chaperone TBCE in axonal tubulin routing from the Golgi apparatus. J Neurosci. 2007;27:8779–8789. doi: 10.1523/JNEUROSCI.1599-07.2007. [DOI] [PMC free article] [PubMed] [Google Scholar]
- Roper K, Gregory SL, Brown NH. The 'spectraplakins': cytoskeletal giants with characteristics of both spectrin and plakin families. J Cell Sci. 2002;115:4215–4225. doi: 10.1242/jcs.00157. [DOI] [PubMed] [Google Scholar]
- Bagri A, Tessier-Lavigne M. Neuropilins as Semaphorin receptors: in vivo functions in neuronal cell migration and axon guidance. Adv Exp Med Biol. 2002;515:13–31. [PubMed] [Google Scholar]
- Chen H, Bagri A, Zupicich JA, Zou Y, Stoeckli E, Pleasure SJ, Lowenstein DH, Skarnes WC, Chedotal A, Tessier-Lavigne M. Neuropilin-2 regulates the development of selective cranial and sensory nerves and hippocampal mossy fiber projections. Neuron. 2000;25:43–56. doi: 10.1016/S0896-6273(00)80870-3. [DOI] [PubMed] [Google Scholar]
- Quinn CC, Gray GE, Hockfield S. A family of proteins implicated in axon guidance and outgrowth. J Neurobiol. 1999;41:158–164. doi: 10.1002/(SICI)1097-4695(199910)41:1<158::AID-NEU19>3.0.CO;2-0. [DOI] [PubMed] [Google Scholar]
- Friocourt G, Koulakoff A, Chafey P, Boucher D, Fauchereau F, Chelly J, Francis F. Doublecortin functions at the extremities of growing neuronal processes. Cereb Cortex. 2003;13:620–626. doi: 10.1093/cercor/13.6.620. [DOI] [PubMed] [Google Scholar]
- Weiner JA, Koo SJ, Nicolas S, Fraboulet S, Pfaff SL, Pourquie O, Sanes JR. Axon fasciculation defects and retinal dysplasias in mice lacking the immunoglobulin superfamily adhesion molecule BEN/ALCAM/SC1. Mol Cell Neurosci. 2004;27:59–69. doi: 10.1016/j.mcn.2004.06.005. [DOI] [PubMed] [Google Scholar]
- Kleene R, Yang H, Kutsche M, Schachner M. The neural recognition molecule L1 is a sialic acid-binding lectin for CD24, which induces promotion and inhibition of neurite outgrowth. J Biol Chem. 2001;276:21656–21663. doi: 10.1074/jbc.M101790200. [DOI] [PubMed] [Google Scholar]
- Nishimura T, Fukata Y, Kato K, Yamaguchi T, Matsuura Y, Kamiguchi H, Kaibuchi K. CRMP-2 regulates polarized Numb-mediated endocytosis for axon growth. Nat Cell Biol. 2003;5:819–826. doi: 10.1038/ncb1039. [DOI] [PubMed] [Google Scholar]
- Salbaum JM, Kappen C. Cloning and expression of nope, a new mouse gene of the immunoglobulin superfamily related to guidance receptors. Genomics. 2000;64:15–23. doi: 10.1006/geno.2000.6114. [DOI] [PubMed] [Google Scholar]
- Chen Y, Aulia S, Li L, Tang BL. AMIGO and friends: an emerging family of brain-enriched, neuronal growth modulating, type I transmembrane proteins with leucine-rich repeats (LRR) and cell adhesion molecule motifs. Brain Res Brain Res Rev. 2006;51:265–274. doi: 10.1016/j.brainresrev.2005.11.005. [DOI] [PubMed] [Google Scholar]
- Wang Y, Lian L, Golden JA, Morrisey EE, Abrams CS. PIP5KI gamma is required for cardiovascular and neuronal development. Proc Natl Acad Sci USA. 2007;104:11748–11753. doi: 10.1073/pnas.0700019104. [DOI] [PMC free article] [PubMed] [Google Scholar]
- Adams NC, Tomoda T, Cooper M, Dietz G, Hatten ME. Mice that lack astrotactin have slowed neuronal migration. Development. 2002;129:965–972. doi: 10.1242/dev.129.4.965. [DOI] [PubMed] [Google Scholar]
- Grinnell AD. Dynamics of nerve-muscle interaction in developing and mature neuromuscular junctions. Physiol Rev. 1995;75:789–834. doi: 10.1152/physrev.1995.75.4.789. [DOI] [PubMed] [Google Scholar]
- Frank M, Kemler R. Protocadherins. Curr Opin Cell Biol. 2002;14:557–562. doi: 10.1016/S0955-0674(02)00365-4. [DOI] [PubMed] [Google Scholar]
- Junghans D, Haas IG, Kemler R. Mammalian cadherins and protocadherins: about cell death, synapses and processing. Curr Opin Cell Biol. 2005;17:446–452. doi: 10.1016/j.ceb.2005.08.008. [DOI] [PubMed] [Google Scholar]
- Poliak S, Gollan L, Martinez R, Custer A, Einheber S, Salzer JL, Trimmer JS, Shrager P, Peles E. Caspr2, a new member of the neurexin superfamily, is localized at the juxtaparanodes of myelinated axons and associates with K+ channels. Neuron. 1999;24:1037–1047. doi: 10.1016/S0896-6273(00)81049-1. [DOI] [PubMed] [Google Scholar]
- Missler M, Zhang W, Rohlmann A, Kattenstroth G, Hammer RE, Gottmann K, Sudhof TC. Alpha-neurexins couple Ca2+ channels to synaptic vesicle exocytosis. Nature. 2003;423:939–948. doi: 10.1038/nature01755. [DOI] [PubMed] [Google Scholar]
- Meng Y, Zhang Y, Tregoubov V, Janus C, Cruz L, Jackson M, Lu WY, MacDonald JF, Wang JY, Falls DL, Jia Z. Abnormal spine morphology and enhanced LTP in LIMK-1 knockout mice. Neuron. 2002;35:121–133. doi: 10.1016/S0896-6273(02)00758-4. [DOI] [PubMed] [Google Scholar]
- New HV, Mudge AW. Calcitonin gene-related peptide regulates muscle acetylcholine receptor synthesis. Nature. 1986;323:809–811. doi: 10.1038/323809a0. [DOI] [PubMed] [Google Scholar]
- Herz J, Chen Y. Reelin, lipoprotein receptors and synaptic plasticity. Nat Rev Neurosci. 2006;7:850–859. doi: 10.1038/nrn2009. [DOI] [PubMed] [Google Scholar]
- Groc L, Choquet D, Stephenson FA, Verrier D, Manzoni OJ, Chavis P. NMDA receptor surface trafficking and synaptic subunit composition are developmentally regulated by the extracellular matrix protein Reelin. J Neurosci. 2007;27:10165–10175. doi: 10.1523/JNEUROSCI.1772-07.2007. [DOI] [PMC free article] [PubMed] [Google Scholar]
- Bock HH, Jossin Y, Liu P, Forster E, May P, Goffinet AM, Herz J. Phosphatidylinositol 3-kinase interacts with the adaptor protein Dab1 in response to Reelin signaling and is required for normal cortical lamination. J Biol Chem. 2003;278:38772–38779. doi: 10.1074/jbc.M306416200. [DOI] [PubMed] [Google Scholar]
- Sanyal S, Sandstrom DJ, Hoeffer CA, Ramaswami M. AP-1 functions upstream of CREB to control synaptic plasticity in Drosophila. Nature. 2002;416:870–874. doi: 10.1038/416870a. [DOI] [PubMed] [Google Scholar]
- Miech C, Pauer HU, He X, Schwarz TL. Presynaptic local signaling by a canonical wingless pathway regulates development of the Drosophila neuromuscular junction. J Neurosci. 2008;28:10875–10884. doi: 10.1523/JNEUROSCI.0164-08.2008. [DOI] [PMC free article] [PubMed] [Google Scholar]
- Hino S, Kishida S, Michiue T, Fukui A, Sakamoto I, Takada S, Asashima M, Kikuchi A. Inhibition of the Wnt signaling pathway by Idax, a novel Dvl-binding protein. Mol Cell Biol. 2001;21:330–342. doi: 10.1128/MCB.21.1.330-342.2001. [DOI] [PMC free article] [PubMed] [Google Scholar]
- Heupel K, Sargsyan V, Plomp JJ, Rickmann M, Varoqueaux F, Zhang W, Krieglstein K. Loss of transforming growth factor-beta 2 leads to impairment of central synapse function. Neural Dev. 2008;3:25. doi: 10.1186/1749-8104-3-25. [DOI] [PMC free article] [PubMed] [Google Scholar]
- Paliwal S, Shi J, Dhru U, Zhou Y, Schuger L. P311 binds to the latency associated protein and downregulates the expression of TGF-beta1 and TGF-beta2. Biochem Biophys Res Commun. 2004;315:1104–1109. doi: 10.1016/j.bbrc.2004.01.171. [DOI] [PubMed] [Google Scholar]
- Tang Y, Katuri V, Dillner A, Mishra B, Deng CX, Mishra L. Disruption of transforming growth factor-beta signaling in ELF beta-spectrin-deficient mice. Science. 2003;299:574–577. doi: 10.1126/science.1075994. [DOI] [PubMed] [Google Scholar]
- Rawson JM, Lee M, Kennedy EL, Selleck SB. Drosophila neuromuscular synapse assembly and function require the TGF-beta type I receptor saxophone and the transcription factor Mad. J Neurobiol. 2003;55:134–150. doi: 10.1002/neu.10189. [DOI] [PubMed] [Google Scholar]
- Tian JH, Wu ZX, Unzicker M, Lu L, Cai Q, Li C, Schirra C, Matti U, Stevens D, Deng C. et al. The role of Snapin in neurosecretion: snapin knock-out mice exhibit impaired calcium-dependent exocytosis of large dense-core vesicles in chromaffin cells. J Neurosci. 2005;25:10546–10555. doi: 10.1523/JNEUROSCI.3275-05.2005. [DOI] [PMC free article] [PubMed] [Google Scholar]
- Varoqueaux F, Sons MS, Plomp JJ, Brose N. Aberrant morphology and residual transmitter release at the Munc13-deficient mouse neuromuscular synapse. Mol Cell Biol. 2005;25:5973–5984. doi: 10.1128/MCB.25.14.5973-5984.2005. [DOI] [PMC free article] [PubMed] [Google Scholar]
- Miyamoto S. Changes in mobility of synaptic vesicles with assembly and disassembly of actin network. Biochim Biophys Acta. 1995;1244:85–91. doi: 10.1016/0304-4165(94)00199-8. [DOI] [PubMed] [Google Scholar]
- Dresbach T, Qualmann B, Kessels MM, Garner CC, Gundelfinger ED. The presynaptic cytomatrix of brain synapses. Cell Mol Life Sci. 2001;58:94–116. doi: 10.1007/PL00000781. [DOI] [PMC free article] [PubMed] [Google Scholar]
- Fdez E, Hilfiker S. Vesicle pools and synapsins: new insights into old enigmas. Brain Cell Biol. 2006;35:107–115. doi: 10.1007/s11068-007-9013-4. [DOI] [PubMed] [Google Scholar]
- Allen PB, Greenfield AT, Svenningsson P, Haspeslagh DC, Greengard P. Phactrs 1-4: A family of protein phosphatase 1 and actin regulatory proteins. Proc Natl Acad Sci USA. 2004;101:7187–7192. doi: 10.1073/pnas.0401673101. [DOI] [PMC free article] [PubMed] [Google Scholar]
- Lonze BE, Ginty DD. Function and regulation of CREB family transcription factors in the nervous system. Neuron. 2002;35:605–623. doi: 10.1016/S0896-6273(02)00828-0. [DOI] [PubMed] [Google Scholar]
- Diaz-Ruiz C, Parlato R, Aguado F, Urena JM, Burgaya F, Martinez A, Carmona MA, Kreiner G, Bleckmann S, Del Rio JA. et al. Regulation of neural migration by the CREB/CREM transcription factors and altered Dab1 levels in CREB/CREM mutants. Mol Cell Neurosci. 2008;39:519–528. doi: 10.1016/j.mcn.2008.07.019. [DOI] [PubMed] [Google Scholar]
- Mantamadiotis T, Lemberger T, Bleckmann SC, Kern H, Kretz O, Martin Villalba A, Tronche F, Kellendonk C, Gau D, Kapfhammer J. et al. Disruption of CREB function in brain leads to neurodegeneration. Nat Genet. 2002;31:47–54. doi: 10.1038/ng882. [DOI] [PubMed] [Google Scholar]
- Thomas PS Jr, Fraley GS, Damian V, Woodke LB, Zapata F, Sopher BL, Plymate SR, La Spada AR. Loss of endogenous androgen receptor protein accelerates motor neuron degeneration and accentuates androgen insensitivity in a mouse model of X-linked spinal and bulbar muscular atrophy. Hum Mol Genet. 2006;15:2225–2238. doi: 10.1093/hmg/ddl148. [DOI] [PubMed] [Google Scholar]
- Chuaqui RF, Bonner RF, Best CJ, Gillespie JW, Flaig MJ, Hewitt SM, Phillips JL, Krizman DB, Tangrea MA, Ahram M. et al. Post-analysis follow-up and validation of microarray experiments. Nat Genet. 2002;32(Suppl):509–514. doi: 10.1038/ng1034. [DOI] [PubMed] [Google Scholar]
- Dallas PB, Gottardo NG, Firth MJ, Beesley AH, Hoffmann K, Terry PA, Freitas JR, Boag JM, Cummings AJ, Kees UR. Gene expression levels assessed by oligonucleotide microarray analysis and quantitative real-time RT-PCR -- how well do they correlate? BMC Genomics. 2005;6:59. doi: 10.1186/1471-2164-6-59. [DOI] [PMC free article] [PubMed] [Google Scholar]
- Rajeevan MS, Vernon SD, Taysavang N, Unger ER. Validation of array-based gene expression profiles by real-time (kinetic) RT-PCR. J Mol Diagn. 2001;3:26–31. doi: 10.1016/S1525-1578(10)60646-0. [DOI] [PMC free article] [PubMed] [Google Scholar]
- Rockett JC, Hellmann GM. Confirming microarray data--is it really necessary? Genomics. 2004;83:541–549. doi: 10.1016/j.ygeno.2003.09.017. [DOI] [PMC free article] [PubMed] [Google Scholar]
- Lu T, Pan Y, Kao SY, Li C, Kohane I, Chan J, Yankner BA. Gene regulation and DNA damage in the ageing human brain. Nature. 2004;429:883–891. doi: 10.1038/nature02661. [DOI] [PubMed] [Google Scholar]
- Herdegen T, Waetzig V. AP-1 proteins in the adult brain: facts and fiction about effectors of neuroprotection and neurodegeneration. Oncogene. 2001;20:2424–2437. doi: 10.1038/sj.onc.1204387. [DOI] [PubMed] [Google Scholar]
- Qiu Z, Ghosh A. A brief history of neuronal gene expression: regulatory mechanisms and cellular consequences. Neuron. 2008;60:449–455. doi: 10.1016/j.neuron.2008.10.039. [DOI] [PubMed] [Google Scholar]
- Siegmund KD, Connor CM, Campan M, Long TI, Weisenberger DJ, Biniszkiewicz D, Jaenisch R, Laird PW, Akbarian S. DNA methylation in the human cerebral cortex is dynamically regulated throughout the life span and involves differentiated neurons. PLoS ONE. 2007;2:e895. doi: 10.1371/journal.pone.0000895. [DOI] [PMC free article] [PubMed] [Google Scholar]
- Bjorkhem I, Meaney S. Brain cholesterol: long secret life behind a barrier. Arterioscler Thromb Vasc Biol. 2004;24:806–815. doi: 10.1161/01.ATV.0000120374.59826.1b. [DOI] [PubMed] [Google Scholar]
- Frank C, Rufini S, Tancredi V, Forcina R, Grossi D, D'Arcangelo G. Cholesterol depletion inhibits synaptic transmission and synaptic plasticity in rat hippocampus. Exp Neurol. 2008;212:407–414. doi: 10.1016/j.expneurol.2008.04.019. [DOI] [PubMed] [Google Scholar]
- Guirland C, Suzuki S, Kojima M, Lu B, Zheng JQ. Lipid rafts mediate chemotropic guidance of nerve growth cones. Neuron. 2004;42:51–62. doi: 10.1016/S0896-6273(04)00157-6. [DOI] [PubMed] [Google Scholar]
- Pfrieger FW. Cholesterol homeostasis and function in neurons of the central nervous system. Cell Mol Life Sci. 2003;60:1158–1171. doi: 10.1007/s00018-003-3018-7. [DOI] [PMC free article] [PubMed] [Google Scholar]
- Pfrieger FW. Role of cholesterol in synapse formation and function. Biochim Biophys Acta. 2003;1610:271–280. doi: 10.1016/S0005-2736(03)00024-5. [DOI] [PubMed] [Google Scholar]
- Suzuki S, Kiyosue K, Hazama S, Ogura A, Kashihara M, Hara T, Koshimizu H, Kojima M. Brain-derived neurotrophic factor regulates cholesterol metabolism for synapse development. J Neurosci. 2007;27:6417–6427. doi: 10.1523/JNEUROSCI.0690-07.2007. [DOI] [PMC free article] [PubMed] [Google Scholar]
- Corder EH, Saunders AM, Strittmatter WJ, Schmechel DE, Gaskell PC, Small GW, Roses AD, Haines JL, Pericak-Vance MA. Gene dose of apolipoprotein E type 4 allele and the risk of Alzheimer's disease in late onset families. Science. 1993;261:921–923. doi: 10.1126/science.8346443. [DOI] [PubMed] [Google Scholar]
- Sipione S, Rigamonti D, Valenza M, Zuccato C, Conti L, Pritchard J, Kooperberg C, Olson JM, Cattaneo E. Early transcriptional profiles in huntingtin-inducible striatal cells by microarray analyses. Hum Mol Genet. 2002;11:1953–1965. doi: 10.1093/hmg/11.17.1953. [DOI] [PubMed] [Google Scholar]
- Valenza M, Rigamonti D, Goffredo D, Zuccato C, Fenu S, Jamot L, Strand A, Tarditi A, Woodman B, Racchi M. et al. Dysfunction of the cholesterol biosynthetic pathway in Huntington's disease. J Neurosci. 2005;25:9932–9939. doi: 10.1523/JNEUROSCI.3355-05.2005. [DOI] [PMC free article] [PubMed] [Google Scholar]
- Wheal HV, Chen Y, Mitchell J, Schachner M, Maerz W, Wieland H, Van Rossum D, Kirsch J. Molecular mechanisms that underlie structural and functional changes at the postsynaptic membrane during synaptic plasticity. Prog Neurobiol. 1998;55:611–640. doi: 10.1016/S0301-0082(98)00026-4. [DOI] [PubMed] [Google Scholar]
- Eaton BA, Davis GW. LIM Kinase1 controls synaptic stability downstream of the type II BMP receptor. Neuron. 2005;47:695–708. doi: 10.1016/j.neuron.2005.08.010. [DOI] [PubMed] [Google Scholar]
- Chiang A, Priya R, Ramaswami M, Vijayraghavan K, Rodrigues V. Neuronal activity and Wnt signaling act through Gsk3-{beta} to regulate axonal integrity in mature Drosophila olfactory sensory neurons. Development. 2009;136:1273–1282. doi: 10.1242/dev.031377. [DOI] [PMC free article] [PubMed] [Google Scholar]
- Rodrigues Hell RC, Silva Costa MM, Goes AM, Oliveira AL. Local injection of BDNF producing mesenchymal stem cells increases neuronal survival and synaptic stability following ventral root avulsion. Neurobiol Dis. 2009;33:290–300. doi: 10.1016/j.nbd.2008.10.017. [DOI] [PubMed] [Google Scholar]
- Adkins DL, Boychuk J, Remple MS, Kleim JA. Motor training induces experience-specific patterns of plasticity across motor cortex and spinal cord. J Appl Physiol. 2006;101:1776–1782. doi: 10.1152/japplphysiol.00515.2006. [DOI] [PubMed] [Google Scholar]
- Dorlochter M, Irintchev A, Brinkers M, Wernig A. Effects of enhanced activity on synaptic transmission in mouse extensor digitorum longus muscle. J Physiol. 1991;436:283–292. doi: 10.1113/jphysiol.1991.sp018550. [DOI] [PMC free article] [PubMed] [Google Scholar]
- Ferraiuolo L, De Bono JP, Heath PR, Holden H, Kasher P, Channon KM, Kirby J, Shaw PJ. Transcriptional response of the neuromuscular system to exercise training and potential implications for ALS. J Neurochem. 2009;109:1714–1724. doi: 10.1111/j.1471-4159.2009.06080.x. [DOI] [PubMed] [Google Scholar]
- Lexell J, Downham DY. The occurrence of fibre-type grouping in healthy human muscle: a quantitative study of cross-sections of whole vastus lateralis from men between 15 and 83 years. Acta Neuropathol. 1991;81:377–381. doi: 10.1007/BF00293457. [DOI] [PubMed] [Google Scholar]
- Frey D, Schneider C, Xu L, Borg J, Spooren W, Caroni P. Early and selective loss of neuromuscular synapse subtypes with low sprouting competence in motoneuron diseases. J Neurosci. 2000;20:2534–2542. doi: 10.1523/JNEUROSCI.20-07-02534.2000. [DOI] [PMC free article] [PubMed] [Google Scholar]
- Santos AF, Caroni P. Assembly, plasticity and selective vulnerability to disease of mouse neuromuscular junctions. J Neurocytol. 2003;32:849–862. doi: 10.1023/B:NEUR.0000020628.36013.88. [DOI] [PubMed] [Google Scholar]
- Dupuis L, Gonzalez de Aguilar JL, Echaniz-Laguna A, Eschbach J, Rene F, Oudart H, Halter B, Huze C, Schaeffer L, Bouillaud F, Loeffler JP. Muscle mitochondrial uncoupling dismantles neuromuscular junction and triggers distal degeneration of motor neurons. PLoS ONE. 2009;4:e5390. doi: 10.1371/journal.pone.0005390. [DOI] [PMC free article] [PubMed] [Google Scholar]
- Maselli RA, Wollman RL, Leung C, Distad B, Palombi S, Richman DP, Salazar-Grueso EF, Roos RP. Neuromuscular transmission in amyotrophic lateral sclerosis. Muscle Nerve. 1993;16:1193–1203. doi: 10.1002/mus.880161109. [DOI] [PubMed] [Google Scholar]
- Fischer LR, Culver DG, Tennant P, Davis AA, Wang M, Castellano-Sanchez A, Khan J, Polak MA, Glass JD. Amyotrophic lateral sclerosis is a distal axonopathy: evidence in mice and man. Exp Neurol. 2004;185:232–240. doi: 10.1016/j.expneurol.2003.10.004. [DOI] [PubMed] [Google Scholar]
- Pun S, Santos AF, Saxena S, Xu L, Caroni P. Selective vulnerability and pruning of phasic motoneuron axons in motoneuron disease alleviated by CNTF. Nat Neurosci. 2006;9:408–419. doi: 10.1038/nn1653. [DOI] [PubMed] [Google Scholar]
- Arendt T, Bruckner MK. Linking cell-cycle dysfunction in Alzheimer's disease to a failure of synaptic plasticity. Biochim Biophys Acta. 2007;1772:413–421. doi: 10.1016/j.bbadis.2006.12.005. [DOI] [PubMed] [Google Scholar]
- Scarmeas N, Shih T, Stern Y, Ottman R, Rowland LP. Premorbid weight, body mass, and varsity athletics in ALS. Neurology. 2002;59:773–775. doi: 10.1212/wnl.59.5.773. [DOI] [PubMed] [Google Scholar]
- Harwood CA, McDermott CJ, Shaw PJ. Physical activity as an exogenous risk factor in motor neuron disease (MND): A review of the evidence. Amyotroph Lateral Scler. 2009. pp. 1–14. [DOI] [PubMed]
- Chancellor AM, Slattery JM, Fraser H, Warlow CP. Risk factors for motor neuron disease: a case-control study based on patients from the Scottish Motor Neuron Disease Register. J Neurol Neurosurg Psychiatry. 1993;56:1200–1206. doi: 10.1136/jnnp.56.11.1200. [DOI] [PMC free article] [PubMed] [Google Scholar]
- Kawata S, Trzaskos JM, Gaylor JL. Microsomal enzymes of cholesterol biosynthesis from lanosterol. Purification and characterization of delta 7-sterol 5-desaturase of rat liver microsomes. J Biol Chem. 1985;260:6609–6617. [PubMed] [Google Scholar]