

Abstract
Epigenetic in vitro and in vivo studies suggest that suppressor of cytokine signaling-2 (SOCS2) may normally limit tumorigenesis in the intestine; however, this theory has not been directly tested. We hypothesized that SOCS2 deficiency promotes spontaneous intestinal tumorigenesis in ApcMin/+ mice. Therefore, we quantified tumor number, size, and load in the small intestine and colon using SOCS2+/+/ApcMin/+, SOCS2+/−/ApcMin/+, and SOCS2−/−/ApcMin/+ mice and assayed hematocrit as an indirect marker of disease severity. Biochemical and histological assays were used to assess mechanisms. Heterozygous and homozygous disruption of SOCS2 alleles promoted 166 and 441% increases in tumor load in the small intestine, respectively, accelerated development of colon tumors, and caused severe anemia. SOCS2 deletion promoted significant increases in intestinal insulin-like growth factor-I mRNA but did not affect plasma insulin-like growth factor-I. Western blots and immunohistochemical analysis demonstrated that tumor and nontumor intestinal tissue of SOCS2−/−/ApcMin/+ mice had increased serine 727 phosphorylation of signal transducer and activator of transcription 3 compared with SOCS2+/+/ApcMin/+ mice. Moreover, electromobility shift assays showed that SOCS2 deletion did not alter signal transducer and activator of transcription 3 DNA binding. However, tumors and small intestine from SOCS2−/−/ApcMin/+ showed dramatic increases in activator protein-1 (AP-1) DNA binding, and SOCS2 overexpression in vitro reduced levels of AP-1. These studies indicate that SOCS2 deletion promotes the spontaneous development of intestinal tumors driven by mutations in the adenomatous polyposis coli/β-catenin pathway and activates AP-1. Therefore, reduced expression or epigenetic silencing of SOCS2 may serve as a useful biomarker for colorectal cancer risk.
The suppressor of cytokine signaling (SOCS) family of proteins consists of SOCS1 through SOCS8 and cytokine-inducible SH2-containing protein.1 SOCS proteins were initially discovered as negative regulators of cytokine signaling via the janus kinase (JAK) and signal transducers and activators of transcription (STAT) pathway.1 Activated STATs form homo- and heterodimers and later translocate into the nucleus where they mediate gene transcription, proliferation, cell survival, and transformation.2 Cytokine receptor-mediated JAK-STAT activation induces the expression of SOCS, which inhibits or terminates cytokine signaling by inhibiting JAK activation, competing with STATs or other signaling proteins for binding sites on cytokine receptors and by targeting signaling proteins for proteosomal degradation.1
SOCS2 has been found to exert negative feedback effects on growth hormone (GH) signaling. SOCS2−/− mice show enhanced body growth that is phenotypically similar to that in GH-transgenic mice and is reversed when GH is genetically inactivated, demonstrating a key role of SOCS2 in negatively regulating GH-induced body overgrowth.3 However, our recent studies indicate novel effects of SOCS2 deletion in the intestine whereby SOCS2−/− mice show enhanced growth-promoting effects of insulin-like growth factor-I (IGF-I) as well as GH. SOCS2−/− mice infused with IGF-I have significantly greater increases in the mucosal mass of the small bowel compared with wild-type littermates, establishing a role for SOCS2 in regulating the potency of action of IGF-I.4 These studies also show that SOCS2 deficiency enhances the proliferative and antiapoptotic actions of IGF-I in the small intestine and colon, along with the ability of IGF-I to activate STAT3. Other studies in intestinal epithelial or colon cancer cell lines have demonstrated that SOCS2 directly binds to the type I IGF-I receptor and limits its activation by IGF-I.4,5 Disruption of one SOCS2 allele in mice expressing a GH transgene was found to enhance transgene-induced increases in body weight and mucosal mass, to enhance colon and jejunal crypt proliferation, and to promote the formation of hyperplastic and lymphoid polyps in the colon.6 Although hyperplastic and lymphoid polyps are generally considered benign,7 this was novel in vivo evidence that SOCS2 may negatively regulate aberrant growth in the intestine in a model of GH and IGF-I excess. However, the role of SOCS2 in development of spontaneous precancerous adenomas in the intestine has not been established.
Limited evidence in cancers of other organs suggests that the SOCS2 gene may be epigenetically silenced by hypermethylation of CpG islands within the promoter.8,9,10,11,12 In patients with melanoma, SOCS2 has been found to be silenced by methylation and its transcription is reduced in primary tumor samples.9 High SOCS2 expression inversely correlates with tumor grade of breast cancers and favors a good prognosis.13 Another study in breast carcinoma samples showed that SOCS2 protein expression is positively correlated with low-grade tumors.11 Although these studies in primary human tumors and cancer cell lines suggest a potential role of SOCS2 in suppressing tumor growth, this theory has not been directly evaluated in an in vivo model of intestinal cancer.
The current study tested whether SOCS2 gene disruption enhances spontaneous intestinal tumor formation in ApcMin/+ mice. The ApcMin/+ mouse model is widely used to study mediators and mechanisms that govern the initiation, establishment, and progression of intestinal tumors.14 ApcMin/+ mice are heterozygous for a mutation that results in a truncated form of APC, a gene frequently mutated in human colon cancer that leads to aberrant activation of the β-catenin pathway.15 An adenomatous polyposis coli (APC)-containing complex normally degrades cytoplasmic β-catenin.16 In the absence of APC, β-catenin accumulates in the nucleus and coactivates the transcription of proliferative and prosurvival genes in conjunction with T-cell factor/lymphoid enhancer factor transcription factors.17 Depending on the genetic background, ApcMin/+ mice develop tens to hundreds of spontaneous adenomas in the small intestine and fewer adenomas in the colon, both of which typically arise due to focal loss of the remaining wild-type Apc allele.14 We cross-bred SOCS2−/− and ApcMin/+ mice to test the hypothesis that disruption of one or both SOCS2 alleles will increase tumor number or size in ApcMin/+ mice. Studies in our laboratory have shown that ex vivo treatment with IGF-I in the intestine induces STAT3 DNA binding activity, and this effect is enhanced and prolonged in SOCS2−/− mice.4 Therefore, we postulated that loss of SOCS2 could increase activation of STAT3, which is increasingly linked to normal growth and tumorigenesis in the intestine.18 STAT3 is activated by tyrosine phosphorylation, which permits the formation of STAT3 homo- or heterodimers with other STATs as well as DNA binding activity. STAT3 is also serine-phosphorylated, and serine phosphorylation has recently been linked to activator protein-1 (AP-1) activation, cell proliferation, and transformation in cancer cell lines.19,20,21 Our studies demonstrate that SOCS2 gene deletion in ApcMin/+ mice enhanced serine but not tyrosine phosphorylation of STAT3, especially in tumors, and this was associated with increased AP-1 but not STAT3 binding activity. Together, these findings provide in vivo evidence that SOCS2 deletion promotes ApcMin/+ tumorigenesis, and this is associated with novel effects on serine phosphorylation of STAT3 and AP-1 activation.
Materials and Methods
Laboratory Animals
ApcMin/+ male mice on the C57BL/6 background were purchased from The Jackson Laboratory (Bar Harbor, ME). C57BL/6 mice with targeted disruption of both SOCS2 alleles were developed as described previously and provided by Dr. Christopher Greenhalgh (Glaxo Smith Kline, Melbourne, Australia).22 To generate SOCS2 knockout mice on the ApcMin/+ background, SOCS2+/− mice were cross-bred with ApcMin/+ mice, and SOCS2+/−/ApcMin/+ male progeny were bred with SOCS2+/− females to generate ApcMin/+ mice with SOCS2−/−, SOCS2+/−, or SOCS2+/+ genotypes. Genotyping was performed on tail DNA as described previously.4,23 Age-matched ApcMin/+ male and female mice with different SOCS2 genotypes were studied for number and size of tumors. Our studies emphasized female ApcMin/+ mice because male ApcMin/+ mice were primarily used as breeders as female ApcMin/+ mice exhibit complications during pregnancy.24 The Institutional Animal Care and Use Committee of the University of North Carolina approved all animal studies. Study protocols were in compliance with the Guide for the Care and Use of Laboratory Animals published by the National Institutes of Health.25
Sample Preparation and Tumor and Blood Measurements
At least six age-matched mice of each genotype were studied at 13 to 17 weeks of age. Animals were weighed and anesthetized, and blood was collected by cardiac puncture. The entire colon was dissected. The small intestine was dissected and separated into three segments roughly equal in length. Each intestinal segment was flushed with PBS supplemented with vanadate (2 mmol/L), phenylmethanesulfonyl fluoride (1 mmol/L), and phosphatase inhibitor cocktail (diluted 1:100, P2850, Sigma-Aldrich, St. Louis, MO). Intestinal segments were splayed open onto 3MM Whatman paper and fixed in 10% zinc-formalin (Fisher Scientific, Pittsburgh, PA) overnight at 4°C and then were dehydrated in 70% ethanol. Numbers of adenomas in the small and large intestines of each animal were counted under a Leica dissecting scope, using an in-lens micrometer to measure adenoma diameter. A portion (2–3 cm) of the proximal ileum was flash-frozen for RNA isolation. For immunohistochemical analysis, intestinal segments were rolled into a pinwheel, paraffin-embedded, and sectioned at 5 μm. Embedding was performed by the Center for Gastrointestinal Biology and Disease Histology Core Facility. The presence and morphology of adenomas were confirmed by H&E staining and by immunohistochemical analysis for β-catenin. Because ApcMin/+ mice develop severe anemia as polyposis progresses, hematocrit was measured as an indirect marker of tumor load and disease severity26; measurement was performed by the Animal Clinical Chemistry Core Facility at the University of North Carolina.
Immunohistochemical Analysis
Dewaxed and rehydrated sections underwent epitope retrieval in Reveal Decloaker (Biocare Medical, Concord, CA) and endogenous peroxidase activity was blocked with 3% H2O2. Sections were incubated in normal blocking serum either from a Vectastain ABC Kit (Vector Laboratories, Burlingame, CA) for rabbit antibodies or from a M.O.M. Kit (BD Transduction Laboratories, Franklin Lakes, NJ) for mouse antibodies. Sections were incubated overnight with mouse monoclonal antibody to β-catenin (BD Transduction Laboratories), rabbit anti-pS727-STAT3 (Cell Signaling, Beverly, MA), or rabbit anti-STAT3 (Cell Signaling). Bound antibody was detected with a Vector Elite Kit or biotinylated anti-mouse IgG (Vector Laboratories), followed by diaminobenzidine substrate. Tissues were counterstained with hematoxylin. Primary antibody was omitted as a negative control. Sections from both SOCS2+/+/ApcMin/+ and SOCS2−/−/ApcMin/+ mice were stained on the same slide, and all slides for a particular antibody were stained in the same batch. Sections were examined on a Axio Imager A1 (Carl Zeiss, Jena, Germany), and photographs were taken using AxioCam MRc5 and associated AxioVision software (version 4.6). Comparisons were made between sections from pairs of SOCS2+/+/ApcMin/+ and SOCS2−/−/ApcMin/+ mice mounted on the same slide. Brightness and contrast of photographs were selected to maximize the clarity for publication.
Plasma IGF-I Assay
IGF-I was measured by enzyme-linked immunosorbent assay, which was performed by the Center for Gastrointestinal Biology and Disease Immunotechnology Core at the University of North Carolina-Chapel Hill on plasma that was acid-ethanol extracted and cryoprecipitated to remove IGF-I binding proteins as described previously.6,27 A Mouse IGF-I Quantikine ELISA kit (R&D Systems, Minneapolis, MN) was used, according to the manufacturer’s protocols, except that samples were diluted 1:500.
Quantitative RT-PCR
Total RNA was extracted from frozen ileum from at least five mice per genotype using TRIzol reagents and standard methods (Invitrogen, Carlsbad, CA). The concentration was determined by a NanoDrop system (Thermo Scientific, Wilmington, DE). Aliquots of each RNA sample were run on a 1% agarose gel to verify RNA integrity and concentration. RNA (4 μg) was DNase-treated using the TURBO DNA-free Kit (Ambion, Foster City, CA) and transcribed into cDNA with AMV-Reverse Transcriptase (Promega, Madison, WI). A no-RT control was also generated for each sample.
To quantify IGF-I mRNA, an SYBR Green-based real-time PCR (SYBR Green JumpStart Taq ReadyMix, Sigma-Aldrich) was used with the following primers for mouse IGF-I: forward 5′-GTGTGGACCGAGGGGCTTTTACTTC-3′ and reverse 5′-GCTTCAGTGGGGCACAGTACATCTC-3′. To measure c-Fos and c-Jun mRNA, TaqMan Gene Expression Assays (Applied Biosystems, Foster City, CA) were used according to the manufacturer’s protocol (c-Fos, Mm_00487425_m1; c-Jun, Mm_00495062_s1). Mouse hydroxymethylbilane synthase mRNA was also quantified as an invariant control using mouse SYBR Green primers (forward 5′-TGTGTTGCACGATCCTGAAAC-3′ and reverse 5′-CTCCTTCCAGGTGCCTCAGAA-3′) or a TaqMan Assay (Mm_01143545_m1). A standard curve was generated from dilutions (1 × 10⁷–1 × 10³ copies/μl) of a PCR product using conditions optimized for each primer or primer-probe set. DNA sequencing was performed by the University of North Carolina-Chapel Hill Genomic Analysis Facility to confirm the correct sequence of the PCR product. A no-template control was included in each run as a negative control as well as a standard to normalize the standard curve across runs. A cDNA pool generated from intestine and liver RNA from multiple mice was added to each run to control interrun variability. A melt was performed after each run to confirm that a single product was generated. Reactions were run on the Rotor-Gene 2000 (Corbett Research, Sydney, Australia) and analyzed with Rotor-Gene Software 6.0.14. Data for each sample were calculated as absolute copy number based on comparison of test sample data with a standard curve and normalized to hydroxymethylbilane synthase.
Nuclear Extracts and Immunoblotting
In a subset of SOCS2+/+/ApcMin/+ and SOCS2−/−/ApcMin/+ mice, tumors were finely dissected under a dissecting scope from the middle third of the small intestine (∼12 cm in length), and tissue was immediately used for extraction of nuclear proteins. Size-matched biopsy samples of grossly normal, tumor-free intestinal mucosa were also dissected for comparison. Tumor or nontumor samples were homogenized using a Dounce homogenizer in 1 ml of ice-cold 1× Tris-buffered saline supplemented with vanadate (2 mmol/L) and phenylmethanesulfonyl fluoride (1 mmol/L). Nuclear proteins were extracted as described previously.28 Concentration was determined by a Bradford assay using Coomassie Plus reagent (Pierce Chemicals, Rockford, IL) and confirmed by examining samples on an SDS-polyacrylamide gel using the NuPAGE gel system (Invitrogen). Gels were visualized and analyzed using the LI-COR Odyssey Infrared Imaging System (version 3.0, LI-COR Biosciences, Lincoln, NE).
Western Immunoblotting
Equal amounts of protein (30 μg) were size-fractionated on a 4 to 12% TEO-CI SDS-polyacrylamide gel (PAGEgel, Fisher Scientific) and transferred onto a nitrocellulose membrane (Bio-Rad Laboratories, Hercules, CA) using a NuPAGE gel system. After blocking in Blocker Casein in PBS (Pierce), blots were incubated with primary antibodies against phospho-serine 727 (pS727)-STAT3, phospho-tyrosine 705 (pY705)-STAT3 (Cell Signaling), total STAT3 (Santa Cruz Biotechnology, Inc., Santa Cruz, CA), or histone H1 (Santa Cruz Biotechnology) for 16 hours at 4°C. Blots were washed in PBS containing 0.1% Tween and incubated with secondary antibodies conjugated to DyLight800 for ∼1 hour at room temperature. Immunoreactive proteins were visualized and analyzed using the LI-COR Odyssey Infrared Imaging system. Densitometry was performed on visualized bands, and results were normalized to the total protein gel.
Electromobility Shift and Supershift Assays
DNA-protein binding reactions were performed in a 20-μl total volume containing 100 mmol/L NaCl, binding buffer [20% glycerol, 1 mmol/L MgCl2, 1 mmol/L EDTA, 0.5 mmol/L dithiothreitol, and 0.2 ng of poly(dI:dC)], 20 to 30 μg of nuclear protein extract, and 100,000 to 400,000 cpm of a 32P-labeled double-stranded oligomer corresponding to a consensus STAT3 binding site (STAT3-RE, Santa Cruz Biotechnology) or consensus AP-1 binding site (AP-1-RE, Promega). Binding was performed at room temperature for 20 minutes. For cold competition, an excess of unlabeled oligomer that was specific to either AP-1 or STAT3 or unrelated oligomer specific to the T-cell factor (TCF) DNA response element (S: 5′-GGTAAGATCAAAGGG 3′, Integrated DNA Technologies Inc., Coralville, IA).29 Samples were then loaded onto nondenaturing 4% polyacrylamide gels and electrophoresed in 0.5 × TBE (1× = 89 mmol/L Tris borate, pH 8.0, and 2 mmol/L EDTA) for 2 to 3 hours. After electrophoresis, gels were dried on 3MM Whatman paper and exposed to PhosphorImager screens. Screens were viewed on the Typhoon 6400 scanner (GE Healthcare, Piscataway, NJ). The intensity of the shifted DNA-STAT3 and DNA-AP-1 complexes was quantified using Image-Quant Software v1.2 and is expressed as a percentage of values in nontumor samples for SOCS2+/+/ApcMin/+ mice, which was set as 100%.
Supershift assays were performed to establish the composition of AP-1 binding activity according to methods published previously.28 Antibodies used for Supershift assays were obtained from Santa Cruz Biotechnologies. Each supershift reaction included equal amounts of nuclear extract and 6 μg of one of the following antibodies: rabbit antibodies specific for c-Jun, JunD, or c-Fos or mouse antibody specific for phospho-c-Jun (p-c-Jun, phosphorylated at serine 63). Nuclear extracts were incubated for 30 minutes at room temperature followed by the addition of γ-32P-labeled AP-1 oligomer and further incubated for 20 minutes. Samples were analyzed on 4% nondenaturing polyacrylamide gels as described above for electromobility shift assay (EMSA). Intensities of supershifted complexes were quantified using ImageQuant Software v1.2.
SOCS2 Overexpression in IEC-6 Cells
IEC-6 cells infected with SOCS2-expressing adenovirus or empty virus were used as a simple in vitro system to confirm the in vivo findings that SOCS2 affects AP-1 binding activity. IEC-6 cells are a nontransformed intestinal epithelial cell line previously shown to exhibit robust AP-1 activation in response to combined IGF-I and epidermal growth factor (EGF).30 IEC-6 cells at 80% confluence were infected with either FLAG-tagged SOCS2 (Ad-SOCS2) or empty control adenovirus (Ad-Empty) in 10-cm2 dishes as described previously.4 In brief, growth medium plus fetal bovine serum was removed, and serum-free medium (SFM) containing the appropriate virus at a multiplicity of 100 viral particles/cell was added. Twenty-four hours after infection, fresh SFM or SFM plus recombinant human (rh) IGF-I (20 ng/ml, Genentech, South San Francisco, CA) and rhEGF (5 ng/ml, Sigma-Aldrich) was added for 0, 15, and 30 minutes. Cells were scraped, and nuclear extracts were prepared as described above. AP-1 binding activity was assessed by EMSA and supershift assay as described above. Data were quantified as a percentage of the values in Ad-Empty infected cells in SFM alone.
Statistical Analyses
Values for average adenoma number, size, and tumor load and hematocrit are expressed as means ± SEM. Analysis of variance was used to compare data derived from ApcMin/+ mice, which have SOCS2+/+, SOCS2+/−, or SOCS2−/− genotypes to determine whether there was a significant effect of SOCS2 deletion. Plasma IGF-I and IGF-I, c-Jun, and c-Fos mRNA data were compared between SOCS2+/+/ApcMin/+ and SOCS2−/−/ApcMin/+ mice by Student’s t-test. Densitometry data for STAT3 and AP-1 DNA binding in tumor versus nontumor tissue of SOCS2+/+/ApcMin/+ and SOCS2−/−/ApcMin/+ mice were analyzed by analysis of variance. Pairwise comparisons were performed using Fisher’s exact test. Densitometry results for AP-1 DNA binding in in vitro studies were compared between Ad-SOCS2 and Ad-Empty infected cells using Student’s t-test. A value of P < 0.05 was considered statistically significant. Statistical tests were performed using Statview 4.1.
Results
Disruption of Both SOCS2 Alleles Modestly Affects Body Weight
SOCS2−/− mice have a body overgrowth phenotype.3 We determined whether SOCS2−/− mice retained this phenotype when cross-bred onto the ApcMin/+ line. SOCS2+/+/ApcMin/+ mice had a final body weight of 21.4 ± 0.4 g at sacrifice. Loss of one SOCS2 allele had no significant effect on body weight (21.8 ± 0.3 g). However, SOCS2−/−/ApcMin/+ mice had body weights of 27.8 ± 2.6 g, representing a significant 29.6% increase in final body weight (P < 0.05).
SOCS2 Gene Disruption Dramatically Increases ApcMin/+ Tumorigenesis
Small Intestine
Figure 1A shows representative images of tumors in small intestine of ApcMin/+ mice with SOCS2+/+, SOCS2+/−, or SOCS2−/− genotypes. Quantitative data for tumor number, size, and total tumor burden (number × size) are shown in Figure 1 for the entire small intestine (Figure 1B) and different regions of the small intestine (Figure 1C). Compared with SOCS2+/+/ApcMin/+ mice, SOCS2−/−/ApcMin/+ mice showed significant and dramatic increases in total tumor number and tumor size, together representing a 441% increase in overall tumor burden in the small intestine. ApcMin/+ mice with disruption of one SOCS2 allele showed an intermediate phenotype with a significant increase in tumor number and tumor size (Figure 1B). This result suggests that SOCS2 has a gene-dosage effect on ApcMin/+ tumorigenesis. Examination of different regions of the small intestine revealed that SOCS2−/−/ApcMin/+ mice showed significant increases in tumor number, size, and load in all segments (Figure 1C). Although a trend for increased tumor number and size was observed in all small bowel regions of SOCS2+/−/ApcMin/+ mice, this increase was statistically significant only for tumor number in the most distal small bowel segment.
Figure 1.

SOCS2 gene disruption in ApcMin/+ mice increases tumor number and size in the small intestine. A: Representative gross images of adenomas in small intestine of SOCS2+/+/ApcMin/+, SOCS2+/−/ApcMin/+, and SOCS2−/−/ApcMin/+ mice taken under a dissecting scope with white light optics underneath the specimen. Original magnification, × 12.3. B: Histograms show means ± SE for tumor number (top), size (middle), and load (number × size)(bottom) in the entire small intestine. C: Means ± SE for tumor number, size, and load in different regions of the small intestine. SI-1 is the first third of the small intestine that contains the duodenum and is most proximal, whereas SI-3 contains the ileum and is most distal. *P < 0.05 versus SOCS2+/+/ApcMin/+ mice; **P < 0.05 versus SOCS2+/−/ApcMin/+.
Colon
SOCS2 gene disruption in ApcMin/+ mice also had a dramatic effect on tumor number and size in colon. By 13 to 17 weeks of age, 100% of SOCS2−/−/ApcMin/+ mice (six of six) and 71% of SOCS2+/−/ApcMin/+ (five of seven) mice had at least one colon tumor, whereas only one of six SOCS2+/+/ApcMin/+ mice studied (17%) had an observable colon tumor. Figure 2A shows representative images of colon tumors, and Figure 2B shows quantitative data for tumor number and size. These analyses revealed significant increases in tumor number, size, and burden in colon of SOCS2−/−/ApcMin/+ mice compared with those in SOCS2+/+/ApcMin/+. As was seen with the small intestine, SOCS2+/−/ApcMin/+ showed an intermediate phenotype.
Figure 2.

SOCS2 gene disruption in ApcMin/+ mice increases tumor number and size in the colon. A: Representative gross images of colon adenomas of female SOCS2+/+/ApcMin/+, SOCS2+/−/ApcMin/+, and SOCS2−/−/ApcMin/+ mice at 13 to 17 weeks of age taken under a dissecting scope. Original magnification, × 12.3. Colon tumors from female mice are shown because they demonstrated the greatest increases in tumor size compared with age-matched female SOCS2+/+/ApcMin/+. At this time, 17% of age- and sex-matched SOCS2+/+/ApcMin/+mice had colon tumors, whereas 71% of SOCS2+/−/ApcMin/+ and 100% of SOCS2−/−/ApcMin/+ mice had tumors. The small lesions visible in SOCS2+/+/ApcMin/+ colon were determined to be lymphoid aggregates. B: Histograms show means ± SE for tumor number (top), tumor size (middle), and tumor load (bottom) in colon. *P < 0.05 versus SOCS2+/+/ApcMin/+ mice by analysis of variance.
We used hematocrit as an indirect measure of tumor burden. Consistent with increases in tumor burden, we found that SOCS2+/+/ApcMin/+ mice had hematocrit within normal range (34.2 ± 5.9%), SOCS2−/−/ApcMin/+ mice had significant reductions in hematocrit (22.4 ± 5.3%, P < 0.05), and SOCS2+/−/ApcMin/+ mice had an intermediate hematocrit (29.5 ± 7.7%). Further studies compared SOCS2+/+/ApcMin/+ and SOCS2−/−/ApcMin/+ mice, in which the most dramatic changes in tumor number and size were observed.
β-Catenin Immunostaining
Tumor development in ApcMin/+ mice is driven by focal loss of heterozygosity of the Apc gene.14 This leads to translocation of β-catenin from the lateral membranes of the epithelium to the nucleus where it promotes gene transcription. In the normal small intestine of both SOCS2+/+/ApcMin/+ and SOCS2−/−/ApcMin/+ mice, β-catenin was detected at the lateral and basement membranes of epithelial cells along the villi and in cell membranes and some nuclei in the crypts (Figure 3A). Adenomas in the small intestine of both SOCS2+/+/ApcMin/+and SOCS2−/−/ApcMin/+mice showed positive nuclear and cytoplasmic staining for β-catenin in epithelial-like cells of adenomas, but no obvious differences in staining intensity or nuclear localization were observed (Figure 3B). Colon adenomas in SOC2−/−/ApcMin/+ mice were positive for nuclear and cytoplasmic β-catenin, indicating activated β-catenin signaling (Figure 3C). Because so few SOCS2+/+/ApcMin/+mice develop colon tumors, β-catenin was not analyzed. The data confirm that increased nuclear β-catenin occurs in adenomas of both SOCS2+/+/ApcMin/+ and SOCS2−/−/ApcMin/+ mice but provide no evidence that loss of SOCS2 enhances nuclear β-catenin accumulation.
Figure 3.

Tumors of SOCS2+/+/ApcMin/+ and SOCS2−/−/ApcMin/+ mice are positive for nuclear β-catenin. Representative histological images. A: Grossly normal small intestine of SOCS2+/+/ApcMin/+ and SOCS2−/−/ApcMin/+ mice immunostained for β-catenin. Original magnification: ×20 (top); ×40 (bottom). B: β-Catenin-positive adenomas in the small intestine of SOCS2+/+/ApcMin/+ and SOCS2−/−/ApcMin/+ mice. Original magnification: ×5 (top); ×40 (bottom). C: Adenoma in the colon of a SOCS2−/−/ApcMin/+ mouse positive for β-catenin immunostaining. Original magnification: ×5 (top); ×40 (bottom). Scale bar = 200 μm unless otherwise noted.
SOCS2−/−/ApcMin/+ Mice Show Increased IGF-I Expression in the Small Intestine but No Elevation in Plasma IGF-I
We used real-time PCR to assess whether the enhanced tumorigenesis in the small intestine of SOCS2−/−/ApcMin/+ mice was associated with increases in local IGF-I mRNA. Figure 4A shows that, compared with the liver, which is the major target of GH-induced IGF-I expression, the small intestine expresses relatively low amounts of IGF-I mRNA. As shown in Figure 4B, SOCS−/−/ApcMin/+ mice had small but statistically significant 1.5 fold increases in IGF-I mRNA in the ileum. In contrast, plasma IGF-I levels did not differ significantly in SOCS2+/+/ApcMin/+ and SOCS2+/+/ApcMin/+ mice (Figure 4C). These data indicate that disruption of both SOCS2 alleles in ApcMin/+ mice promotes increased local intestinal IGF-I expression, without affecting circulating IGF-I.
Figure 4.

Homozygous SOCS2 gene disruption increases local intestinal IGF-I expression, but not plasma IGF-I. A and B: Real-time PCR was performed on RNA extracted from wild-type liver and small intestine (ileum) or entire ileum from SOCS2+/+ or SOCS2−/− mice carrying the ApcMin/+ mutation. Absolute copy number was calculated from Ct values for either IGF-I or hydroxymethylbilane synthase using a standard curve. Histograms show the relative expression (means ± SE) of three runs for IGF-I/hydroxymethylbilane synthase. A: Histogram shows fold change of IGF-I expression in the liver relative to the small intestine. n ≥ 3. Note that expression in the liver is ∼45-fold higher compared with that the small intestine. aP < 0.05 versus SOCS2+/+/wild-type. B: Histograms show IGF-I expression in ileal RNA from SOCS2−/−/ApcMin/+ mice relative to SOCS2+/+/ApcMin/+ mice analyzed in the same run. *P < 0.05 versus SOCS2+/+/ApcMin/+. C: Enzyme-linked immunosorbent assay for plasma IGF-I levels (means ± SE) in SOCS2+/+/ApcMin/+ and SOCS2−/−/ApcMin/+ mice. Binding proteins were removed before detection of IGF-I. Samples were run in duplicate, n > 4.
SOCS2 Gene Disruption Promotes Serine Phosphorylation but Not Tyrosine Phosphorylation of STAT3 in ApcMin/+ Mice
In normal intestine, SOCS2 gene disruption has previously been linked to enhanced IGF-I-induced STAT3 DNA binding activity.4 Therefore, we examined whether grossly normal mucosa (nontumor) or dissected tumors of SOCS2+/+/ApcMin/+ or SOCS2−/−/ApcMin/+ mice showed altered levels of nuclear tyrosine-phosphorylated STAT3 (pY705), which is integral to STAT3 DNA binding activity, and compared this with levels of serine-phosphorylated STAT3 (pS727). Surprisingly, levels of pY705-STAT3 did not differ in tumors or nontumor tissue from SOCS2−/−/ApcMin/+ versus SOCS2+/+/ApcMin/+ mice (Figure 5). However, the immunoreactive pY705-STAT3 in SOCS2−/−/ApcMin/+ tumors was an obvious doublet, most likely due to concurrent serine phosphorylation. Western immunoblot of the same samples revealed that pS727-STAT3 was upregulated in nontumor tissue from SOCS2−/−/ApcMin/+ mice and especially tumors of SOCS2−/−/ApcMin/+ mice, showing an overall 2.5 ± 0.45-fold increase in pS727-STAT3 (P < 0.05) (Figure 5). When analyzed across multiple blots, total STAT3 did not significantly differ in tumor and nontumor tissues between SOCS2+/+/ApcMin/+ and SOCS2−/−/ApcMin/+ mice (Figure 5).
Figure 5.

Tumors of SOCS2−/−/ApcMin/+ mice show increased serine phosphorylation of STAT3. Western blots on nuclear extracts from either normal intestine or a pool of tumors from the small intestine of SOCS2+/+/ApcMin/+ or SOCS2−/−/ApcMin/+ mice. Duplicate blots were immunoblotted for pY705-STAT or pS727-STAT3. Blots were then reprobed for histone H1 (H1), a nuclear protein used as a loading control, or total STAT3. Shown are reprobes for H1 on the pY705 blot and total STAT3 on the pS727 blot. Protein stain of nuclear proteins is shown in the bottom panel to demonstrate equal loading. A ∼86 kDa band was detected by both the pY and pS-STAT3 antibodies, although a doublet was apparent in the tumor samples with the pY705 antibody, most likely due to serine phosphorylation of STAT3. Overall, no difference in pY705-STAT3 was detected between SOCS2+/+/ApcMin/+ (100 ± 9%) and SOCS2−/−/ApcMin/+(108 ± 10%) (values normalized to the H1 control). SOCS2−/−/ApcMin/+ mice had a significant increase in serine phosphorylation (normalized to total STAT3) compared with SOCS2+/+/ApcMin/+ mice (258 ± 45% versus 100 ± 23%, P < 0.05). Although total STAT3 appeared elevated in tumors of SOCS2−/−/ApcMin/+ on this representative blot, across multiple blots and independent samples (n = 5), there was no significant difference in total STAT3 between SOCS2+/+/ApcMin/+ and SOCS2−/−/ApcMin/+ mice (tumor, 1.13 ± 0.06 versus 1.15 ± 0.06; nontumor, 1.00 ± 0.05 versus 1.00 ± 0.08).
To confirm increased serine phosphorylation of STAT3 in the tumors of SOCS2−/−/ApcMin/+ mice, we performed immunohistochemical analysis on small intestine and colon. In SOCS2+/+/ApcMin/+ mice, pS727-STAT3 immunoreactivity was barely detectable except at the base of the crypts (Figure 6A). Immunostaining revealed dramatic increases in pS727-STAT3 in the nucleus and cytoplasm of crypt and villus epithelial cells in the normal small intestine of SOCS2−/−/ApcMin/+ mice (Figure 6A). Serine-phosphorylated-STAT3 was detectable in the adenomas of SOCS2+/+/ApcMin/+ mice. However, small intestine adenomas of SOCS2−/−/ApcMin/+ mice showed dramatic increases in pS727-STAT3 in the cytoplasm and nucleus (Figure 6B). Intense staining of pS727-STAT3 was also detected in colon adenomas from SOCS2−/−/ApcMin/+ (Figure 6C). In addition, we examined total STAT3 by immunohistochemistry and detected strong staining throughout the epithelium in the normal intestine that did not differ between SOCS2+/+/ApcMin/+ and SOCS2−/−/ApcMin/+ (Figure 6D). Compared with nontumor tissue, tumors from both SOCS2+/+/ApcMin/+ and SOCS2−/−/ApcMin/+ mice showed stronger cytosolic and nuclear STAT3 immunostaining but, in contrast to pS727-STAT3 immunostaining, there was no dramatic difference in total STAT3 in SOCS2−/−/ApcMin/+ versus SOCS2+/+/ApcMin/+ tumors (Figures 6, E and F). These studies suggest that deletion of SOCS2 genes promotes serine 727 phosphorylation of STAT3 in intestinal epithelium and that this is further enhanced in small intestine and colon tumors.
Figure 6.

Increased pS727-STAT3 but not total STAT3 immunostaining in SOCS2−/−/ApcMin/+ mice. Representative images of tissue sections from SOCS2+/+/ApcMin/+ and SOCS2−/−/ApcMin/+ mice immunostained for pS727-STAT3 (A–C) or total STAT3 (D–F). A–C: Immunostaining for pS727-STAT3. A: Normal small intestine from SOCS2+/+/ApcMin/+ or SOCS2−/−/ApcMin/+ mice. Original magnification: ×20 (top); ×40 (bottom). B: Small intestine adenoma from SOCS2+/+/ApcMin/+ and SOCS2−/−/ApcMin/+ mice. Original magnification: ×10 (top); ×40 (bottom). C: Colon adenoma from SOCS2−/−/ApcMin/+ mouse. Original magnification: ×5 (top); ×40 (bottom). D–F: Immunostaining for total STAT3. D: Jejunum. Original magnification, ×20. E: Small intestine adenoma from SOCS2+/+/ApcMin/+or SOCS2−/−/ApcMin/+mice. Original magnification: ×10. F: Colon adenoma from SOCS2−/−/ApcMin/+ mouse. Original magnification: ×5. Scale bars = 50 μm unless otherwise noted.
SOCS2 Deficiency Enhances AP-1 but Not STAT3 DNA Binding
Because serine phosphorylation of STAT3 was increased in the tumors of SOCS2−/−/ApcMin/+ mice, we tested whether this increase was associated with changes in STAT3 DNA binding activity. STAT3 DNA binding activity was evaluated in nuclear extracts from pooled tumors and matched biopsies of grossly normal intestine from SOCS2+/+/ApcMin/+ and SOCS2−/−/ApcMin/+ mice. As shown in Figure 7A, tumor or nontumor samples from SOCS2+/+ and SOCS2−/− carrying the ApcMin/+ mutation had multiple STAT3 DNA binding complexes. Tumors from both SOCS2+/+/ApcMin/+ and SOCS2−/−/ApcMin/+ mice showed a trend for increased STAT3 DNA binding activity relative to nontumor tissue, but this achieved statistical significance only when tumor and nontumor tissues of SOCS2−/−/ApcMin/+ mice were compared (Figure 7B). Surprisingly, however, there was no difference in STAT3 DNA binding activity in tumor or nontumor tissues of SOCS2−/−/ApcMin/+ mice compared with those of SOCS2+/+/ApcMin/+ mice (Figure 7B). Thus, loss of SOCS2 did not significantly increase overall STAT3 binding activity as might have been expected.
Figure 7.
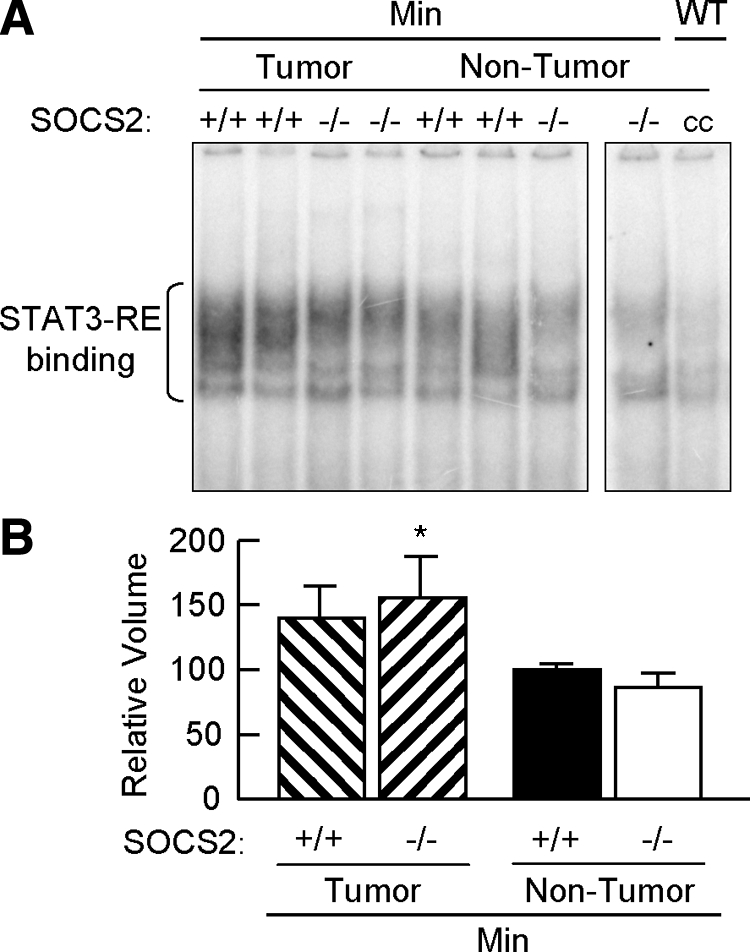
SOCS2 gene disruption does not increase nuclear STAT3 DNA binding activity in ApcMin/+ mice. A: Autoradiogram of EMSA for nuclear binding activity to a STAT3 DNA binding sequence in either tumors or grossly normal small intestine of SOCS2+/+/ApcMin/+ and SOCS−/−/ApcMin/+ mice. cc, inhibition of DNA-protein binding complexes by an excess of unlabeled oligomer. Both panels are from the same blot. Multiple DNA-protein binding complexes were detected with the STAT3 response element. WT, wild-type; cc, cold competition. B: Densitometric analysis of STAT3 DNA binding complexes. Results show means ± SE for intensity of DNA-protein complexes from three independent experiments expressed as a percentage of the SOCS2+/+/ApcMin/+ nontumor samples. *P < 0.05 versus nontumor tissue from SOCS2−/−/ApcMin/+ mice.
Because phosphorylation of serine 727 of STAT3 has been linked to AP-1 activation in tumor cell lines, we analyzed whether SOCS2 deletion affected nuclear AP-1 DNA binding. This analysis revealed enhanced AP-1 binding activity in nontumor tissues and particularly in tumor tissue of SOCS2−/−/ApcMin/+ compared with those of SOCS+/+/ApcMin/+ (Figure 8A). The results of three independent experiments were quantified using densitometric volume analysis and demonstrated significant increases in AP-1 DNA binding activity in the tumors of the SOC2−/−/ApcMin/+ mice compared with both tumor and nontumor tissue from SOCS2+/+/ApcMin/+ mice (Figure 8B).
Figure 8.
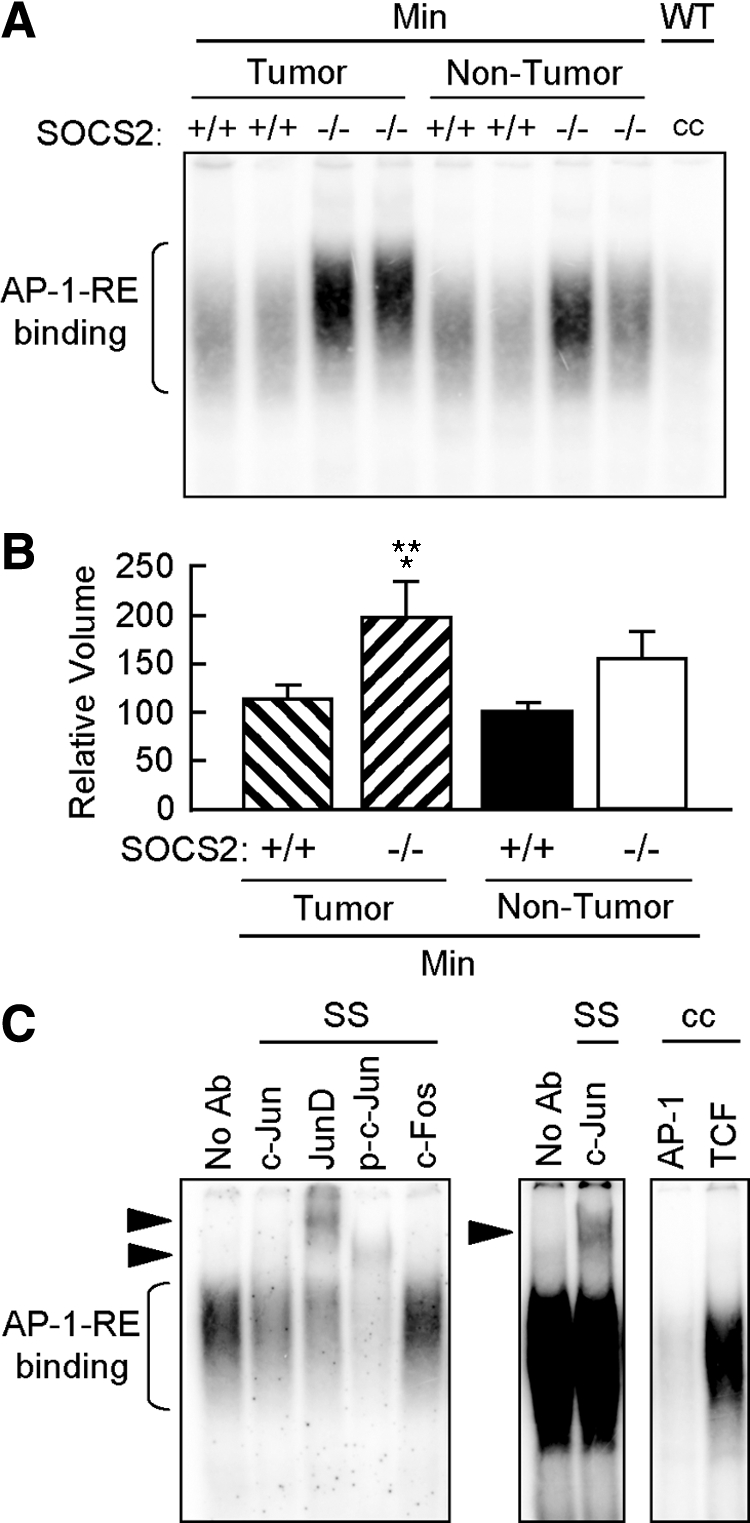
SOCS2 gene disruption promotes increased nuclear AP-1 DNA binding activity in ApcMin/+ mice. A: Autoradiogram of EMSA for nuclear binding activity to an AP-1 DNA binding sequence in either tumors or grossly normal small intestine of SOCS2+/+/ApcMin/+ and SOCS2−/−/ApcMin/+ mice. cc, inhibition of shifted complexes by an excess of unlabeled oligomer. B: Densitometric analysis of AP-1 DNA binding complex. Results show means ± SE for intensity of AP-1 DNA binding complexes expressed as a percentage of the SOCS2+/+/ApcMin/+ nontumor samples run on the same gel (n = 3 independent experiments). *P < 0.05 versus SOCS2+/+/ApcMin/+ nontumor tissue; **P < 0.05 versus SOCS2+/+/ApcMin/+ tumor tissue by analysis of variance. C: Autoradiograms of supershift (SS) assays and cold competition (cc) specificity controls on pooled tumors from SOCS−/−/ApcMin/+ mice. Arrowheads, supershifted complexes. Left panel, supershifted complexes for JunD, p-c-Jun, and c-Jun. Middle panel, image intensity was increased to visualize c-Jun supershifted complex. Right panel, cold competition with excess of unlabeled AP-1 oligomer and no inhibition of AP-1 binding with an unrelated oligomer corresponding to the TCF binding site. No Ab, no antibody.
To verify the specificity of enhanced AP-1 DNA binding activity in SOCS2−/−/ApcMin/+ mice, we performed supershift analysis for c-Jun, JunD, and phosphorylated c-Jun and c-Fos, as well as competition with unlabeled AP-1 oligomer versus an unrelated oligomer (TCF consensus sequence). As shown in Figure 8C, AP-1 DNA binding complexes in tumors from SOCS2−/−/ApcMin/+ mice showed supershifted complexes with JunD, p-c-Jun, and c-Jun antibodies and showed specific competition with AP-1 but not TCF oligomers. Antibodies to c-Fos did not elicit a supershifted complex or major shift inhibition (ie, a reduction in the intensity of the DNA-protein complex). Thus, the enhanced AP-1 DNA binding activity in tumors from SOCS2−/−/ApcMin/+ mice contains primarily p-c-Jun, JunD, and c-Jun. Supershifted complexes were lower in intensity in nontumor samples, yet qualitatively similar in composition (Supplemental Figure 1, see http://ajp.amjpathol.org).
To assess whether the enhanced AP-1 DNA binding activity reflected increased expression of c-Jun or c-Fos, we quantified mRNA using quantitative real-time PCR. This revealed no significant difference in c-Fos or c-Jun between SOCS2−/−/ApcMin/+ (c-Fos, 1.20 ± 0.45; c-Jun, 1.09 ± 0.10) versus SOCS2+/+/ApcMin/+ (c-Fos, 1.0 ± 0.3; c-Jun 1.0 ± 0.1).
SOCS2 Overexpression Reduced AP-1 DNA Binding in IEC-6 Cells
Previous studies from our laboratory have demonstrated that IGF-I and EGF act synergistically to promote proliferation of IEC-6 cells and induce AP-1 transcriptional activity greater than that of either alone.30 We therefore used this in vitro system to directly test whether SOCS2 affects AP-1. As shown in Figure 9, IGF-I and EGF induced AP-1 binding activity in IEC-6 cells and SOCS2 overexpression significantly attenuated growth factor-induced AP-1 DNA binding (Figure 9, A and B). This finding complements the in vivo data in SOCS2−/−/ApcMin/+ mice, providing additional evidence that SOCS2 affects AP-1 transcriptional activity in intestinal epithelial cells. Supershift analysis demonstrated that the AP-1 complex in untreated or IGF/EGF-treated IEC-6 cells contained c-Jun, JunD, and p-c-Jun, as observed in SOCS2−/−/ApcMin/+ tumors. Growth factor treatment increased the intensity of the p-c-Jun supershifted complex (Figure 9C). Supershifted complexes were uniformly lower in intensity in SOCS2-overexpressing cells (Figure 9C), but the relative percentage of AP-1 binding represented by JunD, phosphorylated c-Jun, and c-Jun was similar between empty vector and SOCS2-overexpressing cells (Figure 9C). This result indicates that SOCS2 down-regulates all Jun isoforms within AP-1 DNA binding complexes to an approximately similar extent.
Figure 9.

Overexpression of SOCS2 reduces nuclear AP-1 DNA binding activity in IEC-6 cells. A: Representative autoradiogram of EMSA with radiolabeled AP-1 oligomer on nuclear extracts from IEC-6 cells infected with either Ad-Empty or Ad-SOCS2. Cells were treated with SFM alone (0) or combined rhIGF-I (20 ng/ml) and rhEGF (5 ng/ml) (I + E) for 15 or 30 minutes. cc, cold competition; S, unlabeled AP-1 oligomer; NS, unrelated TCF oligomer. B: Densitometric analysis of AP-1 DNA binding complex. Results show means ± SE for intensity of AP-1 DNA binding complex expressed as a percentage of the Ad-Empty in SFM alone (n = 3 independent experiments). *P < 0.05 versus Ad-Empty; **P < 0.05 versus no treatment. C: Autoradiogram of supershift (SS) assays on extracts from Ad-Empty or Ad-SOCS2-infected IEC-6 cells treated with SFM (left panel) or IGF-I and EGF for 30 minutes (right panel). Arrowheads, supershifted complexes with JunD, p-c-Jun, and c-Jun antibodies relative to the no antibody (no Ab) control. Numbers at the bottom indicate the percentage of JunD, p-c-Jun, or c-Jun in the AP-1 DNA protein complex (assessed as intensity supershifted band/intensity shifted complex in the no antibody control × 100) in each treatment group. Note that although the intensity of supershifted complexes is lower in Ad-SOCS2 versus Ad-Empty cells, the relative proportions of JunD, p-c-Jun, or c-Jun in AP-1 complexes are similar. Thus, SOCS2 overexpression reduces all Jun isoforms within the AP-1 complexes.
Discussion
Our studies show that disruption of both SOCS2 alleles in ApcMin/+ mice dramatically increases tumor number and tumor size in the small intestine and colon. We found these increases to be associated with increased local intestinal IGF-I expression. Serine phosphorylation of STAT3 was increased in the tumors of SOCS2−/−/ApcMin/+ mice and, to a lesser extent, in grossly normal intestine of SOCS2−/−/ApcMin/+mice. Neither tyrosine phosphorylation of STAT3 nor STAT3 DNA binding activity was enhanced by SOCS2 gene deletion. The protumorigenic effects of SOCS2 gene disruption were, however, associated with enhanced AP-1 DNA binding activity in the tumors of SOCS2−/−/ApcMin/+ mice, when the AP-1 complex contained c-Jun, phosphorylated c-Jun, and JunD. Overexpression of SOCS2 in IEC-6 cells reduced AP-1 DNA binding, with an approximately equal reduction in c-Jun, phosphorylated c-Jun, and JunD.
The increases in tumor number in SOCS2−/−/ApcMin/+ mice occurred across all regions of the small intestine, with maximal effects in the most distal regions. Effects of SOCS2 deletion on tumor size were less dramatic, but represent a significant finding because most modifiers of ApcMin/+ tumorigenesis alter tumor number but not size.31 Our findings, therefore, suggest that loss of SOCS2 affects the rate of tumor growth as well as the number of initiated tumors or their survival and are strongly supported by data in the colon of SOCS2−/−/ApcMin/+mice. Very few SOCS2+/+/ApcMin/+mice developed colon tumors at the time studied. In contrast, 100% of SOCS2−/−/ApcMin/+mice and 71% of SOCS2+/−/ApcMin/+mice developed colon tumors by 13 to 17 weeks, and tumor size was increased in colon as observed in small intestine. The current findings in the ApcMin/+ model are consistent with our prior findings that loss of one SOCS2 allele in GH-transgenic mice promotes benign colon polyps.6 However, to our knowledge, this current study is the first to demonstrate that deletion of one or both SOCS2 alleles promotes spontaneous precancerous lesions that are driven by aberrant β-catenin activation, a pathway that is dysregulated in many human intestinal tumors. This finding suggests that epigenetic SOCS2 silencing may be relevant to colon cancer risk in humans.
A number of studies have shown that SOCS2 genes are epigenetically inactivated by hypermethylation of CpG islands within the promoter region of biopsy samples from primary human tumors or cancer cell lines from a number of organs, including prostate, melanoma, breast, ovary, and endometrium, and this inactivation correlates with reduced SOCS2 expression.8,9,10,11,12 Other SOCS genes, including SOCS1 and SOCS3, have also been shown to be hypermethylated in Barrett’s adenocarcinoma.32 SOCS1 is hypermethylated in breast cancer biopsy samples and in glioblastoma cells.33,34 SOCS3 is also methylated in glioblastoma cells, and hypermethylation of SOCS3 is associated with an unfavorable clinical outcome.33 However, relatively few studies have shown a functional role for SOCS in tumor development or growth in vivo. Mice with SOCS3 deleted specifically in liver parenchymal cells exhibited increased tumor development when treated with the carcinogen diethylnitrosamine.35 Deletion of SOCS3 specifically in intestinal epithelial cells led to greater tumor load in the azoxymethane/dextran sodium sulfate mouse model of inflammation-induced colon cancer.36 This finding indicates a role for SOCS3 in normally limiting inflammation-associated colon cancer. Our current data in SOCS2−/−/ApcMin/+mice indicate that endogenous SOCS2 normally limits the development of tumors that derive from dysregulated β-catenin, a pathway that is integral to the development of many human colon cancers. To date, the relative roles of SOCS2 compared with those of SOCS1 or SOCS3 in tumor development have not been formally compared in the same animal model of intestinal tumorigenesis. In this regard, preliminary findings in the azoxymethane/dextran sodium sulfate model provided no evidence that SOCS2 gene disruption affects tumor number or load (SOCS2+/+, 2.2 ± 0.6; SOCS2−/−, 2.9 ± 0.4; n = 5) in this model of inflammation-associated colon cancer. Although more study is needed, this finding suggests that SOCS2 and SOCS3 should be compared as potentially useful biomarkers of the risk of human colon tumors driven by two distinct and major initiating factors: activation of β-catenin or inflammation.
Our findings suggest some novel regulatory mechanisms by which SOCS2 deletion may promote ApcMin/+-mediated intestinal tumorigenesis. We initially assessed local IGF-I because SOCS2 gene deletion was shown to increase local IGF-I gene expression in some tissues22 and to increase GH-stimulated, local IGF-I expression in the intestine.4,6 Our findings demonstrate modest upregulation of local IGF-I expression in SOCS2−/−/ApcMin/+ intestine, which may contribute to enhanced tumor load. IGF-I signaling has been reported to enhance stability, nuclear localization, and transcriptional activation of β-catenin.37,38 This enhancement is thought to occur through insulin receptor substrate-1, which is an immediate downstream mediator of IGF-I receptor signaling.37,38 However, observations that tumors from SOCS2+/+/ApcMin/+and SOCS2−/−/ApcMin/+mice show comparable increases in β-catenin accumulation argue against a major effect of SOCS2 deletion or accompanying increases in local IGF-I on β-catenin activation or accumulation, at least at the stage of tumor development examined. We note that increased local IGF-I expression in the intestine of SOCS2−/−/ApcMin/+ was not accompanied by an elevation in plasma IGF-I. This finding consistent with prior findings in SOCS2−/−/ApcMin/+ mice3,6 and suggests that SOCS2 gene disruption has a preferential impact on local intestinal IGF-I expression rather than on circulating IGF-I levels.
We examined the STAT3 pathway because of our prior findings that SOCS2−/− mice show enhanced IGF-I-induced STAT3 activation in normal intestine.4 STAT3 activation is frequently associated with colon cancer in a setting of chronic inflammation.39,40,41 Recent studies demonstrated that specific STAT3 deletion in intestinal epithelial cells reduces tumor multiplicity in ApcMin/+ mice.42 Phosphorylation of STAT3 at tyrosine residue 705 is required for dimerization, nuclear translocation, and DNA binding.20,43 Unexpectedly, we found similar levels of tyrosine-phosphorylated STAT3 in normal small intestine tissue and tumors from SOCS2−/−/ApcMin/+compared with those in SOCS2+/+/ApcMin/+mice, and our studies revealed an increase in serine 727-phosphorylated STAT3 in SOCS2−/−/ApcMin/+ mice. Serine-phosphorylated STAT3 localized to epithelial cells in normal intestine and to tumors in SOCS2−/−/ApcMin/+mice. The increased pS727-STAT3 in SOCS2−/−/ApcMin/+ compared with that in SOCS2+/+/ApcMin/+ mice observed by Western immunoblot was independently confirmed by immunohistochemistry. This result is intriguing because a series of recent articles has demonstrated upregulation of pS727-STAT3 in mammary gland tumors44 and in a number of tumor cell lines including ras-transformed fibroblasts, bladder and lung tumor cell lines,21 and medullary thyroid tumor cell lines.19 Studies using prostate cancer cell lines have shown that a phosphomimetic mutation of serine727 to a glutamine promoted anchorage-independent growth, invasion, and, in xenograft models, increased tumor numbers.45 These effects were reversed by an un-phosphorylatable STAT3 mutant.45 In another study, mutation of serine727 in STAT3 to an alanine decreased postnatal growth and survival in mice lacking one functional STAT3 allele.46 This decrease correlated with reduced circulating GH and IGF-I.46 Together, these studies provide evidence that serine phosphorylation of STAT3 may regulate normal and neoplastic growth. Our current findings add novel evidence that loss of SOCS2 preferentially enhances pS727-STAT3 in the intestine in vivo, and this is associated with dramatically increased intestinal tumor development and growth in animals carrying an inactivating Apc mutation.
The role of pS727-STAT3 in DNA binding and transcriptional activation of STAT3 is not fully defined. Prior studies have linked pS727-STAT3 to reduced tyrosine phosphorylation and transcriptional activation of STAT3.47,48 Other reports indicate that serine phosphorylation of STAT3 does not affect DNA binding.49 More recent studies indicate that there are context-, cytokine- and growth factor-dependent differences in serine phosphorylation versus tyrosine phosphorylation of STAT3.19,20,50,51,52 Importantly, a recent report in medullary thyroid carcinoma cell lines demonstrated that pS727-STAT3 is essential to transcriptional activation of AP-1 DNA binding activity.19 This finding is consistent with the current observations that nuclear AP-1 DNA binding activity is dramatically upregulated in tumors from SOCS2−/−/ApcMin/+ mice. Our findings that SOCS2−/−/ApcMin/+ mice show enhanced AP-1 DNA binding activity but no detectable increase in c-Fos or c-Jun mRNA indicate that loss of SOCS2 promotes activation of AP-1 rather than increased synthesis of AP-1 components. Furthermore, supershift data indicate that the AP-1 binding complex in SOCS2−/−/ApcMin/+ mice contains primarily c-Jun and particularly phosphorylated c-Jun and JunD. These results were complemented with in vitro studies in IEC-6 cells, demonstrating that adenoviral overexpression of SOCS2 reduced basal and growth factor-stimulated AP-1 DNA binding activity with approximately equal inhibitory effects on c-Jun, phosphorylated c-Jun, and JunD. This finding is intriguing because recent studies suggest that Jun proteins are strongly expressed in tumors of mice with specific activation of β-catenin in intestinal epithelium.53 Activation of c-Jun N-terminal kinase, which mediates c-Jun phosphorylation at serine 63, was also shown to activate TCF4/β-catenin gene targets and increase crypt proliferation.54 These studies provide indirect evidence to support a concept that the enhanced AP-1 activity observed here in SOCS2−/−/ApcMin/+ may contribute to the increased tumorigenesis. Additional studies will be required to fully delineate the mechanisms by which loss of SOCS2 expression promotes serine phosphorylation of STAT3 and AP-1 DNA binding activity, their possible causal connection, and their functional roles in enhanced tumorigenesis in SOCS2−/−/ApcMin/+ mice. However, our findings provide novel evidence that SOCS2 normally serves as a suppressor of ApcMin/+ tumorigenesis in intestine and acts on pathways other than tyrosine phosphorylation of STAT3.
In summary, the results from our study suggest that SOCS2 gene deletion promotes tumor initiation and progression in the ApcMin/+ model of spontaneous intestinal cancer driven by β-catenin activation and that this is associated with local increases in IGF-I, serine phosphorylation of STAT3, and AP-1 activation but not increased tyrosine phosphorylation of STAT3. These studies provide novel evidence that SOCS2 normally limits tumor growth in both the small intestine and colon and suggest that reduced expression or epigenetic silencing of SOCS2 and activation of pS727-STAT3 or AP-1 may be potential biomarkers for intestinal tumor development and growth in a setting of APC mutation or β-catenin activation.
Acknowledgments
We thank Dr. Christopher Greenhalgh and Douglas Hilton for provision of the SOCS2 null mice. We thank Genentech (South San Francisco, CA) for the generous gift of recombinant human IGF-I. We thank Dr. Kathleen Caron for use of the Leica microscope for tumor measurements. We thank Drs. Michael Helmrath and Christopher Dekaney for training and use of the Zeiss microscope. We acknowledge useful comments on this study from Dr. David Threadgill.
Footnotes
Address reprint requests to Victoria A. Newton, B.S. Applied Biology, or Dr. P. Kay Lund, Ph.D., CB#7545, Departments of Cell and Molecular Physiology, University of North Carolina at Chapel Hill, Chapel Hill, NC 27599-7545. E-mail: victoria_newton@med.unc.edu or empk@med.unc.edu.
Supported by the National Institute of Diabetes and Digestive and Kidney Diseases (grant DK-40247 to P.K.L.), the National Cancer Institute (predoctoral training grant CA-72319 to N.M.R.), and the University of North Carolina Cancer Research Fund. This work was assisted by the Center for Gastrointestinal Biology and Disease (CGIBD) Molecular Histopathology Core, Carlton Anderson of the CGIBD Immunotechnology Core (National Institute of Diabetes and Digestive and Kidney Diseases grant P30-DK-34987), and the DNA Synthesis Core of the Lineberger Cancer Center (CA-16086).
Supplemental material for this article can be found on http://ajp.amjpathol.org.
References
- Greenhalgh CJ, Miller ME, Hilton DJ, Lund PK. Suppressors of cytokine signaling: relevance to gastrointestinal function and disease. Gastroenterology. 2002;123:2064–2081. doi: 10.1053/gast.2002.37068. [DOI] [PubMed] [Google Scholar]
- Turkson J, Jove R. STAT proteins: novel molecular targets for cancer drug discovery. Oncogene. 2000;19:6613–6626. doi: 10.1038/sj.onc.1204086. [DOI] [PubMed] [Google Scholar]
- Greenhalgh CJ, Rico-Bautista E, Lorentzon M, Thaus AL, Morgan PO, Willson TL, Zervoudakis P, Metcalf D, Street I, Nicola NA, Nash AD, Fabri LJ, Norstedt G, Ohlsson C, Flores-Morales A, Alexander WS, Hilton DJ. SOCS2 negatively regulates growth hormone action in vitro and in vivo. J Clin Invest. 2005;115:397–406. doi: 10.1172/JCI22710. [DOI] [PMC free article] [PubMed] [Google Scholar]
- Michaylira CZ, Simmons JG, Ramocki NM, Scull BP, McNaughton KK, Fuller CR, Lund PK. Suppressor of cytokine signaling-2 limits intestinal growth and enterotrophic actions of IGF-I in vivo. Am J Physiol Gastrointest Liver Physiol. 2006;291:G472–G481. doi: 10.1152/ajpgi.00218.2005. [DOI] [PubMed] [Google Scholar]
- Miller ME, Michaylira CZ, Simmons JG, Ney DM, Dahly EM, Heath JK, Lund PK. Suppressor of cytokine signaling-2: a growth hormone-inducible inhibitor of intestinal epithelial cell proliferation. Gastroenterology. 2004;127:570–581. doi: 10.1053/j.gastro.2004.05.016. [DOI] [PubMed] [Google Scholar]
- Michaylira CZ, Ramocki NM, Simmons JG, Tanner CK, McNaughton KK, Woosley JT, Greenhalgh CJ, Lund PK. Haplotype insufficiency for suppressor of cytokine signaling-2 enhances intestinal growth and promotes polyp formation in growth hormone-transgene mice. Endocrinology. 2006;147:1632–1641. doi: 10.1210/en.2005-1241. [DOI] [PubMed] [Google Scholar]
- Markowitz AJ, Winawer SJ. Management of colorectal polyps. CA Cancer J Clin. 1997;47:93–112. doi: 10.3322/canjclin.47.2.93. [DOI] [PubMed] [Google Scholar]
- Fiegl H, Gattringer C, Widschwendter A, Schneitter A, Ramoni A, Sarlay D, Gaugg I, Goebel G, Müller HM, Mueller-Holzner E, Marth C, Widschwendter M. Methylated DNA collected by tampons—a new tool to detect endometrial cancer. Cancer Epidemiol Biomarkers Prev. 2004;13:882–888. [PubMed] [Google Scholar]
- Marini A, Mirmohammadsadegh A, Nambiar S, Gustrau A, Ruzicka T, Hengge UR. Epigenetic inactivation of tumor suppressor genes in serum of patients with cutaneous melanoma. J Invest Dermatol. 2006;126:422–431. doi: 10.1038/sj.jid.5700073. [DOI] [PubMed] [Google Scholar]
- Sutherland KD, Lindeman GJ, Choong DY, Wittlin S, Brentzell L, Phillips W, Campbell IG, Visvader JE. Differential hypermethylation of SOCS genes in ovarian and breast carcinomas. Oncogene. 2004;23:7726–7733. doi: 10.1038/sj.onc.1207787. [DOI] [PubMed] [Google Scholar]
- Farabegoli F, Ceccarelli C, Santini D, Taffurelli M. Suppressor of cytokine signaling 2 (SOCS-2) expression in breast carcinoma. J Clin Pathol. 2005;58:1046–1050. doi: 10.1136/jcp.2004.024919. [DOI] [PMC free article] [PubMed] [Google Scholar]
- Lund PK, Rigby RJ. SOC-ing it to tumors: tumor suppressors of cytokine signaling as tumor repressors. Gastroenterology. 2006;131:317–319. doi: 10.1053/j.gastro.2006.05.030. [DOI] [PubMed] [Google Scholar]
- Haffner MC, Petridou B, Peyrat JP, Revillion F, Muller-Holzner E, Daxenbichler G, Marth C, Doppler W. Favorable prognostic value of SOCS2 and IGF-I in breast cancer. BMC Cancer. 2007;7:136–144. doi: 10.1186/1471-2407-7-136. [DOI] [PMC free article] [PubMed] [Google Scholar]
- Taketo MM. Mouse models of gastrointestinal tumors. Cancer Sci. 2006;97:355–361. doi: 10.1111/j.1349-7006.2006.00190.x. [DOI] [PMC free article] [PubMed] [Google Scholar]
- Su LK, Kinzler KW, Vogelstein B, Preisinger AC, Moser AR, Luongo C, Gould KA, Dove WF. Multiple intestinal neoplasia caused by a mutation in the murine homolog of the APC gene. Science. 1992;256:668–670. doi: 10.1126/science.1350108. [DOI] [PubMed] [Google Scholar]
- Yang J, Zhang W, Evans PM, Chen X, He X, Liu C. Adenomatous polyposis coli (APC) differentially regulates β-catenin phosphorylation and ubiquitination in colon cancer cells. J Biol Chem. 2006;281:17751–17757. doi: 10.1074/jbc.M600831200. [DOI] [PubMed] [Google Scholar]
- Fujisawa T, Sugiyama M, Tomimoto A, Wada K, Endo H, Takahashi H, Yoneda K, Yoneda M, Inamori M, Saito S, Terauchi Y, Kadowaki T, Tsuchiya N, Nakagama H, Nakajima A. Inhibition of peroxisome proliferator-activated receptor γ promotes tumorigenesis through activation of the β-catenin/T cell factor (TCF) pathway in the mouse intestine. J Pharmacol Sci. 2008;108:535–544. doi: 10.1254/jphs.08193fp. [DOI] [PubMed] [Google Scholar]
- Atreya R, Neurath MF. Signaling molecules: the pathogenic role of the IL-6/STAT-3 trans signaling pathway in intestinal inflammation and in colonic cancer. Curr Drug Targets. 2008;9:369–374. doi: 10.2174/138945008784221116. [DOI] [PubMed] [Google Scholar]
- Plaza-Menacho I, van der Sluis T, Hollema H, Gimm O, Buys CH, Magee AI, Isacke CM, Hofstra RM, Eggen BJ. Ras/ERK1/2-mediated STAT3 Ser727 phosphorylation by familial medullary thyroid carcinoma-associated RET mutants induces full activation of STAT3 and is required for c-fos promoter activation, cell mitogenicity, and transformation. J Biol Chem. 2007;282:6415–6424. doi: 10.1074/jbc.M608952200. [DOI] [PubMed] [Google Scholar]
- Lufei C, Koh TH, Uchida T, Cao X. Pin1 is required for the Ser727 phosphorylation-dependent Stat3 activity. Oncogene. 2007;26:7656–7664. doi: 10.1038/sj.onc.1210567. [DOI] [PubMed] [Google Scholar]
- Yeh HH, Giri R, Chang TY, Chou CY, Su WC, Liu HS. Ha-ras oncogene-induced Stat3 phosphorylation enhances oncogenicity of the cell. DNA Cell Biol. 2009;28:131–139. doi: 10.1089/dna.2008.0762. [DOI] [PubMed] [Google Scholar]
- Metcalf D, Greenhalgh CJ, Viney E, Willson TA, Starr R, Nicola NA, Hilton DJ, Alexander WS. Gigantism in mice lacking suppressor of cytokine signalling-2. Nature. 2000;405:1069–1073. doi: 10.1038/35016611. [DOI] [PubMed] [Google Scholar]
- Roberts RB, Min L, Washington MK, Olson SJ, Settle SH, Coffey RJ, Threadgill DW. Importance of epidermal growth factor receptor signaling in establishment of adenomas and maintenance of carcinomas during intestinal tumorigenesis. Proc Natl Acad Sci USA. 2002;99:1521–1526. doi: 10.1073/pnas.032678499. [DOI] [PMC free article] [PubMed] [Google Scholar]
- Moser AR, Pitot HC, Dove WF. A dominant mutation that predisposes to multiple intestinal neoplasia in the mouse. Science. 1990;247:322–324. doi: 10.1126/science.2296722. [DOI] [PubMed] [Google Scholar]
- Institute of Laboratory Animal Resources Washington, DC: Institute of Laboratory Animal Resources, Commission on Life Sciences, National Research Council,; Guide for the Care and Use of Laboratory Animals, (7th ed.) 1996 [Google Scholar]
- Hassan AB, Howell JA. Insulin-like growth factor II supply modifies growth of intestinal adenoma in ApcMin/+ mice. Cancer Res. 2000;60:1070–1076. [PubMed] [Google Scholar]
- Srivenugopal K, Singh SP, Yuan XH, Ehmann S. AKS: Differential removal of insulin-like growth factor binding proteins in rat serum by solvent extraction procedures. Experientia. 1994;50:451–455. doi: 10.1007/BF01920745. [DOI] [PubMed] [Google Scholar]
- Smith DR, Hoyt EC, Gallagher M, Schwabe RF, Lund PK. Effect of age and cognitive status on basal level AP-1 activity in rat hippocampus. Neurobiol Aging. 2001;22:773–786. doi: 10.1016/s0197-4580(01)00240-8. [DOI] [PubMed] [Google Scholar]
- Maier TJ, Janssen A, Schmidt R, Geisslinger G, Grosch G. Targeting the β-catenin/APC pathway: a novel mechanism to explain the cyclooxygenase-2-independent anticarcinogenic effects of celecoxib in human colon carcinoma cells. FASEB J. 2005;19:1353–1355. doi: 10.1096/fj.04-3274fje. [DOI] [PubMed] [Google Scholar]
- Simmons JG, Hoyt EC, Westwick JA, Brenner DA, Puckilowska JB, Lund PK. Insulin-like growth factor-i and epidermal growth factor interact to regulate growth and gene expression in IEC-6 intestinal epithelial cells. Mol Endocrinol. 1995;9:1157–1165. doi: 10.1210/mend.9.9.7491108. [DOI] [PubMed] [Google Scholar]
- Shoemaker AR, Gould KA, Luongo C, Moser AR, Dove WF. Studies of neoplasia in the Min mouse. Biochim Biophys Acta. 1997;1332:F25–F48. doi: 10.1016/s0304-419x(96)00041-8. [DOI] [PubMed] [Google Scholar]
- Tischoff I, Hengge UR, Vieth M, Ell C, Stolte M, Weber A, Schmidt WE, Tannapfel A. Methylation of SOCS-3 and SOCS-1 in the carcinogenesis of Barrett’s adenocarcinoma. Gut. 2007;56:1047–1053. doi: 10.1136/gut.2006.111633. [DOI] [PMC free article] [PubMed] [Google Scholar]
- Martini M, Pallini R, Luongo G, Cenci T, Lucantoni C, Larocca LM. Prognostic relevance of SOCS3 hypermethylation in patients with glioblastoma multiforme. Int J Cancer. 2008;123:2955–2960. doi: 10.1002/ijc.23805. [DOI] [PubMed] [Google Scholar]
- Zhou H, Miki R, Eeva M, Fike FM, Seligson D, Yang L, Yoshimura A, Teitell MA, Jamieson CA, Cacalano NA. Reciprocal regulation of SOCS1 and SOCS3 enhances resistance to ionizing radiation in glioblastoma multiforme. Clin Cancer Res. 2007;13:2344–2353. doi: 10.1158/1078-0432.CCR-06-2303. [DOI] [PubMed] [Google Scholar]
- Ogata H, Kobayashi T, Chinen T, Takaki H, Sanada T, Minoda Y, Koga K, Takaesu G, Maehara Y, Iida M, Yoshimura A. Deletion of the SOCS3 gene in liver parenchymal cells promotes hepatitis-induced hepatocarcinogenesis. Gastroenterology. 2006;131:179–193. doi: 10.1053/j.gastro.2006.04.025. [DOI] [PubMed] [Google Scholar]
- Rigby RJ, Simmons JG, Greenhalgh CJ, Alexander WS, Lund PK. Suppressor of cytokine signaling 3 (SOCS3) limits damage-induced crypt hyper-proliferation and inflammation-associated tumorigenesis in the colon. Oncogene. 2007;26:4833–4841. doi: 10.1038/sj.onc.1210286. [DOI] [PubMed] [Google Scholar]
- Chen J, Wum A, Sun H, Drakas R, Garafalo C, Cascio S, Surmacz E, Baserga R. Functional significance of type 1 insulin-like growth factor-mediated nuclear translocation of the insulin receptor substrate-1 and β-catenin. J Biol Chem. 2005;280:29912–29920. doi: 10.1074/jbc.M504516200. [DOI] [PubMed] [Google Scholar]
- Playford MP, Bicknell D, Bodmer WF, Macauley VM. Insulin-like growth factor 1 regulates the location, stability, and transcriptional activity of β-catenin. Proc Natl Acad Sci USA. 2000;97:12103–12108. doi: 10.1073/pnas.210394297. [DOI] [PMC free article] [PubMed] [Google Scholar]
- Hodge DR, Hurt EM, Farrar WL. The role of IL-6 and STAT3 in inflammation and cancer. Eur J Cancer. 2005;41:2502–2512. doi: 10.1016/j.ejca.2005.08.016. [DOI] [PubMed] [Google Scholar]
- Grivennikov S, Karin E, Terzic J, Mucida D, Yu GY, Vallabhapurapu S, Scheller J, Rose-John S, Cheroutre H, Eckmann L, Karin M. IL-6 and Stat3 are required for survival of intestinal epithelial cells and development of colitis-associated cancer. Cancer Cell. 2009;15:103–113. doi: 10.1016/j.ccr.2009.01.001. [DOI] [PMC free article] [PubMed] [Google Scholar]
- Bollrath J, Phesse TJ, von Burstin VA, Putoczki T, Bennecke M, Bateman T, Nebelsiek T, Lundgren-May T, Canli O, Schwitalla S, Matthews V, Schmid RM, Kirchner T, Arkan MC, Ernst M, Greten FR. gp130-mediated Stat3 activation in enterocytes regulates cell survival and cell-cycle progression during colitis-associated tumorigenesis. Cancer Cell. 2009;15:91–102. doi: 10.1016/j.ccr.2009.01.002. [DOI] [PubMed] [Google Scholar]
- Musteanu M, Blaas L, Mair M, Schlederer M, Bilban M, Tauber S, Esterbauer H, Mueller M, Casanova E, Kenner L, Poli V, Eferl R. Stat3 is a negative regulator of intestinal tumor progression in ApcMin mice, Gastroenterology. 2009;138:1003–1011. doi: 10.1053/j.gastro.2009.11.049. [DOI] [PubMed] [Google Scholar]
- Ceresa BP, Horvath CM, Pessin JE. Signal-transducer and activator of transcription-3 serine phosphorylation by insulin is mediated by a Ras/Raf/MEK-dependent pathway. Endocrinology. 1997;138:4131–4137. doi: 10.1210/endo.138.10.5266. [DOI] [PubMed] [Google Scholar]
- Petterino C, Podestà G, Ratto A, Drigo M, Pellegrino D. Immunohistochemical study of phospho-Stat3-ser727 expression in feline mammary gland tumours. Vet Res Commun. 2007;31:173–184. doi: 10.1007/s11259-006-3330-4. [DOI] [PubMed] [Google Scholar]
- Qin HR, Kim HJ, Kim JY, Hurt EM, Klarmann GJ, Kawasaki BT, Duhagon Serrat MA, Farrar WL. Activation of signal transducer and activator of transcription 3 through a phosphomimetic serine 727 promotes prostate tumorigenesis independent of tyrosine 705 phosphorylation. Cancer Res. 2008;68:7736–7741. doi: 10.1158/0008-5472.CAN-08-1125. [DOI] [PMC free article] [PubMed] [Google Scholar]
- Shen Y, Schlessinger K, Zhu X, Meffre E, Quimby F, Levy DE, Darnell JE., Jr Essential role of STAT3 in postnatal survival and growth revealed by mice lacking STAT3 serine 727 phosphorylation. Mol Cell Biol. 2004;24:407–419. doi: 10.1128/MCB.24.1.407-419.2004. [DOI] [PMC free article] [PubMed] [Google Scholar]
- Jain J, Zhang T, Fong SL, Lim CP, Cao X. Repression of Stat3 activity by activation of mitogen-activated protein kinase (MAPK). Oncogene. 1998;17:3157–3167. doi: 10.1038/sj.onc.1202238. [DOI] [PubMed] [Google Scholar]
- Chung J, Uchida E, Grammer TC, Blenis J. Stat3 serine phosphorylation by ERK-dependent and -independent pathways negatively modulates its tyrosine phosphorylation. Mol Cell Biol. 1997;17:6508–6516. doi: 10.1128/mcb.17.11.6508. [DOI] [PMC free article] [PubMed] [Google Scholar]
- Wen Z, Darnell JE., Jr Mapping of Stat3 serine phosphorylation to a single residue (727) and evidence that serine phosphorylation has no influence on DNA binding of Stat1 and Stat3. Nucleic Acids Res. 1997;25:2062–2067. doi: 10.1093/nar/25.11.2062. [DOI] [PMC free article] [PubMed] [Google Scholar]
- O'Rourke L, Shepherd PR. Biphasic regulation of extracellular-signal-regulated protein kinase by leptin in macrophages: role in regulating STAT3 Ser727 phosphorylation and DNA binding. Biochem J. 2002;364:875–879. doi: 10.1042/BJ20020295. [DOI] [PMC free article] [PubMed] [Google Scholar]
- Lin WF, Chen CJ, Chang YJ, Chen SL, Chiu IM, Chen L. SH2B1β enhances fibroblast growth factor 1 (FGF1)-induced neurite outgrowth through MEK-ERK1/2-STAT3-Egr1 pathway. Cell Signal. 2009;21:1060–1072. doi: 10.1016/j.cellsig.2009.02.009. [DOI] [PubMed] [Google Scholar]
- Weng YI, Aroor AR, Shukla SD. Ethanol inhibition of angiotensin II-stimulated Tyr705 and Ser727 STAT3 phosphorylation in cultured rat hepatocytes: relevance to activation of p42/44 mitogen-activated protein kinase. Alcohol. 2008;42:397–406. doi: 10.1016/j.alcohol.2008.02.004. [DOI] [PubMed] [Google Scholar]
- Hasselblatt P, Gresh L, Kudo H, Guinea-Viniegra J, Wagner EF. The role of the transcription factor AP-1 in colitis-associated and β-catenin-dependent intestinal tumorigenesis in mice. Oncogene. 2008;27:6102–6109. doi: 10.1038/onc.2008.211. [DOI] [PubMed] [Google Scholar]
- Sancho R, Nateri AS, de Venuesa AG, Aguilera C, Nye E, Spencer-Dene B, Behrens A. JNK signaling modulates intestinal homeostatis and tumorigenesis in mice. EMBO J. 2009;28:1843–1854. doi: 10.1038/emboj.2009.153. [DOI] [PMC free article] [PubMed] [Google Scholar]