Abstract
Methionine adenosyltransferase (MAT) catalyzes the synthesis of S-adenosylmethionine, the principal methyl donor, and is encoded by MAT1A and MAT2A in mammals. Normal liver expresses MAT1A, which is silenced in hepatocellular carcinoma. We have shown that hepatoma cells overexpressing MAT1A grew slower, but whether this is also true in vivo remains unknown. To investigate the effect of overexpressing MAT1A on in vivo tumorigenesis, we generated stable transfectants of Huh7 cells overexpressing either MAT1A or empty vector. Real-time PCR and Western blotting were used to measure expression, and BALB/c nude mice were injected subcutaneously with untransfected or Huh7 cells transfected with empty or MAT1A expression vector to establish tumors. Tumor properties such as proliferation, angiogenesis, and apoptosis were compared, and microarray analysis was performed. Huh7 cells overexpressing MAT1A had higher S-adenosylmethionine levels but lower bromodeoxyuridine incorporation than control cells. Tumor growth rates and weights were lower in MAT1A transfected tumors. In addition, microvessel density and CD31 and Ki-67 staining were lower in MAT1A transfected tumors than control tumors, whereas the apoptosis index was higher in MAT1A-transfected tumors. Forced expression of MAT1A induced genes related to apoptosis and tumor suppression and lowered expression of cell growth and angiogenesis proteins. Our data demonstrate in vivo overexpression of MAT1A in liver cancer cells can suppress tumor growth. They also suggest inducing MAT1A expression might be a strategy to treat hepatocellular carcinoma.
Methionine adenosyltransferase (MAT) is an essential cellular enzyme because it is the only enzyme that catalyzes the formation of S-adenosylmethionine (SAMe), the principal biological methyl donor and precursor of polyamines.1 Mammals express three MAT isoenzymes (MATI, MATII, and MATIII), which are the products of two different genes, MAT1A and MAT2A.2 MAT1A encodes the α1 catalytic subunit that forms dimers, MATIII, or tetramers (MATI), whereas MAT2A encodes for the α2 catalytic subunit of MATII. A third gene, MAT2β, encodes for a β regulatory subunit that regulates the activity of MATII but not MATI or MATIII.1 MAT1A can be considered as a marker for normal differentiated liver because it is expressed mainly in adult liver,1,2,3 whereas MAT2A is widely distributed.2 MAT2A is also expressed by fetal liver but is replaced by MAT1A during development.1,3 We reported that when the liver is undergoing rapid growth or de-differentiation, MAT2A expression is induced.4,5 We also showed that in human hepatocellular carcinoma (HCC), MAT1A expression is silenced, whereas MAT2A expression is induced.6 This switch in MAT gene expression provides a growth advantage to the liver cancer cells.7 This was demonstrated by creating a cell line model that expresses different MAT isoforms so that MAT1A expression reduced the growth rate.7 Although all MAT isoenzymes catalyze the same reaction, they are differentially regulated by their product SAMe. At the mRNA level, SAMe maintains MAT1A expression while inhibiting MAT2A expression.1 In addition, SAMe exerts feedback inhibition on MATII but not MATI or MATIII.8 Thus, cells expressing MAT1A would be expected to have higher SAMe levels than cells expressing MAT2A and this was in fact the case.7
HCC is the fifth most common cancer worldwide9 and one where treatments have been largely ineffective.10 The incidence is also expected to continue to rise due to the high prevalence of hepatitis C.11 Thus, there is a tremendous need to improve the efficacy of HCC treatment. Recently we showed that SAMe treatment is effective in preventing establishment of HCC but is ineffective as a treatment of already established HCC in a rodent model.12 One potential explanation for the lack of efficacy as HCC treatment is that normal liver has compensatory response to prevent SAMe accumulation to a high level.12 High SAMe level may be needed to exert a proapoptotic effect13 and antiangiogenic effect on cancer cells.12 This might be achievable if MAT1A expression can be induced in liver cancer cells. The aims of our current study were to examine whether forced expression of MAT1A can inhibit in vivo tumorigenesis. Our results confirm our previous in vitro findings and demonstrate that MAT1A expression can slow down tumor growth, which is likely due to inhibition in growth, angiogenesis, and increased apoptosis.
Materials and Methods
Construction of MAT1A Expression Vector
To express recombinant human MAT1A, the full-length cDNA (GenBank accession number NM_000429) was cloned into the mammalian expression vector pcDNA3. 1D/V5-His/TOPO (Invitrogen, Carlsbad, CA) by using the pcDNA3.1 Directional TOPO Expression kit according to the manufacturer’s instructions. Forward primers (5′-CACCATGAATGGACCGGTGGATGGC-3′) were designed to incorporate the sequence CACC 5′ to the ATG translation start site. The reverse primer (5′-AAATACAAGCTTCCTGGGAACCTC-3′) was designed to begin one codon upstream of the stop codon, effectively eliminating the stop codon from the PCR amplicon, enabling fusion of the MAT1A protein to the viral V5 epitope and His tag at the carboxyl terminus. Clones obtaining the expression plasmid pcDNA3.1D/V5-His/MAT1A (MAT1A expression vector) were identified initially by restriction digest analysis to detect orientation and were confirmed to contain the MAT1A cDNA in frame with the V5 and His-tag by sequence analysis using BGH and T7 priming.
Stable Transfection of Huh7 Cells with MAT1A Expression Vector
Huh7 cells were obtained from the Cell Culture Core of the University of Southern California Research Center for Liver Diseases and cultured in Dulbecco’s modified Eagle’s medium supplemented with 10% fetal bovine serum. All transfections were performed according to Lipofectamine 2000 (Invitrogen) manufacturer’s guidelines and standard techniques. Huh7 cells (3.75 × 10⁶) were plated in 10-cm petri dishes overnight. The next morning, 24 μg of either MAT1A or empty control vector pcDNA3.1D (Invitrogen) and 60 μl of Lipofectamine 2000 (Invitrogen) were suspended in 1.5 ml of Opti-MEM I, mixed, and added to Huh7 cells dropwise and gently swirled. The medium was changed after 4 hours and on the second day post-transfection, 0.6 mg/ml of G418 (InvivoGen, San Diego, CA) was added to select for stable transfectant. The medium containing G418 was changed every 3 days, the amount of G418 was reduced to 0.2 mg/ml after 28 days, and stable transfectants were maintained in medium containing 0.2 mg/ml G418. Confirmation of successful transfection was achieved by documenting the presence of MAT1A mRNA and protein as described below. These stably transfected cells were stored in aliquots in liquid nitrogen. When an aliquot was thawed and plated, the stability of transfection was verified as described above, and these cells were used for no more than 2 months at a time to avoid any change.
Tumor Xenografts in Nude Mice
Five- to six-week-old male BALB/c nude mice (Simonsen Laboratories, Gilroy, CA) were housed in a temperature-controlled, pathogen-free animal facility with 12-hour light and dark cycles. Mice were divided into three groups, and each consisted of five mice. Mice were injected subcutaneously into bilateral flanks with untransfected Huh7 cells, or Huh7 cells transfected with empty vector control or MAT1A expression vector (1 × 10⁷ cells in 200 μl PBS) to establish tumors. Tumor size was measured every 3 days, and the tumor volume was calculated by using the following formula: (length × width2)/2. After 15 days of inoculation, all mice were sacrificed, and tumors were harvested and processed for SAMe levels, gene and protein expression, as well as histology and immunohistochemistry as described below. Animals were treated humanely, and all procedures were in compliance with our institutions’ guidelines for the use of laboratory animals and approved by the Institutional Animal Care and Use Committee.
RNA Extraction and Quantitative PCR Analysis
Total RNA was isolated from Huh7 cells and centers of the tumors as described14 and subjected to reverse transcription by using M-MLV Reverse Transcriptase (Invitrogen). Two microliters of reverse transcription product was subjected to quantitative real-time PCR analysis. The primers and TaqMan probes for MAT1A, cellular FADD-like Interleukin-1-β-converting enzyme (FLICE) inhibitory protein, Bcl-xS, and Universal PCR Master Mix were purchased from ABI (Foster City, CA). Hypoxanthine phosphoribosyl-transferase 1 was used as a control housekeeping gene. Validation of microarray genes was performed by real-time PCR by using the Quantitect SYBR Green mastermix from Qiagen (Valencia, CA). The primers used are described in Table 1. All samples were detected by using Mx3005P Real-Time PCR System (Stratagene Corporation, La Jolla, CA). The thermal profile for TaqMan PCR consisted of an initial denaturation step at 95°C for 15 minutes followed by 40 cycles at 95°C for 15 seconds and at 60°C for 1 minute. The expression of genes was checked by normalization of the cycle threshold (Ct) of each gene to that of the control housekeeping gene (hypoxanthine phosphoribosyl-transferase 1). The thermal profile for SYBR green PCR consisted of an initial denaturation step at 95°C for 15 minutes followed by 40 cycles at 95°C for 15 seconds, 58°C for 30 seconds, 72°C for 30 seconds, and a dissociation curve analysis. The expression of genes was checked by normalization of the Ct of each gene to that of the control actin gene. The delta Ct (ΔCt) obtained was used to find the relative expression of genes according to the following formula: relative expression = 2−ΔΔCt, where ΔΔCt = ΔCt of respective genes in experimental groups − ΔCt of the same genes in control group.
Table 1.
Primers and Probe Information Used for Gene Expression Analysis
| Genes | Definition | Accession number | Forward primers | Reverse primers |
|---|---|---|---|---|
| FRZB | Homo sapiens frizzled-related protein (FRZB), mRNA. | NM_001463.2 | 5′-CAGTAGTGGAGGTGAAGGAG-3′ | 5′-GAGTCCAAGATGACGAAG-3′ |
| ING2 | Homo sapiens inhibitor of growth family, X-linked, pseudogene (INGX) on chromosome X. | NR_002226.1 | 5′-AAACGTCTACAGCAGCTTCTC-3′ | 5′-TCATCACAGTCTTCAATCCCA-3′ |
| ARH1 | Homo sapiens DIRAS family, GTP-binding RAS-like 3 (DIRAS3), mRNA. | NM_004675.2 | 5′-CAGCTGGTTTCTTACCACGTAT-3′ | 5′-GCACAAGTTCTCCCACACTTAG-3′ |
| GGPX2 | Homo sapiens glutathione peroxidase 2 (gastrointestinal; GPX2), mRNA. | NM_002083.2 | 5′-CACACAGATCTCCTACTCCATCCA-3′ | 5′-GGTCCAGCAGTGTCTCCTGAA-3′ |
| CREBBP | Homo sapiens CREB binding protein (Rubinstein-Taybi syndrome; CREBBP), transcript variant 1, mRNA. | NM_004380.2 | 5′-AGTAACGGCACAGCCTCTCAGT-3′ | 5′-CCTGTCGATACAGTGCTTCTAGG-3′ |
| SPP1 | Homo sapiens secreted phosphoprotein 1 (osteopontin, bone sialoprotein I, early T-lymphocyte activation 1; SPP1), transcript variant 2, mRNA. | NM_000582.2 | 5′-CGAGGTGATAGTGTGGTTTATGG-3′ | 5′-GCACCATTCAACTCCTCGCTTTC-3′ |
| PP2A | Homo sapiens protein phosphatase 2A, regulatory subunit B′ (PR 53; PPP2R4), transcript variant 1, mRNA. | NM_178001.1 | 5′-CGCTGACTACATCGGATTCATCC-3′ | 5′-GCGTGTTGAGAAGAGCGACTAG-3′ |
| PRKCZ | Homo sapiens protein kinase C, zeta (PRKCZ), transcript variant 1, mRNA. | NM_002744.4 | 5′-GTTCTCCTGGTGCGGTTGAAGA-3′ | 5′-GGTTGCTGGATGCCTGCTCAAA-3′ |
| ABCC3 | Homo sapiens ATP-binding cassette, subfamily C (CFTR/MRP), member 3 (ABCC3), transcript variant MRP3B, mRNA. | NM_003786 | 5′-GAGGAGAAAGCAGCCATTGGCA-3′ | 5′-TCCAATGGCAGCCGCACTTTGA-3′ |
| ABCC5 | Homo sapiens ATP-binding cassette, subfamily C (CFTR/MRP), member 5 (ABCC5), transcript variant 2, mRNA. | NM_001023587.1 | 5′-GGCTGTATTACGGAAAGAGGCAC-3′ | 5′-TCTTCTGTGAACCACTGGTTTCC-3′ |
| ABCG8 | Homo sapiens ATP-binding cassette, subfamily G (WHITE), member 8 (sterolin 2; ABCG8), mRNA. | NM_022437.2 | 5′-TGTCCTCGCTACAGCAATCCTG-3′ | 5′-AGAAACAGGGCTGCGAGTGACT-3′ |
| CASP7 | Homo sapiens caspase 7, apoptosis-related cysteine peptidase (CASP7), transcript variant β, mRNA. | NM_033340.2 | 5′-GTCTCACCTATCCTGCCCTCAC-3′ | 5′-TTCTTCTCCTGCCTCACTGTCC-3′ |
| BID | Homo sapiens BH3 interacting domain death agonist (BID), mRNA. | NM_197966.1 | 5′-TGGGACACTGTGAACCAGGAGT-3′ | 5′-GAGGAAGCCAAACACCAGTAGG-3′ |
Microarray Analysis
RNA isolated from empty vector or MAT1A transfectant Huh7 cells (n = 3 for each) was subjected to microarray analysis with the Illumina human Ref-6 chip (Illumina, San Diego, CA) by using the facilities available at the University of Southern California Epigenome Center. Data were analyzed by using the BeadStudio software program (Illumina). Pathways were evaluated by using the Ingenuity pathway analysis tool (Ingenuity Systems, Redwood, CA).
Western Blot Analysis
Western blotting was performed following standard protocols (Amersham BioSciences, Piscataway, NJ) using primary polyclonal rabbit anti-human MAT1A antibodies (1:1000 dilution; ProteinTech Group, Chicago, IL) and secondary goat anti-rabbit antibodies that were labeled with horseradish peroxidase (1:50,000 dilution; Cell Signaling Technology, Danvers, MA). Antibodies for active caspase 7 (19 kDa) and secreted phosphoprotein 1 (Spp1) were purchased from Millipore (Temecula, CA). Bid, phosphor, and total extracellular signal regulated kinase (ERK) and AK strain transforming (AKT) antibodies were purchased from Cell Signaling Technology. A Ras homolog 1 (ARH1) antibodies were purchased from Abnova Corporation (Taiwan). Membranes were developed by using enhanced chemiluminescence substrate (Amersham Pharmacia Biotech, Piscataway, NJ) and X-ray film, as described by the manufacturers. β-actin was used to confirm equivalent loading and transfer of protein.
Bromodeoxyuridine Cell Proliferation Assay
To assay for cell proliferation, untransfected Huh7 cells and Huh7 cells transfected with empty vector pcDNA3.1D or MAT1A expression vector were plated at a density of 104 per well of a 96-well plate (approximately 30% confluent) and serum-starved for 24 hours. Bromodeoxyuridine (BrDU) was added to each well at a dilution of 1:2000. The BrDU incorporation (a measure of DNA synthesis and growth) was measured by using the BrDU Cell Proliferation assay kit (CalBiochem, San Diego, CA).
Apoptosis Assay
Apoptosis in untransfected Huh7 cells or Huh7 cells transfected with empty vector or MAT1A expression vector was measured by using Hoechst staining as we described.13
Immunofluorescence Staining for CD31 and Ki-67
Cryostat sections (5 μm) were fixed, made permeable, and processed for direct immunofluorescence microscopy by the Immunocytochemistry (ICC) Abcam protocol (Abcam, Inc., Cambridge, MA). Sections were blocked in 5% bovine serum albumin in PBS for 1 hour and incubated with rat anti-mouse CD31-PECAM (Platelet endothelial cell adhesion molecule) antibody (BD Pharmingen, San Jose, CA) or rabbit anti-human Ki-67 (Abcam, Inc.) at 4°C overnight. Binding of biotinylated secondary antibody was localized with Vectastain Elite ABC Kit (Vector Laboratories, Burlingame, CA) for 30 minutes at room temperature. Nuclei were counterstained with 6-diamidino-2-phenylindole dihydrochloride hydrate. Sections were shielded by using VectaMount (Vector Laboratories). Fluorescence was examined and photographed with a high-resolution Zeiss laser-scanning microscope (LSM2, Carl Zeiss, Thornwood, NY). Two images of the same field were captured: (1) immunofluorescent staining for CD31 or Ki-67 (wavelength 488 nm, fluorescein isothiocyanate green) and (2) nuclear staining with 6-diamidino-2-phenylindole dihydrochloride hydrate (wavelength 405 nm, blue). Images were quantified by using a computer-assisted image analysis system (MetaMorph imaging system, Sunnyvale, CA). For analysis of CD31 staining, the entire section was first scanned around at a ×100 magnification to look for the areas of most intense vascularization (ie, greatest number of CD31-antigen-positive cells, which were classified as “hot spots”). These selected areas were then viewed at a ×200 magnification (×20 objective and ×10 ocular). A positive vessel count was defined as previously described by Weidner et al.15 Microvessel density was defined as the average count of three independent “hot spots.” The mean percentage of Ki-67-positive cells among all Huh7 cells was determined from counts of five randomly selected fields at a ×400 magnification (×40 oil objective and ×10 ocular).
Terminal Deoxynucleotidyl Transferase-Mediated dUTP Nick-End Labeling Staining of Tumor Tissues
Terminal deoxynucleotidyl transferase-mediated dUTP nick-end labeling staining was performed in resected tumor tissues (5 μm) according to the protocol from In Situ Cell Death Detection Kit (Roche Molecular Biochemicals, Indianapolis, IN). Positively stained tumor cells were identified as those with nuclei that were yellowish-brown in color, and stained cells were counted in 10 randomly selected fields under high power ×200 magnification (×20 objective and ×10 ocular). The apoptotic index was the average percentage of cells undergoing apoptosis per high power field view. Positively stained cells in areas of tumor necrosis were not counted because DNA fragmentation in necrotic cells may give a false-positive result.
Determination of SAMe and Methylthioadenosine Levels
SAMe and methylthioadenosine (MTA) levels from Huh7 cells and tumors were measured by high performance liquid chromatography as described.16
Statistical Analysis
Data are given as mean ± SEM. Statistical analysis was performed by using unpaired Student’s t-tests (InStat for Macintosh; GraphPad Software, San Diego, CA). For changes in mRNA or protein levels, ratios of genes and proteins to housekeeping control densitometric values were compared. Significance was defined by P < 0.05.
Results
Characterization of Huh7 Cells with Stable MAT1A Expression
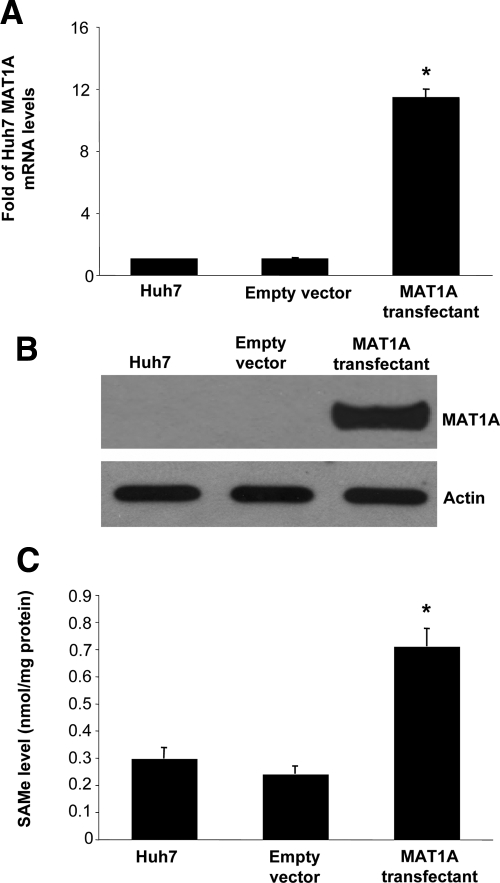
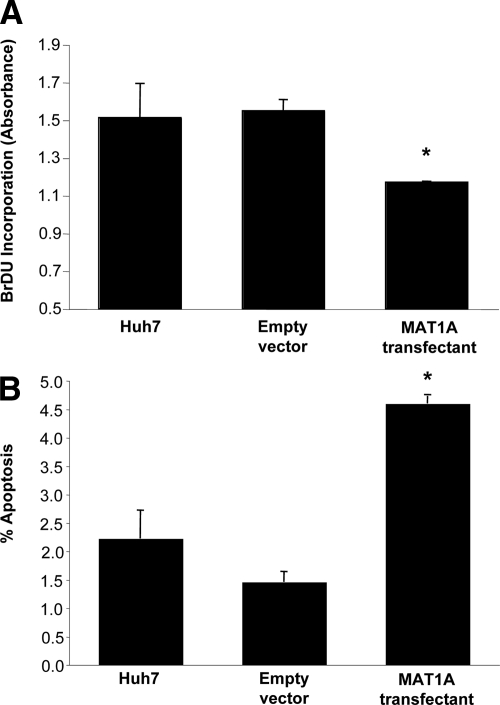
Huh7 cells stably expressing MAT1A exhibited nearly a 11-fold increase in the mRNA levels of MAT1A (Figure 1A) and a comparable increase in the protein level of MAT1A (Figure 1B). Expression was stable for at least 2 months at this level (results not shown). This translated to a nearly tripling of the steady state cellular SAMe level (Figure 1C). Levels of MTA, a metabolite of SAMe,17 was unchanged in MAT1A overexpressing cells (data not shown). MAT1A expressing Huh7 cells exhibited reduced BrDU incorporation (Figure 2A), consistent with a previous report.7 In contrast, the basal rate of apoptosis was more than doubled in MAT1A expressing Huh7 cells as compared with Huh7 cells transfected with empty vector (Figure 2B).
Figure 1.
Stable expression of MAT1A in Huh7 cells. Huh7 cells were stably transfected with empty vector or MAT1A expression vector as described in Materials and Methods. Expression of MAT1A was measured by real-time PCR (A) and Western blot analysis (B). SAMe levels increased to more than threefold of controls (C). Results are expressed as mean ± SEM from three to four different experiments. *P < 0.005 versus empty vector control.
Figure 2.
MAT1A expressing Huh7 cells have lower BrDU incorporation and higher apoptosis rates. A: Huh7 cells were stably transfected with empty vector or MAT1A expression vector, and BrDU incorporation was measured as described in Materials and Methods. B: Apoptosis was measured in the same cells as described in Materials and Methods. Mean ± SEM of three to four experiments is shown. *P < 0.005 versus empty vector control.
Effect of MAT1A Expression on in Vivo Tumorigenesis
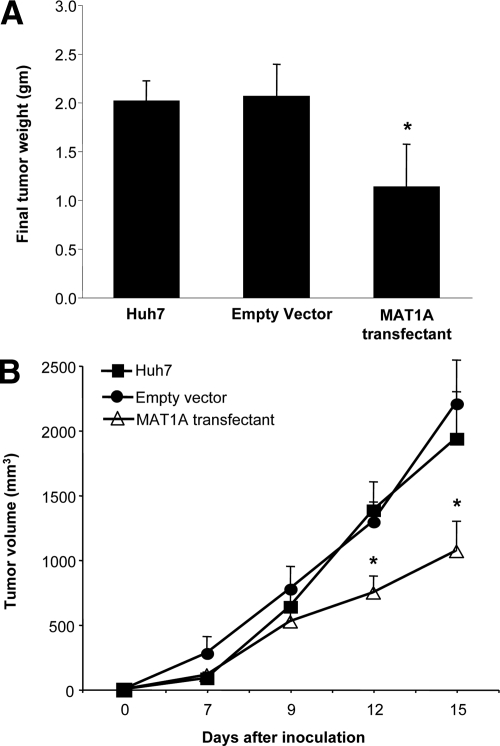
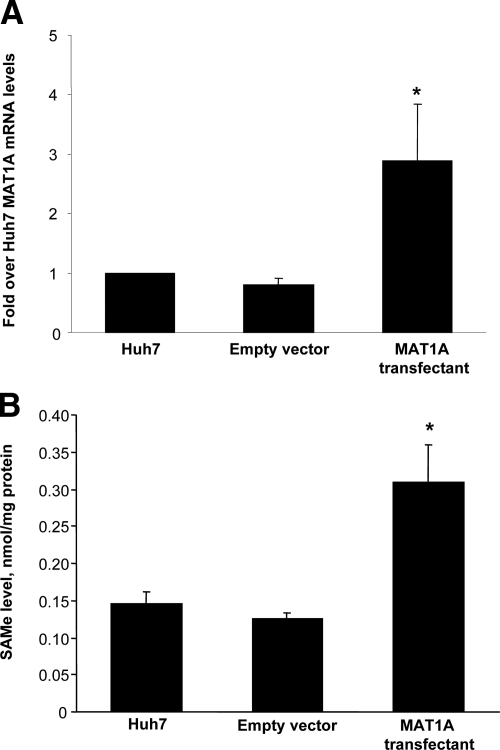
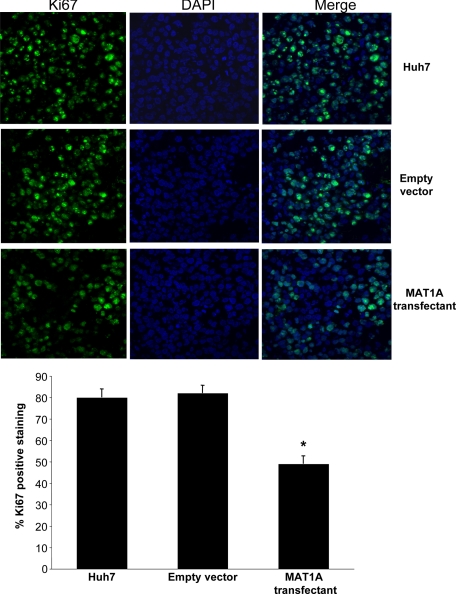
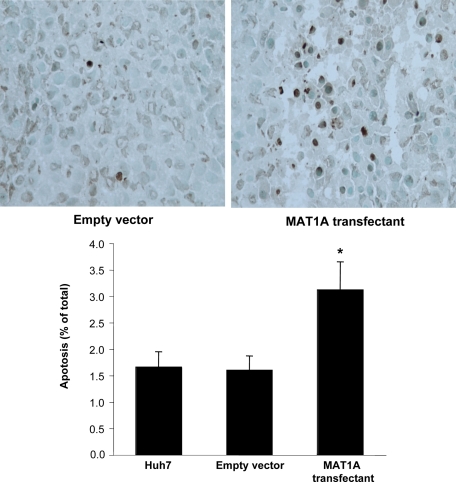
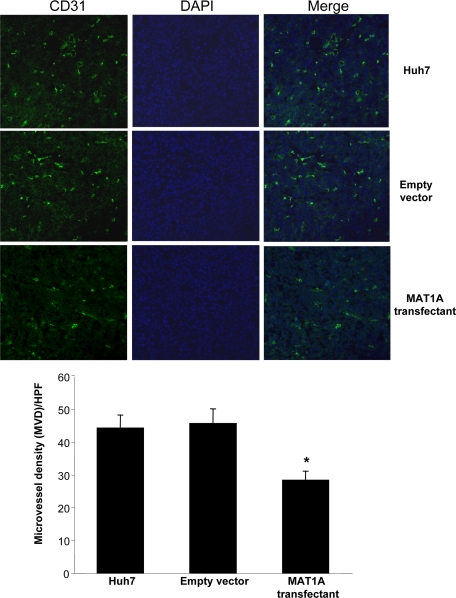
Untransfected Huh7 cells or Huh7 cells transfected with empty vector or MAT1A expression vector were injected into the flanks of nude mice and followed for 15 days. Tumors grew rapidly during this short time period, but MAT1A transfected tumors weighed significantly less at the end of 15 days (Figure 3A), and the rate of growth was about half of that of either untransfected Huh7 cells or Huh7 cells transfected with empty vector (Figure 3B). Rates of tumor growth during the 15 days after inoculation were linear, and rates were obtained by using linear regression analysis that showed control groups (Huh7 and empty vector) grew at rates of 142 mm3 and 133 mm3 per day, respectively, whereas MAT1A transfected tumors grew at a rate of 73 mm3 per day (P < 0.05 versus both Huh7 and empty vector groups). At the end of 15 days, MAT1A transfected tumors had nearly threefold higher MAT1A mRNA levels (Figure 4A) and twofold higher SAMe levels as compared with empty vector controls (Figure 4B). MTA levels were not changed by MAT1A expression (data not shown). Consistent with reduced rates of growth, Ki-67 staining in MAT1A transfected tumors was significantly reduced (40% lower) as compared with either control group (Figure 5). MAT1A transfected tumors exhibited higher apoptosis rates (Figure 6). However, the mRNA levels of cellular FLICE inhibitory protein and Bcl-xS were unchanged in MAT1A transfected tumors as compared with empty vector tumors (data not shown). CD31 immunostaining was used to evaluate microvessel density, and Figure 7 shows that this was reduced by about 40% in MAT1A transfected tumors as compared with tumors derived from either untransfected Huh7 cells or Huh7 cells transfected with empty vector.
Figure 3.
Effect of MAT1A expression on tumor weight and growth rate. Nude mice were injected with untransfected Huh7 cells or Huh7 cells expressing empty or MAT1A expression vector and followed for 15 days as described in Materials and Methods. A: Final tumor weights were reduced in MAT1A transfected tumors. B: Tumor growth rate was reduced in MAT1A transfected tumors. Results are expressed as mean ± SEM from 10 tumors per group. *P < 0.005 versus Huh7 and empty vector group.
Figure 4.
MAT1A expression and SAMe levels in tumors. A: MAT1A expression was measured in tumors at 15 days from untransfected Huh7 cells or Huh7 cells transfected with empty or MAT1A expression vectors by real-time PCR. Mean ± SEM from five to six tumors is shown. *P < 0.005 versus empty vector group. B: SAMe levels in tumors from the same three groups are expressed as mean ± SEM of five tumors per group. *P < 0.005 versus empty vector group.
Figure 5.
Effect of MAT1A expression on Ki-67 staining in tumors. Proliferation was measured in tumors at day 15 from untransfected Huh7 cells or Huh7 cells transfected with empty or MAT1A expression vector by Ki-67 staining as described in Materials and Methods. Results are expressed quantitatively as % Ki-67 positive staining per high power field (×400) in mean ± SEM from 9 to 10 tumors per group. *P < 0.01 versus untransfected Huh7 and empty vector groups.
Figure 6.
Effect MAT1A expression on apoptosis index in tumors. Apoptosis was measured in tumors at day 15 from untransfected Huh7 cells or Huh7 cells transfected with empty or MAT1A expression vector by terminal deoxynucleotidyl transferase-mediated dUTP nick-end labeling staining as described in Materials and Methods. Results are expressed quantitatively as percent terminal deoxynucleotidyl transferase-mediated dUTP nick-end labeling positive staining per high power field (×200) in mean ± SEM from 9 to 10 tumors per group. *P < 0.01 versus untransfected Huh7 and empty vector groups.
Figure 7.
Effect of MAT1A expression on angiogenesis in tumors. Angiogenesis was measured in tumors at day 15 from untransfected Huh7 cells or Huh7 cells transfected with empty or MAT1A expression vector by CD31 staining and microvessel density (MVD) as described in Materials and Methods. Results are expressed quantitatively as MVD per high power field (×200) in mean ± SEM from 9 to 10 tumors per group. *P < 0.01 versus untransfected Huh7 and empty vector groups.
Effect of MAT1A Overexpression on mRNA Levels of Genes Involved in Angiogenesis, Tumor Suppression, Growth, and Apoptosis
To understand how MAT1A overexpression influenced growth, apoptosis, and angiogenesis, we performed microarray analysis of RNA from MAT1A transfectant cells and compared it to empty vector controls. Out of 25,000 genes in the Illumina human gene Chip, 558 were up-regulated more than twofold, and 31 genes were down-regulated by at least 50% in the MAT1A transfectant versus empty vector (Supplemental Tables 1 and 2, respectively, see http://ajp.amjpathol.org). Based on the pathway analysis of this gene set, we identified potential candidate genes that could be responsible for the MAT1A-mediated suppression of growth and increased apoptosis (Table 2). These genes were validated at the mRNA level by real-time PCR in both MAT1A-transfectant cells and MAT1A overexpressing tumor samples (Tables 2 and 3, respectively). Our results showed that two tumor suppressors (FRZB and ARH1) were up-regulated over twofold in MAT1A overexpressing cells and tumors. Forced expression of MAT1A in Huh7 cells and tumors led to a 50% inhibition of Spp1 or osteopontin, a well-known angiogenesis marker that is also antiapoptotic in HCC cell lines.18,19 Two apoptotic genes (caspase 7 and Bid) were markedly induced in MAT1A transfectant cells and tumors compared with empty vector controls. Protein phosphatase 2A (PP2A), a known regulator of protein kinase cascades (ERK and AKT),20 was induced 1.5-fold in MAT1A overexpressing cells and tumors. Apart from these, certain genes involved in oxidative stress response (gpx2, crebbp, ABCC3, ABCC5, ABCG8, and prkcz) were also induced in MAT1A transfectants.
Table 2.
Validation of Microarray-Expressed Genes in MAT1A-Transfected Huh-7 Cells by Quantitative RT-PCR
| Gene symbol | Definition | Accession number | Microarray fold change | P | Quantitative RT-PCR fold change | SEM | P |
|---|---|---|---|---|---|---|---|
| FRZB | Frizzled-related protein | NM_001463.2 | 2.05 | 0 | 4.07 | 0.80 | 0.009 |
| ING2 | Inhibitor of growth | NR_002226.1 | 14.11 | 0.0193 | 1.66 | 0.18 | 0.011 |
| ARH1 | A Ras Homolog 1 | NM_004675.2 | 2.54 | 0.0248 | 2.07 | 0.21 | 0.003 |
| GPX2 | Glutathione peroxidase 2 | NM_002083.2 | 2.97 | 0 | 3.34 | 0.97 | 0.04 |
| CREBBP | CREB binding protein | NM_004380.2 | 2.24 | 0 | 2.07 | 0.26 | 0.007 |
| PRKCZ | Protein kinase C zeta | NM_002744.4 | 2.26 | 0.0014 | 2.15 | 0.1 | 0.0001 |
| ABCC3 | ATP-binding cassette, subfamily C, member 3 | NM_020038.1 | 2.09 | 0.0248 | 2.00 | 0.21 | 0.004 |
| ABCC5 | ATP-binding cassette, subfamily C, member 5 | NM_001023587 | 3.75 | 0.0014 | 1.94 | 0.38 | 0.03 |
| ABCG8 | ATP-binding cassette, subfamily G, member 8 | NM_022437.2 | 6.20 | 0 | 9.01 | 3.07 | 0.03 |
| SPP1 | Secreted phosphoprotein 1 (osteopontin) | NM_000582.2 | 0.47 | 0 | 0.43 | 0.07 | 0.0005 |
| PP2A | Protein phosphatase 2A, regulatory subunit B′ | NM_178001.1 | 2.23 | 0 | 1.45 | 0.10 | 0.0054 |
| CASP7 | Caspase 7 | NM_033340.2 | 2.02 | 0 | 2.52 | 0.59 | 0.033 |
| BID | BH3 interacting domain death agonist | NM_197966.1 | 3.23 | 0.0344 | 2.24 | 0.19 | 0.001 |
Microarray analysis was done as described in Materials and Methods by using RNA samples from MAT1A and empty vector transfected Huh-7 cells (n = 3 each). Quantitative real-time PCR was done in three separate experiments comparing mRNA levels in MAT1A-transfected Huh-7 cells to empty vector transfected Huh-7 cells. Results are expressed as fold change over empty vector control.
Table 3.
Validation of Microarray-Expressed Genes in MAT1A-Expressing Tumors by Quantitative RT-PCR
| Gene symbol | Definition | Accession number | Microarray fold change | P | Quantitative RT-PCR fold change | SEM | P |
|---|---|---|---|---|---|---|---|
| FRZB | Frizzled-related protein | NM_001463.2 | 2.05 | 0 | 2.21 | 0.59 | 0.049 |
| ING2 | Inhibitor of growth | NR_002226.1 | 14.11 | 0.0193 | 1.65 | 0.06 | 0.0002 |
| ARH1 | A Ras Homolog 1 | NM_004675.2 | 2.54 | 0.0248 | 2.06 | 0.32 | 0.015 |
| GPX2 | Glutathione peroxidase 2 | NM_002083.2 | 2.97 | 0 | 2.49 | 0.84 | 0.006 |
| CREBBP | CREB binding protein | NM_004380.2 | 2.24 | 0 | 1.45 | 0.14 | 0.011 |
| PRKCZ | Protein kinase C zeta | NM_002744.4 | 2.26 | 0.0014 | 2.15 | 0.41 | 0.002 |
| ABCC3 | ATP-binding cassette, subfamily C, member 3 | NM_020038.1 | 2.09 | 0.0248 | 2.26 | 0.80 | 0.04 |
| ABCC5 | ATP-binding cassette, subfamily C, member 5 | NM_001023587.1 | 3.75 | 0.0014 | 1.50 | 0.29 | NS |
| ABCG8 | ATP-binding cassette, subfamily G, member 8 | NM_022437.2 | 6.20 | 0 | 3.50 | 0.78 | 0.007 |
| SPP1 | Secreted phosphoprotein 1 (osteopontin) | NM_000582.2 | 0.47 | 0 | 0.57 | 0.06 | 0.0016 |
| PP2A | Protein phosphatase 2A, regulatory subunit B′ | NM_178001.1 | 2.23 | 0 | 1.45 | 0.13 | 0.0069 |
| CASP7 | Caspase 7 | NM_033340.2 | 2.02 | 0 | 2.69 | 0.61 | 0.014 |
| BID | BH3 interacting domain death agonist | NM_197966.1 | 3.23 | 0.0344 | 2.01 | 0.34 | 0.001 |
Microarray analysis was done as described in Materials and Methods by using RNA samples from MAT1A and empty vector transfected Huh-7 cells (n = 3 each). Quantitative real-time PCR was done in three tumors derived from MAT1A-transfected Huh-7 cells and three tumors derived from empty vector transfected Huh-7 cells. Results are expressed as fold change over empty vector control.
We validated the expression of many of the genes mentioned in Table 2 at the protein level. As shown in Figure 8, forced expression of MAT1A in Huh7 cells led to a marked increase in active caspase 7 protein and proapoptotic Bid protein. Consistent with microarray and real-time PCR data (Table 2), we detected a fourfold increase in the levels of ARH1 tumor suppressor protein in extracts of MAT1A overexpressing cells compared with empty vector controls. A moderate reduction of about 20% was observed in angiogenic, antiapoptotic protein, Spp1, despite a 50% reduction in its mRNA level in MAT1A transfected cells (Table 2).
Figure 8.
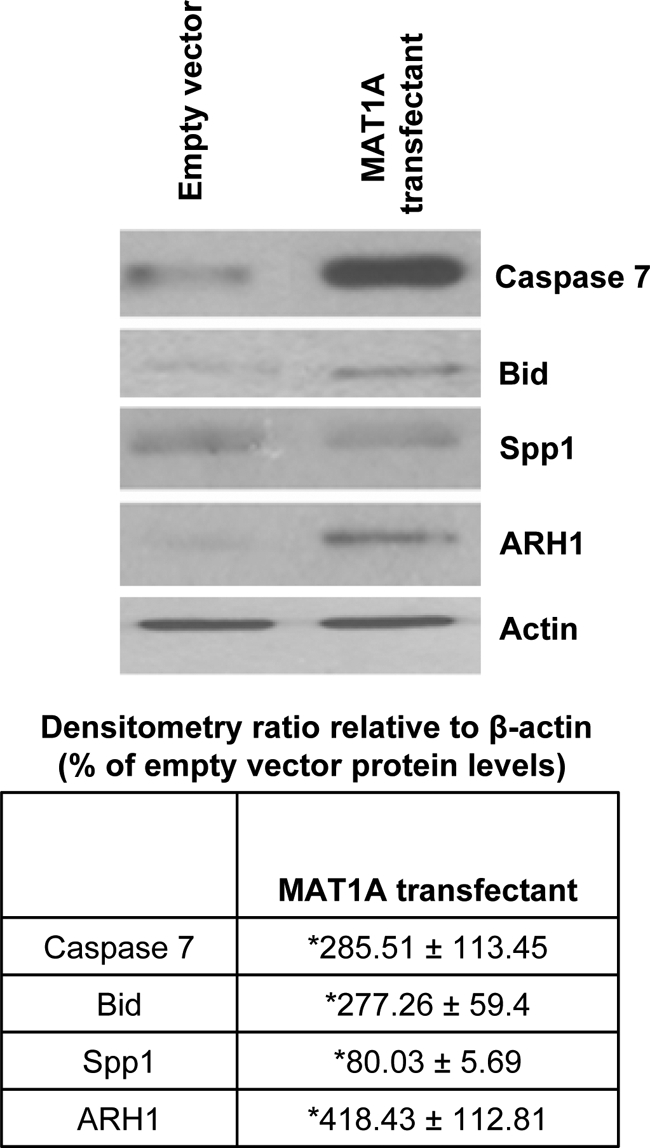
Mechanism of MAT1A-mediated induction of apoptosis and decreased angiogenesis and cell growth in Huh7 cells. Cell extracts from MAT1A transfected Huh7 cells and empty vector controls were subjected to Western blotting by using antibodies specific to active form of caspase 7 (19 kDa), Bid, Spp1, and ARH1 as described in Materials and Methods. Densitometric ratios relative to β-actin are expressed as fold over empty vector. Results represent mean ± SEM from three independent experiments. *P < 0.05 versus empty vector cells.
Influence of Forced MAT1A Expression on ERK and AKT Signaling Pathways
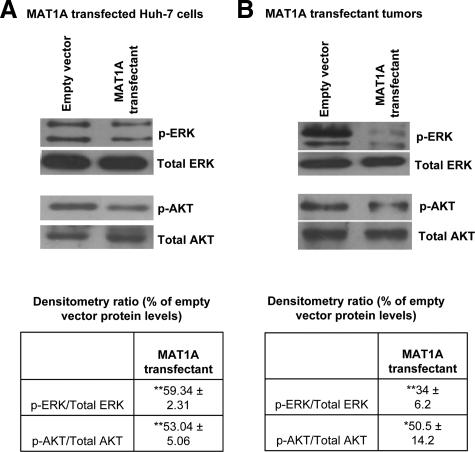
It is well established that protein kinase cascades, ERK/Mitogen activated protein kinase (MAPK) or PI3-K/AKT, are induced during liver cancer progression.21,22 Based on these findings, we checked the activity of ERK and AKT in MAT1A transfected cells. Our results show a 50% reduction in active, phosphorylated forms of ERK and AKT in MAT1A transfectants compared with empty vector controls (Figure 9A). Consistent with these findings, we observed a decrease in the activity of ERK and AKT in MAT1A overexpressing tumors (Figure 9B).
Figure 9.
Effect of MAT1A overexpression on ERK and AKT activation in vitro and in vivo. Western blotting for phospho-ERK (p-ERK), phospho-AKT (p-AKT), and total ERK and AKT was performed in (A) MAT1A transfected Huh7 cells or (B) MAT1A overexpressing tumors as described in Materials and Methods. Densitometric ratios of phospho to total protein in MAT1A transfectants are expressed as fold over empty vector. Results represent mean ± SEM from three independent experiments. *P < 0.05; **P < 0.005 versus empty vector cells.
Discussion
There is an urgent need to develop better therapies against HCC because it is expected to remain one of the world’s most common cancers.9,11 The majority of the HCC patients are not surgical candidates when they are diagnosed, and the overall survival rate is less than 10%.23 Recent breakthrough in treatment of advanced HCC has been reported with Sorafenib, a multikinase inhibitor.10 However, the improvement in median overall survival is less than 3 months.10 Clearly, additional strategies are needed to increase the response rate.
We reported a switch in MAT gene expression from normally expressed MAT1A to MAT2A in human HCC6 and demonstrated by using an in vitro model that liver cancer cells transfected with MAT1A expression vector grew at a slower rate.7 The molecular mechanism for silencing of MAT1A in human HCC remains obscure but one potential mechanism suggested is promoter hypermethylation because this was found to be associated with lower expression.24 Although investigations continue to elucidate the mechanism(s) responsible for silencing of MAT1A, whether forced MAT1A expression in liver cancer cells can affect its in vivo tumorigenicity has not been investigated until now. An important reason for this strategy is that forced MAT1A expression may allow high intracellular SAMe level to persist in the tumor cell, which was not achievable when exogenous SAMe was delivered for 24 days.12
Using stably transfected Huh7 cells that overexpress MAT1A, we first made sure that it reproduced previously reported findings.7 MAT1A expression remained stable for over 2 months, and SAMe levels remained elevated to nearly threefold of untransfected cells. Consistent with our previous report, MAT1A expression reduced BrDU incorporation by 35% in vitro.7 The effect of MAT1A expression on tumor growth in vivo was even more dramatic. It reduced tumor growth rate and final tumor weight by 50%. MAT1A mRNA levels in the tumors originated from Huh7 cells transfected with MAT1A expression vector was about threefold of controls at day 15, much lower than what was achieved in vitro. This may be due to presence of non-Huh7 cells such as endothelial cells in the specimen and/or stability of the transfectant is not as good as in the in vitro setting. Steady state SAMe levels in the tumors corroborate with this because it is only about twofold of controls, rather than nearly threefold in the in vitro setting. Still, this magnitude of elevation in SAMe level with forced MAT1A expression is much higher than the 30% increase observed with exogenous SAMe treatment for 24 days because unlike normal liver, liver cancer cells such as Huh7 lack the expression of glycine N-methyltransferase, which was induced by the exogenous SAMe treatment to prevent SAMe accumulation.12
Consistent with reduced tumor growth, MAT1A transfected tumors had lower Ki-67 staining. Tumor growth is dependent on neovascularization, and consistently, CD31 staining is also reduced markedly in MAT1A transfected tumors. In contrast, there is a doubling of apoptosis rate in MAT1A transfected tumors. This is consistent with a higher apoptosis rate observed in the MAT1A transfected Huh7 cells. Given that MAT1A encodes the catalytic subunit of MATI/III, the only expected outcome of its varied expression is a change in the steady state SAMe level.1 Effect on growth, angiogenesis, and apoptosis would all have to be explained via a change in SAMe level.
SAMe level has a clear impact on hepatocytes growth. It is high in quiescent hepatocytes and falls when hepatocytes undergo proliferation.1,4 MAT1A knockout mice with chronic hepatic SAMe deficiency exhibit higher basal proliferating cell nuclear antigen staining25 and develop HCC spontaneously.26 Recent work from our laboratory showed that SAMe exerts an inhibitory effect on hepatocytes growth factor-mediated signaling.27,28 SAMe inhibits hepatocytes growth factor-induced activation of AMP kinase in hepatocytes, which is required for proliferation to occur.28 Thus, the higher SAMe level in the MAT1A transfected tumors could have exerted an inhibitory tone on tumor growth, particularly in the in vivo setting.
SAMe’s role in apoptosis is complicated because it is antiapoptotic in normal hepatocytes but proapoptotic in liver cancer cells.13,29 We reported one mechanism for this differential effect to be the ability of SAMe to selectively induce Bcl-xS in liver cancer cells.13 However, there was no difference in Bcl-xS mRNA level in the MAT1A transfected tumors. We also found no change in cellular FLICE inhibitory protein expression, which we recently reported to be down-regulated by SAMe in colon cancer cells.30 The fact that exogenous SAMe treatment of cancer cells induced the expression of these proteins but endogenously elevated SAMe level did not suggest the high likelihood that many pharmacological effects of SAMe are actually mediated by MTA. Pharmacological SAMe doses can produce significant amount of MTA, which is derived from SAMe spontaneously and in the polyamine biosynthesis pathway.17 Although SAMe is well known as a methyl donor and a precursor of polyamines,1 MTA inhibits methylation and polyamine biosynthesis.31 We have shown that MTA can recapitulate many of SAMe’s actions, including its proapoptotic action in cancer cells.13,17,29,30 Increased SAMe level in MAT1A expressing cells and tumors was not accompanied by higher MTA level. This may explain why endogenously raised SAMe level had no effect on these proteins.
Another major factor influencing tumor growth is angiogenesis, and we recently reported that SAMe treatment of H4IIE cells in vitro for 13 hours led to changes in gene expression that inhibits angiogenesis.12 However, the same genes were not altered in MAT1A transfected tumors (data not shown). This may again reflect an effect of MTA in our earlier work or a difference between Huh7 and H4IIE cells.
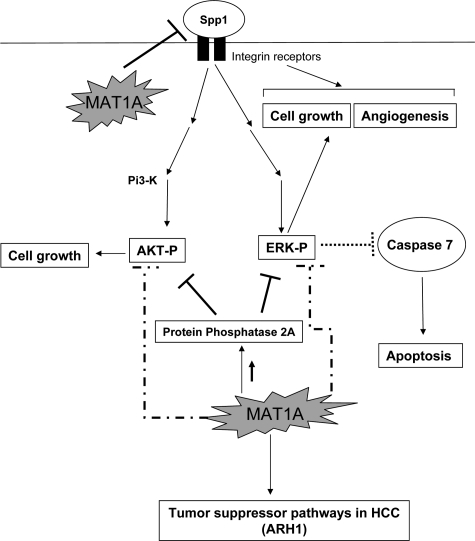
To gain a better mechanistic insight of how forced MAT1A expression (and increased SAMe level alone without a change in MTA) suppressed growth, angiogenesis, and increased apoptosis, we examined differential gene expression and the activity of two signaling pathways well known to be induced in HCC, namely ERK/MAPK and PI3-K/AKT.21,22 In HCC it is well known that inhibition of ERK/MAPK signaling pathway leads to induction of caspase 7 and 3, effector caspases in the apoptotic cascade.21 The Bcl-2 family member, Bid, mediates apoptosis by inducing the release of proapoptotic factors, and Bid is down-regulated in HCC.32 Our microarray results and subsequent RNA and protein validation show that there is an induction of active caspase 7 and a concomitant decrease in ERK activity in MAT1A transfectants. Down-regulation of ERK/MAPK survival signaling accompanied by increased caspase 7 is one plausible mechanism for decreased growth and increased apoptosis in MAT1A transfectants. Another important target of MAT1A identified from microarray analysis is Spp1 or osteopontin, an important cell growth and angiogenesis factor in HCC.18,19 Binding of Spp1 to integrin receptors in cancer cells leads to activation of two important survival pathways, ERK/MAPK and PI3-K/AKT, causing enhanced cell growth.19 We show that Spp1 is under-expressed in MAT1A transfectant cells and tumors. This is consistent with our finding that forced expression of MAT1A affects downstream pathways of Spp1 signaling, namely ERK and AKT activation. Spp1 down-regulation might be one of the mechanisms responsible for decreased angiogenesis and cell growth in MAT1A transfectants. Our results also indicate that MAT1A induces the expression of PP2A, a phosphatase that keeps ERK and AKT in dephosphorylated state.20 This is another putative mechanism by which MAT1A overexpression lowers ERK and AKT activity leading to reduced growth. Our microarray analysis identified two tumor suppressor genes, ARH1 and FRZB that were induced in MAT1A transfectants. ARH1 is a well-known tumor suppressor gene that is silenced in 80% of HCC specimens, and knockdown of this gene in Huh7 cells leads to increased cell growth.33 We chose to validate ARH1 in this system because its role has been well described in Huh7 cells and HCC. There are several Frizzled homologs studied in cancer, but only FRZA is described in the context of HCC.34 FRZB, the frizzled homolog overexpressed in our microarray analysis, is known to suppress growth in prostate cancer cells,35 and not much is known about its regulation in HCC. Figure 10 summarizes our main findings and provides a mechanistic insight into putative targets of MAT1A that modulate tumor growth, angiogenesis, and apoptosis.
Figure 10.
Potential targets of MAT1A in HCC. MAT1A influences several target genes in HCC. A common theme in all these targets is the regulation of ERK and AKT survival pathways. MAT1A-mediated down-regulation of Spp1 could reduce ERK and AKT activation thereby decreasing cell growth. Down-regulation of Spp1 by MAT1A may also influence angiogenesis in HCC. MAT1A-mediated up-regulation of the phosphatase PP2A as well as other unknown mechanisms may cause dephosphorylation and inactivation of ERK and AKT leading to reduced cell survival. Reduced ERK activation caused by MAT1A expression induces caspase 7 and could potentially induce apoptosis in HCC.
A recent report revealed that MAT1A expression in human HCC is a predictor of prognosis.36 Indeed, patients with HCCs where MAT1A expression was silenced had more aggressive tumors and shorter survival. Our results support a causal role for MAT1A in this process and this model may be suitable for additional studies examining the role of SAMe in liver cancer invasion and metastasis.
In summary, although we have speculated that loss of MAT1A in HCC can facilitate tumor growth, our current work provides for the first time in vivo proof of this concept. Forced expression of MAT1A in liver cancer cells reduced tumor growth rate, which was associated with lower microvessel density and slightly higher apoptosis rate. This may be considered as another strategy in the treatment of HCC, not by itself but in combination with other approaches.
Footnotes
Address reprint requests to Shelly C. Lu, M.D., Keck School of Medicine, University of Southern California, Hoffman Medical Research Building, HMR 415, 2011 Zonal Ave, Los Angeles, CA 90033. E-mail: shellylu@usc.edu.
Supported by NIH grants R01DK51719 (to S.C.L.), K99AA017774 (to K.R.), and R01AT1576 (to S.C.L. and J.M.M.); Spanish Plan National for Research and Development SAF2008-04800, Ministry of Science and Innovation (MICINN). 2008-04800; and HEPADIP-EULSHM-CT-205 (to J.M. Mato). Huh7 cells were provided by the Cell Culture Core of the USC Research Center for Liver Diseases (DK48522).
J.L. and K.R. contributed equally to this work.
Supplemental material for this article can be found on http://ajp.amjpathol.org.
References
- Mato JM, Lu SC. Role of S-adenosyl-L-methionine in liver health and injury. Hepatology. 2007;45:1306–1312. doi: 10.1002/hep.21650. [DOI] [PubMed] [Google Scholar]
- Kotb M, Mudd SH, Mato JM, Geller AM, Kredich NM, Chou JY, Cantoni GL. Consensus nomenclature for the mammalian methionine adenosyltransferase genes and gene products. Trends Genet. 1997;13:51–62. doi: 10.1016/s0168-9525(97)01013-5. [DOI] [PubMed] [Google Scholar]
- Gil B, Casado M, Pajares MA, Boscá L, Mato JM, Martín-Sanz P, Alvarez L. Differential expression pattern of SAM synthetase isoenzymes during rat liver development. Hepatology. 1996;24:876–881. doi: 10.1002/hep.510240420. [DOI] [PubMed] [Google Scholar]
- Huang ZZ, Mao Z, Cai J, Lu SC. Changes in methionine adenosyltransferase during liver regeneration in the rat. Am J Physiol. 1998;275:G14–G21. doi: 10.1152/ajpgi.1998.275.1.G14. [DOI] [PubMed] [Google Scholar]
- Huang ZZ, Mato JM, Kanel G, Lu SC. Differential effect of thioacetamide on hepatic methionine adenosyltransferase expression. Hepatology. 1999;29:1471–1478. doi: 10.1002/hep.510290525. [DOI] [PubMed] [Google Scholar]
- Cai J, Sun WM, Hwang J, Stain S, Lu SC. Changes in S-adenosylmethionine synthetase in human liver cancer: molecular characterization and significance. Hepatology. 1996;24:1090–1097. doi: 10.1002/hep.510240519. [DOI] [PubMed] [Google Scholar]
- Cai J, Mao Z, Hwang JJ, Lu SC. Differential expression of methionine adenosyltransferase genes influences the rate of growth of human hepatocellular carcinoma cells. Cancer Res. 1998;58:1444–1450. [PubMed] [Google Scholar]
- Mato JM, Corrales FJ, Lu SC, Avila MA. S-adenosylmethionine: a control switch that regulates liver function. FASEB J. 2002;16:15–26. doi: 10.1096/fj.01-0401rev. [DOI] [PubMed] [Google Scholar]
- Parkin DM, Bray F, Ferlay J, Pisani P. Estimating the world cancer burden. Globocan 2000. Int J Cancer. 2001;94:153–156. doi: 10.1002/ijc.1440. [DOI] [PubMed] [Google Scholar]
- Llovet JM, Ricci S, Mazzaferro V, Hilgard P, Gane E, Blanc JF, de Oliveira AC, Santoro A, Raoul JL, Forner A, Schwartz M, Porta C, Zeuzem S, Bolondi L, Greten TF, Galle PR, Seitz JF, Borbath I, Häussinger D, Giannaris T, Shan M, Moscovici M, Voliotis D, Bruix J, SHARP Investigators Study Group Sorafenib in advanced hepatocellular carcinoma. N Engl J Med. 2008;359:378–390. doi: 10.1056/NEJMoa0708857. [DOI] [PubMed] [Google Scholar]
- Sypsa V, Touloumi G, Papatheodoridis GV, Tassopoulos NC, Ketikoglou I, Vafiadis I, Hatzis G, Tsantoulas D, Akriviadis E, Koutsounas S, Hatzakis A. Future trends of HCV-related cirrhosis and hepatocellular carcinoma under the currently available treatments. J Viral Hep. 2005;12:543–550. doi: 10.1111/j.1365-2893.2005.00588.x. [DOI] [PubMed] [Google Scholar]
- Lu SC, Ramani K, Ou XP, Lin M, Yu V, Ko K, Park R, Bottiglieri T, Tsukamoto H, Kanel G, French S, Mato JM, Moat R, Grant E. S-adenosylmethionine in the chemoprevention and treatment of hepatocellular carcinoma in a rat model. Hepatology. 2009;50:462–471. doi: 10.1002/hep.22990. [DOI] [PMC free article] [PubMed] [Google Scholar]
- Yang HP, Sadda MR, Li M, Zeng Y, Chen LX, Bae WJ, Ou X, Runnegar MT, Mato JM, Lu SC. S-Adenosylmethionine and its metabolite induce apoptosis in HepG2 cells: role of protein phosphatase 1 and Bcl-xS. Hepatology. 2004;40:221–231. doi: 10.1002/hep.20274. [DOI] [PubMed] [Google Scholar]
- Yang HP, Iglesias Ara A, Magilnick N, Xia M, Ramani K, Chen H, Lee TD, Mato JM, Lu SC. Expression pattern, regulation, and functions of methionine adenosyltransferase 2beta splicing variants in hepatoma cells. Gastroenterology. 2008;134:281–291. doi: 10.1053/j.gastro.2007.10.027. [DOI] [PMC free article] [PubMed] [Google Scholar]
- Weidner N, Semple JP, Welch WR, Folkman J. Tumour angiogenesis and metastasis: correlation in invasive breast carcinoma. N Engl J Med. 1991;324:1–8. doi: 10.1056/NEJM199101033240101. [DOI] [PubMed] [Google Scholar]
- Farrar C, Clarke S. Altered levels of S-adenosylmethionine and S-adenosylhomocysteine in the brains of L-isoaspartyl (D-aspartyl) O-methyltransferase-deficient mice. J Biol Chem. 2002;277:27856–27863. doi: 10.1074/jbc.M203911200. [DOI] [PubMed] [Google Scholar]
- Ramani K, Yang HP, Xia M, Iglesias Ara A, Mato JM, Lu SC. Leptin’s mitogenic effect in human liver cancer cells requires induction of both methionine adenosyltransferase 2A and 2β. Hepatology. 2008;47:521–531. doi: 10.1002/hep.22064. [DOI] [PMC free article] [PubMed] [Google Scholar]
- Zhao J, Dong L, Lu B, Wu G, Xu D, Chen J, Li K, Tong X, Dai J, Yao S, Wu M, Guo Y. Down-regulation of osteopontin suppresses growth and metastasis of hepatocellular carcinoma via induction of apoptosis. Gastroenterology. 2008;135:956–968. doi: 10.1053/j.gastro.2008.05.025. [DOI] [PubMed] [Google Scholar]
- Rangaswami H, Bulbule A, Kundu GC. Osteopontin: role in cell signaling and cancer progression. Trends Cell Biol. 2006;16:79–87. doi: 10.1016/j.tcb.2005.12.005. [DOI] [PubMed] [Google Scholar]
- Millward TA, Zolnierowicz S, Hemmings BA. Regulation of protein kinase cascades by protein phosphatase 2A. Trends Biochem Sci. 1999;24:186–191. doi: 10.1016/s0968-0004(99)01375-4. [DOI] [PubMed] [Google Scholar]
- Huynh H, Soo KC, Chow P, Tran E. Targeted inhibition of the extracellular signal-regulated kinase kinase pathway with AZD6244 (ARRY-142886) in the treatment of hepatocellular carcinoma. Mol Cancer Ther. 2007;6:138–146. doi: 10.1158/1535-7163.MCT-06-0436. [DOI] [PubMed] [Google Scholar]
- Nakanishi K, Sakamoto M, Yamasaki S, Todo S, Hirohashi S. Akt phosphorylation is a risk factor for early disease recurrence and poor prognosis in hepatocellular carcinoma. Cancer. 2005;103:307–312. doi: 10.1002/cncr.20774. [DOI] [PubMed] [Google Scholar]
- Yeh FS, Yu MC, Mo CC, Luo S, Tong MJ, Henderson BE. Hepatitis B virus, aflatoxins, and hepatocellular carcinoma in southern Guangxi. China Cancer Res. 1989;49:2506–2509. [PubMed] [Google Scholar]
- Torres L, Avila MA, Carretero MV, Latasa MU, Caballeria J, López-Rodas G, Boukaba A, Lu SC, Franco L, Mato JM. Liver-specific methionine adenosyltransferase MAT1A gene expression is associated to a specific pattern of promoter methylation and histone acetylation: implications for MAT1A silencing during transformation. FASEB J. 2000;14:95–102. doi: 10.1096/fasebj.14.1.95. [DOI] [PubMed] [Google Scholar]
- Chen L, Zeng Y, Yang HP, Lee TD, French SW, Corrales FJ, García-Trevijano ER, Avila MA, Mato JM, Lu SC. Impaired liver regeneration in mice lacking methionine adenosyltransferase 1A. FASEB J. 2004;18:914–916. doi: 10.1096/fj.03-1204fje. [DOI] [PubMed] [Google Scholar]
- Martínez-Chantar ML, Corrales FJ, Martínez-Cruz LA, García-Trevijano ER, Huang ZZ, Chen L, Kanel G, Avila MA, Mato JM, Lu SC. Spontaneous oxidative stress and liver tumors in mice lacking methionine adenosyltransferase 1A. FASEB J. 2002;16:1292–1294. doi: 10.1096/fj.02-0078fje. [DOI] [PubMed] [Google Scholar]
- Martínez-Chantar ML, Vázquez-Chantada M, Garnacho M, Latasa MU, Varela-Rey M, Dotor J, Santamaria M, Martínez-Cruz LA, Parada LA, Lu SC, Mato JM. S-adenosylmethionine regulates cytoplasmic HuR via AMP-activated kinase. Gastroenterology. 2006;131:223–232. doi: 10.1053/j.gastro.2006.04.019. [DOI] [PubMed] [Google Scholar]
- Vázquez-Chantada M, Ariz U, Varela-Rey M, Embade N, Martínez-Lopez N, Fernández-Ramos D, Gómez-Santos L, Lamas S, Lu SC, Martínez-Chantar ML, Mato JM. Evidence for an LKB1/AMPK/eNOS cascade regulated by HGF, S-adenosylmethionine, and NO in hepatocyte proliferation. Hepatology. 2009;49:608–617. doi: 10.1002/hep.22660. [DOI] [PMC free article] [PubMed] [Google Scholar]
- Ansorena E, García-Trevijano ER, Martínez-Chantar ML, Huang ZZ, Chen LX, Mato JM, Iraburu M, Lu SC, Avila MA. S-adenosylmethionine and methylthioadenosine are anti-apoptotic in cultured rat hepatocytes but pro-apoptotic in human hepatoma cells. Hepatology. 2002;35:274–280. doi: 10.1053/jhep.2002.30419. [DOI] [PubMed] [Google Scholar]
- Li T, Zhang Q, Oh P, Xia M, Chen H, Bemanian S, Lastra N, Circ M, Moyer MP, Mato JM, Aw TY, Lu SC. S-adenosylmethionine and methylthioadenosine inhibit cellular FLICE inhibitory protein expression and induce apoptosis in colon cancer cells. Mol Pharmacol. 2009;76:192–200. doi: 10.1124/mol.108.054411. [DOI] [PMC free article] [PubMed] [Google Scholar]
- Clarke SG. Inhibition of mammalian protein methyltransferases by 5′-methylthioadenosine (MTA): a mechanism of action of dietary SAMe? The Enzymes. 2006;24:467–493. doi: 10.1016/S1874-6047(06)80018-1. [DOI] [PubMed] [Google Scholar]
- Chen GH, Lai P, Chak E, Xu H, Lee KM, Lau WY. Immunohistochemical analysis of pro-apoptotic Bid levels in chronic hepatitis, hepatocellular carcinoma and liver metastases. Cancer Lett. 2001;172:75–82. doi: 10.1016/s0304-3835(01)00630-9. [DOI] [PubMed] [Google Scholar]
- Huang J, Lin Y, Li L, Qing D, Teng X, Zhang Y, Hu H, Hu Y, Yang P, Han Z. ARHI, as a novel suppressor of cell growth and downregulated in human hepatocellular carcinoma, could contribute to hepatocarcinogenesis. Molecular Carcinogenesis. 2009;48:130–140. doi: 10.1002/mc.20461. [DOI] [PubMed] [Google Scholar]
- Huang J, Zhang Y, Teng X, Lin Y, Zheng D, Yang P, Han Z. Down-regulation of SFRP1 as a putative tumor suppressor gene can contribute to human hepatocellular carcinoma. BMC. Cancer;7:126. doi: 10.1186/1471-2407-7-126. [DOI] [PMC free article] [PubMed] [Google Scholar]
- Zi X, Guo Y, Simoneau AR, Hope C, Xie J, Holcombe FR, Hoang BH. Expression of frzb/secreted frizzled-related protein 3, a secreted Wnt antagonist, in human androgen-independent prostate cancer PC-3 cells suppresses tumor growth and cellular invasiveness. Cancer Res. 2005;65:9762–9770. doi: 10.1158/0008-5472.CAN-05-0103. [DOI] [PubMed] [Google Scholar]
- Calvisi DF, Simile MM, Ladu S, Pellegrino R, DeMurtas V, Pinna F, Tomasi ML, Frau M, Virdis P, De Miglio MR, Muroni MR, Pascale RM, Feo F. Altered methionine metabolism and global DNA methylation in liver cancer: relationship with genomic instability and prognosis. Int J Cancer. 2007;121:2410–2420. doi: 10.1002/ijc.22940. [DOI] [PubMed] [Google Scholar]


