Abstract
The interface pressure is currently the only clinical tool to estimate the risk of sitting-related pressure ulcers. However, it provides little information on the loading condition in deep tissues. We present a comprehensive 3-D finite element (FE) model for human buttocks with the consideration of the joint configuration and realistic boundary conditions in a sitting posture. Sitting induced soft tissue deformation, internal pressure, and von-Mises stress were computed. The FE model was well validated qualitatively using actual displacement obtained from magnetic resonance imaging (MRI) images. FE analysis demonstrated that the deformation induced by sitting pressure was substantially different among muscle, fat, and skin. The deformation of the muscle varied with location and the maximum was seen in the regions underneath the bony prominence of ischial tuberosity. In these regions, the range of compressive pressure was 65–80 kPa, 50–60 kPa, and 55–65 kPa, for skin, fat, and muscle, respectively. The von-Mises stress distribution had a similar pattern. In conclusion, this study suggests a new methodology for the development and validation of FE models for investigating the risk of sitting-related soft tissue injury. The proposed model may provide researchers and therapists with a powerful technique for evaluating the effectiveness of various postural modulations in preventing deep tissue ulcers.
Index Terms: Buttocks, finite element method, pressure ulcer, sitting
I. Introduction
In the United States, 40% of the 1.4 million people who rely on wheelchairs for mobility develop serious tissue breakdown [1]–[3], i.e., pressure ulcers, in areas such as the ischia and sacrum [4]–[6]. This calamity has a detrimental impact on the quality of life of the affected population and imposes a tremendous economic burden on health care.
It is accepted that the primary etiological factor of the pressure ulcers on the buttocks is prolonged concentrated sitting pressure [7]. A better understanding of the relationship between sitting pressure and tissue damage will assist in the development of treatment/prevention strategies for pressure ulcers. There is a need to establish the associations between the external mechanical loads exerted by sitting and the induced internal mechanical condition within the soft tissues in buttock area [8]–[10]. It is pointed out that the interface pressure measurements per se may be useful in clinical evaluation of sitting surfaces, but represents only a very small solution to the overall problem [11] and provides little information for the loading condition within deep tissues [12],[13]. The differences in composition, structure, and metabolic rate predispose different tissues (skin, fat, and muscle) to various vulnerabilities to mechanical load induced breakdown [14]. Moreover, the complex anatomical geometries and the intrinsic differences in the mechanical properties of each tissue define the extremely complicated internal mechanical environment within the buttocks during sitting. Therefore, a tool which handles the analysis of mechanical environment in complicated structure would be of great help.
Finite element (FE) analysis, a powerful tool to investigate the mechanical environment within complicated geometries, allows examination of mechanical responses in deep tissues (e.g., fat or muscle) of the buttocks resulting from external sitting pressures. Several such FE models have been developed [9], [11], [13], [15]–[19]. However, several intrinsic weaknesses are associated with these models. First, the geometry was overly simplified to simple geometrical objects [11], [17] to approximate the complicated anatomical structure. Second, for those models which did have accurate geometry based on magnetic resonance imaging (MRI) recordings, the MRI measurements were performed in a supine posture, in stead of in a sitting posture [18], [20]. The geometry obtained from recordings in supine differs from that of the sitting posture, because the joint configuration, soft-tissue composition, and soft tissue strain conditions are intuitively different. Therefore, the applicability of such models in sitting-related research is questionable.
The objective of this investigation was, therefore, to develop and validate a comprehensive 3-D FE buttock model in a sitting posture to simulate and predict reliably how the skin, fat, and muscle in the buttock–thigh region mechanically respond to sitting pressure.
II. Material and Methods
A. FE MODEL Development
1) Participant
A healthy subject (male, 24 years, 165 cm, 70 kg) with no history of neuromuscular disorders was tested. Written informed consent was obtained following the guidelines of the Institutional Review Board of the performance site.
2) Posture and Loading Configurations
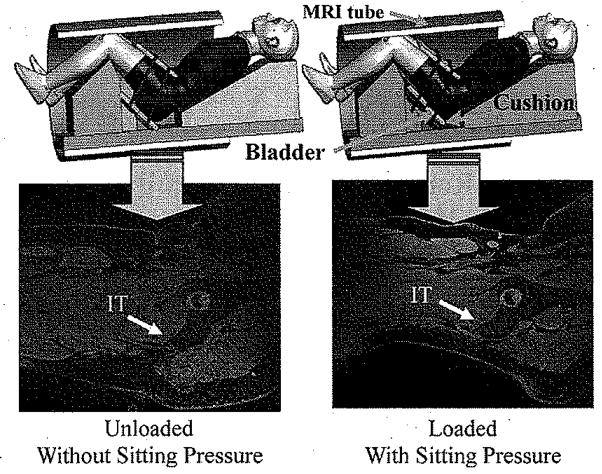
A custom built apparatus made of plastic foam and rubber was used to place the subject in a simulated sitting posture (Fig. 1). Two loading conditions were used (“without sitting pressure” and “with sitting pressure”) during the MRI recording. The sitting pressure was applied to the buttocks with an adjustable cushion placed under the buttock–thigh. The cushion was a sandwich structure consisting of two layers of stiff materials with a rectangular air bladder in between, while two belts tied the cushion tightly against the buttocks. Inflation and deflation of the air bladder provided different loading conditions, as shown in Fig. 1. The magnitude of the applied sitting pressure for the “with sitting pressure” configuration was selected from an actual average interface pressure under buttock (152.6 ± 20.9 mm Hg, 20.3 ±2.8 KPa) measured with a pressure mapping system, X2 (Xsensor Technology, Calgary, AB, Canada) for this subject in an up-right sitting posture. MRI images obtained from “without sitting pressure” were used for development of the geometry of the FE model and those from “with sitting pressure” were used for validation of the FE analysis.
Fig. 1.
Experimental setup for recording MRI images from buttock–thigh area in a simulated sitting posture with simulated sitting load applied. Upper row: MRI setup to measure buttock–thigh structure under two loading configuration (Left: without sitting pressure; Right: with sitting pressure) for the simulated sitting posture. Two belts tied the cushion with the buttocks. An air bladder was placed in between of the two layers of the cushion. Inflation and deflation of the air bladder provided different loading levels. Lower row: corresponding MRI images.
3) MRI Imaging
MRI images of buttock-thigh were obtained (Fig. 1) for the above two loading conditions in one simulated sitting posture (80° flexion for hip and 90° flexion for knee). The MRI parameters were 1.5 T, 576 × 576 matrix, 35 × 35 cm DFOV, 0.6 mm interslice thickness.
4) Model Construction
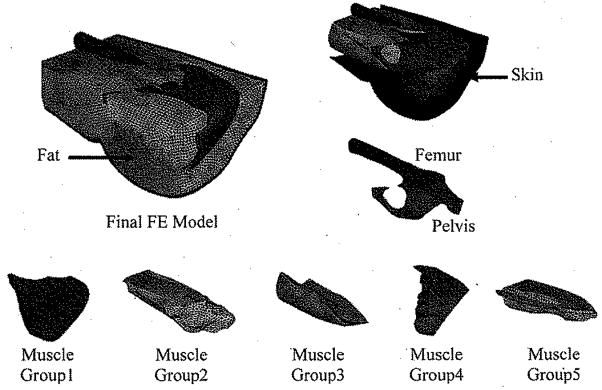
An FE model was created based on the 3-D reconstruction of the buttock-thigh structure obtained from MRI images under the “without sitting pressure” configuration (Fig. 2). Contours of the femur, pelvis, skin, fat, and five muscle groups were identified and digitized from MRI images by using WinSurf (SURFdriver, Kailua, HI). The five muscle groups were as follows:
Fig. 2.
Final FE model: structural elements, i.e., bones (pelvis and femur), skin, fat, and muscle groups were created based on the 3-D reconstruction of the buttock-thigh structure obtained from MRI images under the “without sitting pressure” configuration. Five muscle groups were as follows: Group 1: Minimus, Medius andMaximus Gluteus; Group2: Adductor Longus, Adductor Brevis, Adductor Magnus, and Pectineus; Group3: Biceps Femoris (long head), Semitendinosus, and Gracilis; Group4: Piriformis, Superior and inferior Gemellus and Obturator Internus; Group5: Vastus Lateralis, Vastus Intermedius, Vastus Medialis and Rectus Femoris.
Group1: Minimus, Medius, and Maximus Gluteus;
Group2: Adductor Longus, Adductor Brevis, Adductor Magnus, and Pectineus;
Group3: Biceps Femoris (long head), Semitendinosus, and Gracilis;
Group4: Piriformis, Superior and inferior Gemellus and Obturator Internus;
Group5: Vastus Lateralis, Vastus Intermedius, Vastus Medialis and Rectus Femoris.
The digitized information was then translated into Hyper-Mesh (Altair Engineering, Inc., Troy, MI) to create the FE mesh. The final FE model consisted of 453 502 four-node tetrahedral solid elements for the pelvis, femur, inner side of the skin, fat and five muscle groups, and 33 924 three-node triangle membrane elements for the outer side of the skin (Fig. 2).
5) Material Model
Since pressure sores develop after prolonged loading with large deformation of the soft-tissue, static equilibrium equations with large deformation were assumed in the material model in this FE model. The elastic Moony-Rivlin model [9] (first-order polynomial model), which can account for large deformation behaviors of materials, was employed for skin, fat, and muscle. The model was based on the following strain energy function W (1):
| (1) |
W is the strain energy per unit of reference volume; J is the total volume ratio; C10, C01, and D1are temperature-dependent material parameters; Ī1 and Ī2 are the first and second deviatoric strain invariants defined as following (2) and (3):
| (2) |
| (3) |
The deviatoric stretches λ̄i = J−1/3λi Here, λi are the principal stretches.
The material parameters for skin, fat, and muscle were determined based on values obtained from literatures [9], [11]. For all soft-tissues, D1 was determined based on the method reported by Dabnichki et al, [9] with an assumption that the materials were nearly incompressible (Poisson ratio ≅ 0,485).
6) Boundary and General Loading Conditions
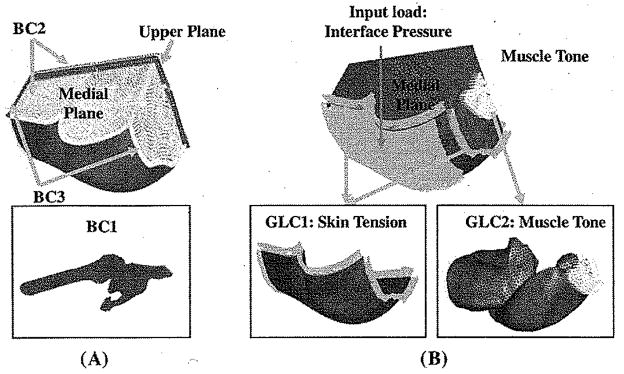
Three different boundary conditions (BC) were employed [Fig. 3(a)]. The femur and the pelvis were assumed as rigid bodies and constrained to obviate rigid body motion (BC1). The medial plane was constrained against the medial–lateral motions because of the symmetric condition of the buttocks (BC2). Also for BC2 was that the upper plane was constrained from the anterior–posterior movement. The ends of tissues that connect to the rest of the body (distal end to the thigh, proximal end to lumbar region) were constrained against longitudinal motions (BC3).
Fig. 3.
Boundary and loading conditions used in the FE model. (A) Boundary conditions (BC). BC1: The femur and the pelvis were assumed as rigid bodies and constrained to obviate rigid body motion; BC2: The upper plane and the medial plane were constrained against the anterior-posterior and medial-lateral motions; BC3: Ends of tissues that connect to the rest of the body (distal end to thighs, proximal end to lumbar region) were constrained against longitudinal motions. (B) General loading conditions (GLC) and the input load (Specific loading condition) for the model. GLC1: A “skin initial strain” was applied into the skin layer of the FE model; GLC2: A “muscle tone” which was 1% of maximal muscle force estimated from Fmax = σmax × PCS A, was applied along the line of action of each muscle. In the above equation, σmax is the maximal muscle tension [22]; Input load (specific loading condition): an interface pressure of 20.34 kPa was applied to the buttock sitting surface of the model, (a) Boundary conditions (b) Loading conditions.
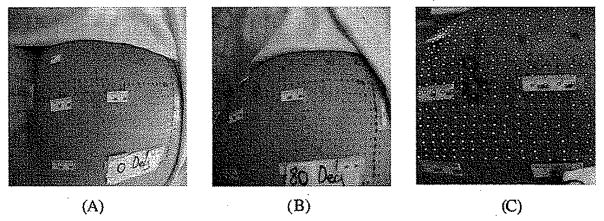
When the load from the sitting was considered as the specific loading applied as the input to the FE model, 2 general loading conditions (GLC) were also employed [Fig. 3(b)] for simulation of the “with sitting pressure” configuration. 1) A “skin initial strain” was applied into the skin layer of the FE model (GLC1) (Fig. 3). The “skin initial strain” was defined as the strain of the buttock skin when the subject moved from a standing posture to an upright sitting posture. The buttock skin initial strain in 80° hip and 90° knee flexion was measured by images of an array of dots painted on the buttock skin (Fig. 4). Green strain [21] was calculated for an area of 15 × 15 mm2 as 43.6 ± 10.4% and 11.2 ± 0.7% for the axial and transverse directions, respectively. 2) A “muscle tone”, which was 1% of maximal muscle force estimated from Fmax = σmax × physiological cross-sectional area (PCSA), was applied along the line of action of each muscle. In the above equation, σmax is the maximal muscle tension [22] (GLC2).
Fig. 4.
Measurement of the buttock skin initial tensile strain induced by a sitting posture relative to a standing posture. Measurement was performed on the subject in the same hip and knee joint configuration as that in the sitting posture used to record MRI images, i.e., 80° hip flexion and 90° knee flexion. Buttock skin initial strain was measured by images of an array of dots painted on the buttock skin. Green strain [21] was calculated for an area of 15 × 15 mm2.
B. FE Model Solution
For the above established FE model, a sitting area was precisely identified from the corresponding MRI images. Then the measured buttock contact pressure (152.60 mmHg, 20.34 kPa) during the MRI recording in “with sitting pressure” condition was applied onto this sitting area of the FE model. A uniform contact pressure of 152.60 mmHg was used in solving the FE model. This was because a constant pressure was actually applied to the buttocks when the “with sitting pressure” MRI images were taken. Therefore, to be consistent with the loaded condition shown in MRI images, the FE model should be fed with the same input load to be able to perform the comparison in the validation process. The FE model was solved using ABAQUS software (ABAQUS 6.5, ABAQUS, Inc., Providence, RI).
C. FE Model Validation
Upon solved, the FE model was validated quantitatively via comparison of the output of the FE simulation with measurements from the MRI images. Two comparisons were performed: 1) the sitting induced gross displacement of soft tissues; 2) the sitting induced position shift of the muscle underneath the ischial tuberosity (Group1).
1) Sitting Induced Gross Displacement of Soft Tissues Computed by FE Analysis and That Measured From MRI Images
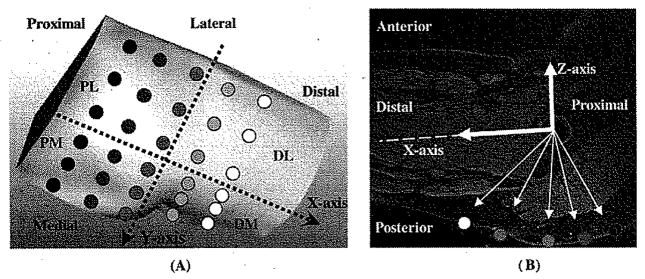
It was assumed that the bony structure remained the same when loaded. A Cartesian coordinate system was defined based on the femur-pelvis bony structure. This coordinate system took the center of the femoral head as its origin. The X axis was pointing to the distal along the femoral shaft. The Y and Z axes were pointing to the medial and the superior, respectively (Fig. 5). Thirty regions of interest (ROIs) were identified over the skin of the sitting area (Fig. 5). For measurement on MRI images, the morphological alteration of buttock soft tissues induced by sitting pressure of 20.34 ± 2.79 KPa was identified for these ROIs by comparing MRI images obtained in loaded condition to the matching image from unloaded condition. On each image, vectors pointing from the origin of the coordinate system to the specific locations on the skin were constructed to compute the gross displacement. In order to compare the differences in different portions of the buttock, four regions, the distal–medial (DM), distal–lateral (DL), proximal–medial (PM), and proximal–lateral (PL) regions, were defined (Fig. 5).
Fig. 5.
Cartesian coordinate system used in the study. Origin of the coordinate system was at the center of the femoral head. The X axis was along the femoral shaft pointing to the distal. Y and Z axes were pointing to the medial and the superior, respectively. Thirty ROIs were identified over the skin of the sitting area. The buttock–thigh area was divided into four regions, the DM, DL, PM, and PL regions.
The same coordinate system mentioned above was established for the FE model. The 30 ROIs were also identified for the FE model for both the “without sitting pressure” and “with sitting pressure” configurations. The sitting induced changes of the coordinates of the FE nodes in these ROIs were taken as the FE predicted gross displacement. These displacements were then compared with the measurements from MRI images.
2) Position Shift of the Muscle Group 1 Beneath the Ischial Tuberosity
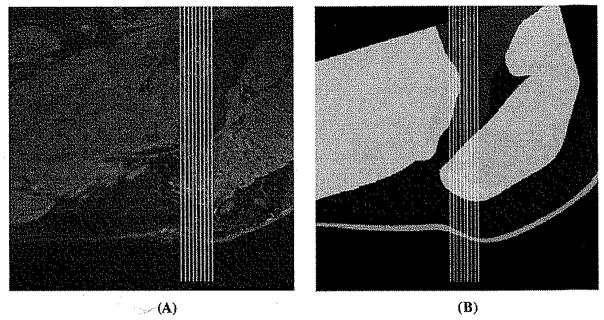
In the sitting condition, it is apparent that the tissue underneath the ischial tuberosity is loaded more than tissues at other locations. Therefore, the muscle here may be pushed away from its original position. This shift of position of muscle Group 1 can be used as a validation parameter. A small area right beneath the ischial tuberosity was selected to calculate the shift of the muscle Group1 induced by sitting load of 20.34 kPa (Fig. 6). Taking the tip of the ischial tuberosity as the center, this area covered ±15 mm in the proximal-distal direction and ±6 mm in the medial–lateral direction (Fig. 6). For this volume, in the medial–lateral direction, 12 sagittal slices were taken for the FE/MRI models. On each of these sagittal slices, 11 lines in anterior–posterior direction were defined with a distance of 3 mm between neighboring lines. Therefore, altogether 132 anterior–posterior lines were determined in this volume. For MRI model, the proximal-distal shift of this volume under sitting load was measured as the average proximal-distal shift of these 132 lines. For the FE model, the proximal-distal shift of this volume was obtained by identifying the changes of the coordinates of the FE nodes within this volume.
Fig. 6.
Sagittal view of the small area right beneath the ischial tuberosity which was selected to calculate the shift of the muscle Group1 induced by sitting load of 20.34 kPa. This area covered 30 mm in the proximal–distal direction and 12 mm in the medial–lateral direction and centered at the tip of the ischial tuberosity. This shift was measured from the MRI images (left) as well as from the sections of the FE (right) analysis. (A) Selected area on MRI images for calculating muscle Group1 shift. (B) Selected area on the FE model for calculating muscle Group1 shift.
D. FE Model Application—Predicting Soft Tissue Deformation and Internal Stress
1) Predicting Deformation (Compressive Strain) of the Soft Tissues by FE Analysis
This prediction was performed for a sagittal piece of the entire buttock–thigh. This sagittal piece had a thickness of 12 mm with its medial–lateral center at the tip of the ischial tuberosity. In this sagittal piece, the gross deformation of each layer was calculated using the changes in the coordinates of the FE nodes, 42 nodes per layer, in anterior–posterior direction when the buttock–thigh was loaded by 20.34 kPa.
2) Calculation of Internal Pressure Distribution and Von-Mises Stress Within Soft Tissues by FE Analysis
The pressure and von-Mises stress distribution were calculated for the muscle, fat, and skin for the entire buttock–thigh, particularly in the area below the bony prominence (i.e., ischial tuberosity). Although it still is uncertain what mechanical parameters are the most relevant to tissue damage [11], evidences supported that living cells are more vulnerable to deformation than to a high hydrostatic pressure [12]. Therefore, the von-Mises stress, which is related to the deformational energy stored in the material [11], [13], [18], was analyzed to identify the risk of possible tissue damage by sitting load.
E. Statistical Analysis
A linear model ANOVA was used with the dependent variable as the regions (PM, PL, DL, and DM) on the buttock–thigh area to identify significant differences among the gross displacement results obtained from either MRI images or FE analysis. A paired t-test was used to identify significant differences between the results obtained from MRI images and those from FE analysis. Statistical analysis was performed with SAS software (SAS 9.3, SAS Institute, Gary, NC). The significance level was set up as 0.05.
III. Results
A. Soft Tissue Gross Displacement Induced by Sitting
1) From MRI Images
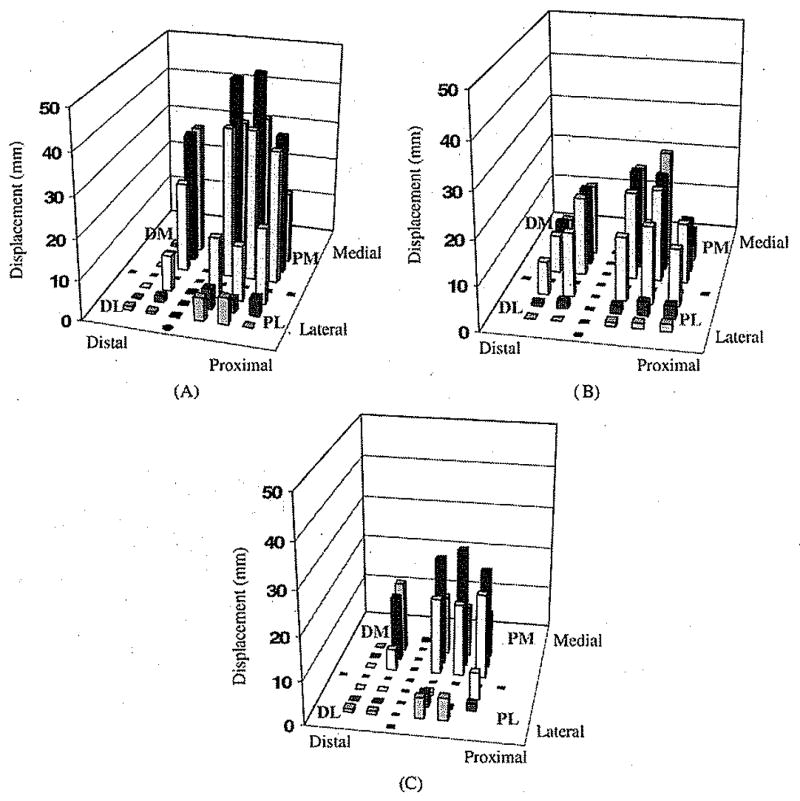
Fig. 7(a) gives the actual anterior–posterior gross displacement measured from MRI images (16.8 ± 16.5 mm) for the 30 ROIs. ANOVA analysis detected a significant (P < 0.001) “region” effect on the anterior–posterior displacement. The largest values were seen in the PM region of the buttock covering the ischial tuberosity (36.6 ± 9.0 mm, P < 0.002).
Fig. 7.
Gross displacement in anterior–posterior direction from 30 ROIs distributed in four main regions of the buttock–thigh: DL, PL, DM, and PM: (A) measured from MRI images, (B) predicted by the FE analysis, and (C) average difference of the displacement between those measured on MRI images and those from FE analysis.
2) From FE Model Prediction and Comparison With Those From MRI
Fig. 7(b) gives the gross displacement in the anterior–posterior direction predicted from the FE analysis (10.7 ± 8.0 mm) for the 30 ROIs. ANOVA analysis detected a significant (P < 0.001) “region” effect and the largest displacements were seen also in the PM region (18.1 ± 5.8 mm, P < 0.002) of the buttock covering the ischial tuberosity. The displacement pattern in the posterior-anterior direction was compared with that measured from MRI images [Fig. 7(a)].
The difference between the anterior–posterior displacement obtained from MRI and the FE model was 6.2 ± 10.4 mm over the 30 ROIs (P = 0.003). The difference between the actual and the computed displacement is shown in Fig. 7(c).
The displacement predicted by the FE model in medial–lateral direction was found significantly different among the four regions (P < 0.001). Among them, the medial–lateral displacement of the PM region (2.2 ± 2.1 mm) was significantly (P < 0.001) smaller than that from the lateral regions of the buttock–thigh, i.e., the DL (8.7 ± 2.1 mm) and PL (10.2 ± 3.2 mm). Similarly, this displacement of soft tissues in DM region (2.4±2.1 mm) was also significantly (P < 0.002) smaller than that in the two lateral regions.
B. Position Shift of the Muscle Group 1 Induced by Sitting
From MRI images, muscle Group 1 was found shifted significantly toward the proximal (24.9 ± 3.0 mm, P < 0.001 when compared to zeros) and the anterior (23.6 ± 1.2 mm, P < 0.001 when compared to zeros) directions when loaded with sitting pressure of 20.34 kPa. The corresponding shift of the muscle Group1 predicted by FE analysis was 7.5 ± 1.6 mm and 13.9 ± 1.2 mm in the proximal and anterior directions, respectively, also with statistical significance when compared with zeros (P < 0.001).
C. Deformation (Compressive Strain) of Skin, Fat and Muscle Within the Selected Sagittal Piece of the Buttock–Thigh
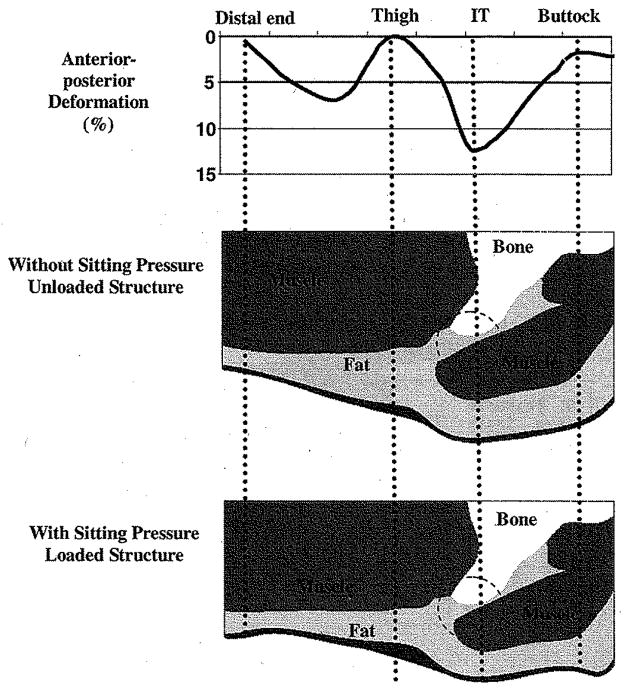
The output of the FE analysis showed that the deformation induced by sitting pressure of 20.34 kPa was substantially different among muscle, fat, and skin. Generally, the deformation of the skin (1.87 ± 1.77%, N = 42) was smaller than that in fat (33.79 ± 2.17%, P < 0.001, N = 42) and muscle (5.55 ± 3.57%, P < 0.001, N = 42) for the selected sagittal piece of buttock–thigh. The deformation of the fat layer was relatively uniform, while the deformation of the muscle layer varied. In muscle layer, the closer to the ischial tuberosity, the more the deformation was. The maximum deformation was seen in the regions underneath the bony prominence of ischial tuberosity (11.93 ± 1.66%, N = 12), Fig. 8 shows a typical deformation pattern below the ischial tuberosity in the anterior–posterior direction on muscle along the proximal–distal direction.
Fig. 8.
Typical anterior–posterior deformation (%) in the muscle layer in a sagittal section (upper). Predicted deformation on the buttock–thigh soft tissues (Bottom) in this section. Large deformation is identified in fat and muscle in the region (circle in figure) immediately underneath the ischial tuberosity (IT).
D. Internal Pressure and Von-Mises Stress Distribution
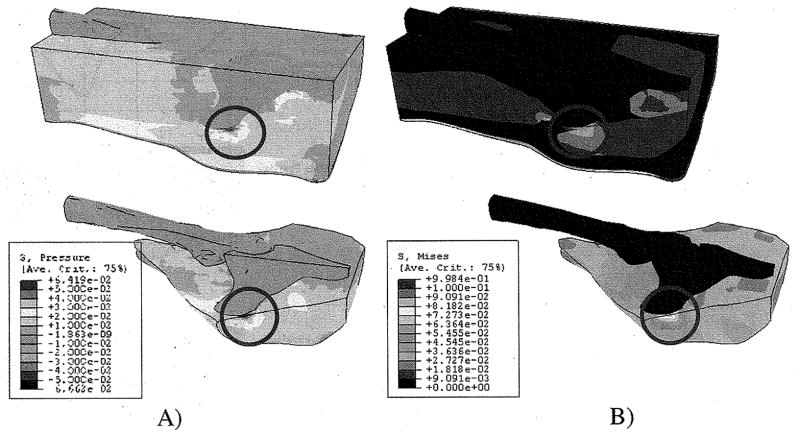
Fig. 9(A) shows the distribution of the internal pressure predicted by FE analysis. For all layers, higher compressive pressure was found in the PM area of the buttock covering the ischial tuberosity. The range of high compressive pressure was 65–80 kPa, 50–60 kPa, and 55–65 kPa, for skin, fat, and muscle, respectively, in the area close to the bony prominence of ischial tuberosity.
Fig. 9.
Internal pressure (A) and von Mises stress (B) distribution for the entire structure of the buttock–thigh. High pressure is identified in the fat and muscle in the region (circle in figure) immediately beneath the ischial tuberosity. (A) Internal pressure distribution. (B) von Mises stress distribution.
The pattern of the von-Mises stress distribution was, in general, similar to that of the pressure. Fig. 9(B) shows the distribution of the von-Mises stress for the entire buttock–thigh with the details of the results on the muscle close to the bony prominences. The range of high von-Mises stress was 50–80 kPa, 35–45 kPa, and 45–50 kPa, for skin, fat, and muscle, respectively.
IV. Discussion and Conclusion
The present study proposed an FE model for buttock–thigh in a sitting posture for evaluating sitting induced mechanical stress–strain in buttock–thigh soft tissues. The FE model was also validated through comparing the predicted soft tissue displacement with that measured from MRI images in the same loading condition. In addition, the validated FE model was used to predict the deformation and the von Mises stress distribution induced by a sitting load for soft tissues, including muscle, fat and skin in buttock–thigh area.
This study is one of the first approaches to develop a 3-D FE model of the buttock–thigh to study mechanical responses in the deep tissue subjected to sitting pressure with the consideration of an accurate anatomical geometry in an actual sitting joint configuration and realistic boundary conditions. The developed complicated and comprehensive 3-D FE model may also improve accuracy in analysis of mechanical responses compared with simple 2-D FE models developed previously [8], [9], [11], [12], [15], [17]. Although 2-D FE analysis has the advantages of simplifying the steps of constructing an FE model and consuming less amount of CPU time for running the simulation, the performance, the usefulness, and the applicability are largely limited by the overly simplified geometry and the many assumptions on boundary and loading conditions. Many of the 2-D models represented the complicated structure of the buttocks using simple objects such as cylinder and sphere. However, the loading and boundary conditions and the geometry of the buttocks are so complicated that we should not expect accurate, or even close, estimation of the stress/strain distribution from 2-D FE analysis. Our 3-D FE buttock model presented in this manuscript faithfully maintained the complicated and comprehensive 3-D structure of the buttocks and the upper thighs.
In addition, the 3-D FE model is fine tuned with realistic boundary and initial loading conditions such as the skin tension in a sitting posture and the muscle tone. These features overcome the structural limitation of the 2-D models reported in the literatures and are expected to provide improved accuracy in predicting stress/strain distribution within the buttocks.
For the boundary condition of the FE model, the medial and the upper planes were constrained against the medial–lateral and the posterior–anterior motions, respectively. These boundary conditions were applied to the FE model based on the axisymmetric characteristic of the developed FE structure and to reduce the error induced by a rigid body motion. The buttock–thigh structure is actually irregular. The axisymmetric assumption may be, therefore, in disagreement with actual boundary condition of the buttock–thigh. The assumption may also affect the accuracy of the mechanical responses (i.e., shear stress) predicted by FE analysis. The assumption used in this study may be, however, well corresponded to actual boundary condition of the buttock–thigh. It is considered that the assumption is valid because it was determined based on the boundary conditions used in various literatures [9], [11], [18] related to the FE analysis of the buttock.
Although FE models have been developed fairly extensively for the study of pressure ulcers on the buttock [9], [11], [13], [15]–[19], most of them were development based on supine MRI images [13], [18], [20]. In a cadaver dissection and an MRI recording performed by the authors, we found that, when the hip was being flexed, the muscle, mainly the Maximus Gluteus which was seen in standing and supine posture covering over the ischial tuberosities, gradually slide laterally away from the bony prominence. This finding suggested that, in sitting posture (hip flexion of 90°), the layered structure of buttock soft tissues changed substantially from that of a standing/supine posture. Therefore, to be a valid tool for evaluating sitting posture, a buttock FE model should be constructed using the anatomical geometry from a seated subject. To overcome the structural limitation caused by using supine MRI for a sitting FE model, Todd and Thacker [18] used adjusted material properties to represent a material characteristic of the soft-tissue of the buttock in a sitting posture. However, the FE model could not explain an alteration (e.g., movement, compressibility, or thickness variation) in muscular-skeletal structure caused by a posture change from supine to sitting. In their latest study, Linder–Ganz, et al. [23] used 3-D FE model based on MRI images obtained in an open MRI machine in a sitting posture. Their model and ours are the only two 3-D FE models developed based on the geometry of seated individuals. Therefore, by using the correct geometry of the sitting anatomy, the current FE model developed in this study may have the advantage over the previously reported models which were developed using supine anatomic structure. This advantage may translate to more reasonable results in further application of this model in study of pressure ulcers for patients who experience prolonged sitting pressure.
Serious skin breakdown in the spinal cord injury population has been reported most frequently over the ischial tuberosities [24] due to concentrated high pressure over bony prominences, which has been considered the most important etiologic factor in pressure ulcer formation in wheelchair users [7]. These facts favorably correspond to the results predicted from our FE analysis. Larger deformation, higher pressure and von-Mises stress on the soft tissues were generally shown in the regions below bony prominence of ischial tuberosity.
It has been concluded that muscle tissue is highly susceptible to localized compression [14], [25], eventually leading to tissue degeneration in the form of a deep pressure ulcer, which progresses towards the skin surface. This fact also found its strong evidence in our FE results showing that higher pressure and von-Mises stress occurring in the muscle layer.
Our validation result showed that the original tissue thickness and the reduction, which was induced by the sitting pressure, was identified from the MRI as generally higher than when compared with the FE analysis. We believe that the primary factor of the difference between the model prediction and the measurement on MRI images is the lack of an optimal material model and precise material properties in our FE analysis. First, human soft tissues are highly deformable and present apparent nonlinearity which can hardly be precisely described by current material models. By looking at the plot of the differences between the model prediction and the MRI measurements [Fig. 7(C)], it can be seen that at the locations where very large deformation was measured on MRI images, the difference was larger than that at other locations. Therefore, there appeared to be that, in the results of this study, the more deformation a location had, the more the FE analysis was away from the actual displacement. This trend suggested a possibility that the nonlinear material model used in the FE analysis did not follow well enough to the behavior of real soft tissues when large deformation presented. Second, it was difficult to measure directly the material properties of the actual human via in vivo test and to apply them into the FE model. Therefore, this study used the material properties obtained from literature, which most of the time were not from in vivo test on human bodies and sometimes were from animal tissues.
Therefore, the accuracy of the model prediction may be improved by incorporating a better material model and by applying more accurate material properties of actual human tissues into the FE model. However, these findings may support the fact that the developed FE model can explain actual tissue deformation patterns, particularly in the region immediately below the ischial tuberosity.
Our results of the internal pressure and von Mises stress distribution also support the theory that the highest stress occurred in the muscle immediately below the ischial tuberosity [8], [9], [11], [13], [17], [18]. Chow and Odell [8] reported that the stress distribution was more severe at internal locations over-lying bony prominences than on the surface of the buttocks. Dabnichki et al. [9] found maximum compressive stresses of 43–51 kPa close to the bony prominence depending on the surface conditions between the buttock and a sitting cushion. Todd and Thacker [18] reported von Mises stresses of 45–75 kPa and internal stress of approximately 74 kPa in the tissue surround the ischial tuberosity. Particularly, the von Mises stress values reported by Todd and Thacker [18] were in a close range of our von Mises stress range of 45–50 kPa within the muscle immediately below the ischial tuberosity. Oomens et al. [11] also found that the von Mises stress was highest immediately below bony prominences, reaching a value of 180 kPa. In an animal study, Linder–Ganz and Gefen [13] reported von Mises stresses of 150–290 kPa below the ischial tuberosity. However, in their later research on human subjects [23], a much lower von Mises stresses (20–53 kPa) was reported. Kuroda and Akimoto [17] reported that the maximum stress of 4.0–7.6 kPa appeared at the region immediately below the ischial tuberosity depending on the interface conditions between hard (e.g., ischial tuberosity) and soft-tissue (e.g., muscle or fat). The stress values reported by Oomens et al. [11], Linder–Ganz and Gefen [13] and Kuroda and Akimoto [17] were somewhat larger or smaller than those predicted from Dabnichki et al. [9], Todd and Thacker [18] and our study, although the region experiencing the highest stress was the same. This may be due to differences of the configurations (e.g., material parameters and model types, loading and boundary conditions, morphological characteristics, etc.) applied to the FE models.
Todd and Thacker [18] and Dabnichki et al. [9] showed displacements of 12–18 mm and 15–18 mm on the skin of the buttock below the ischial tuberosity. Our result of displacement (approximately 18 mm) on the skin below the ischial tuberosity was highly comparable with these reported values. Using a rat model, Linder–Ganz and Gefen [13] reported the compressive strain between 3% and 9% within the muscles below the ischial tuberosity, which was supported by our data of 6%–12% within the muscle in the same area. However, in a later human subject study of Linder–Ganz, et al. [23], a substantially higher compressive strain (70%–84%) was reported for the gluteus muscle, which was far from our findings and their previous data on rats. Obviously, more research is needed to elucidate these inconsistencies.
Our findings are also consistent with the well-accepted fact that larger deformation is generally seen on the region below the ischial tuberosity, i.e., the PM region defined in current study.
Some limitations may have contributed to the discrepancy of the predicted values of displacement from those obtained from the MRI. One such limitation could be the assumption of isotropy with passive characteristic for the muscle. Generally, muscle is considered an active material with transverse isotropy or orthotropy. The current FE model could be acceptable for the study of pressure ulcers because the assumption is in the range of the following generally allowable concepts: 1) the muscles of the buttock–thigh are in an ignorable active state in the sitting position, and 2) this FE model for the study of pressure ulcers is focused on the identification of material responses in the compressible direction (anterior–posterior direction). It can be assumed that the muscle fibers, which may generate an anisotropic characteristic of the material in tension, may not contribute much when being compressed. The recognition of the muscle tone in our FE simulation may also compensate partially for this limitation.
The current FE model was built based on the geometry and loading condition from a single subject which may limit its general application to evaluate sitting condition. Further work is being conducted in the authors’ laboratory to build representative FE models for several typical populations who are concerned for sitting induced complications, such as individuals with spinal cord injury.
There is a limitation in the validation method. Measurement of displacement from MRI images was performed on sagittal images. In this way, it implied an assumption that the medial–lateral displacement is zero, which may not differ from the real scenario. The output of displacement from the FE model was calculated by the changes of the location of the FE nodes predicted by the simulation. Therefore, this prediction was in three dimensions. This omission of medial–lateral movement of soft tissues, in MRI measurement may have contributed to the difference found between the FE model prediction and the MRI measurement. However, as the FE model predicted, the medial–lateral displacement of the FE nodes in PM region was significantly smaller than other parts of the buttocks. In this sense, the less consistency of these two methods has less influence on the PM region, where the ischial tuberosity is located.
This study suggests a validation methodology for a FE model to investigate pressure ulcers in the buttock and a possibility for the utilization of the validated FE model in a future pressure ulcer study. The FE model is the first model that recognizes a true joint configuration of the actual sitting posture representing the real morphology in sitting based on MRI images of the buttock–thigh. Considering the nonlinearity of the skin, fat and muscle makes this model possible to predict realistic mechanical behaviors of the buttock–thigh. In conclusion, this FE model may be a helpful tool for the study of pressure ulcers. Further improvements to overcome the current limitations of the FE model provide higher accuracy. Also, knowledge of the distribution of stresses and strains in deep tissue is essential for the development of effective method that could eliminate the formation of deep tissue injury and ulcers. Such knowledge is, however, currently lacking and the only clinical technique presently available for assessing compressive stresses in seated individuals, particularly in wheelchair dependent individuals, is based on the measurement of surface pressure on the skin of the buttock through the use of pressure mats. The proposed FE model may be, therefore, used in conjunction with surface pressure measurements to estimate the stresses and strains in the deep tissue, particularly at the interface between the bone and muscle. It may provide researchers and therapists with a powerful technique for evaluating the effectiveness of alterations of loading and boundary condition due to various postural modulations and rehabilitation interventions in preventing the formation of deep tissue ulcers.
Acknowledgments
This work was supported by the Falk Medical Research Trust.
The authors would like to thank Dr. K. Shull for sharing his knowledge and experience in soft material modeling, C. Fasanati for MR image acquisition, and K. Weissman for technical assistance of creating the MR-model using Mimics software.
Biographies
Mohsen Makhsous (M’02) received the M.S. degree in mechanical engineering and the Ph.D. degree in biomechanics from the Chalmers University of Technology, Gothenburg, Sweden, in 1993 and 1999, respectively. He completed a postdoctoral fellowship in rehabilitation biomechanics at Northwestern University, Chicago, IL.
He is an Assistant Professor of Physical Therapy & Human Movement Sciences, Physical Medicine and Rehabilitation, and Orthopaedic Surgery at Northwestern University, Chicago, IL. His research interests are in the tissue mechanics related to soft tissue breakdown in spinal cord injury individuals, biomechanics, and rehabilitation biomechanics.
Dr. Makhsous is a member of RESNA, ORS, and American Paraplegia Society.

Dohyung Lim (M’04) received the M.S. degree from Department of Biomedical Engineering, Inje University, Kimhae, Republic of Korea, in 2000, and the Ph.D. degree from School of Biomedical Engineering, Science and Health Systems, Drexel University, Philadelphia, PA. He completed a postdoctoral fellowship in Department of Physical Therapy and Human Movement Science, Feinberg School of Medicine, Northwestern University, Chicago, IL.
He is a Research Professor of Biomedical Engineering, Yonsei University, Wonju, Republic of Korea. His research interests are in biomechanics, bone and soft-tissue mechanics, orthopedic biomechanics, sports biomechanics, rehabilitation engineering, bone mechanotransduction, tissue engineering, and medical instrumentation development and commercialization.
Dr. Dohyung Lim is also a member of Orthopaedic Research Society (ORS) and the American Society of Mechanical Engineering (ASME).
Roland Hendrix received the M.D. degree from Washington University School of Medicine, in 1969.
After his residence and fellowship at the Medical Center at the University of Chicago, he joined the Department of Radiology of Feinberg School of Medicine at Northwestern University. He is now an Associate Professor and as an attending radiologist in Northwestern Memorial Hospital. His research interest is in musculoskeletal radiology.
James Bankard received the B.S. degree in biomedical engineering from Johns Hopkins University, in 2002.
He is a consultant for the Department of Physical Therapy and Human Movement Sciences at Northwestern University, Chicago, IL. His research interests include tissue mechanics, postural biomechanics, and control systems programming.
William Z. Rymer (M’94) received the M.B.B.S. degree from Melbourne University, Melbourne, Australia, 1962. After Residency training in internal medicine and neurology, he returned to graduate training and received the Ph.D. degree in neurophysiology from Monash University, Australia.
After postdoctoral training at the National Institutes of Health and John Hopkins University Medical School, Baltimore, MD, he became an Assistant Professor of neurosurgery and physiology at State University of New York, Syracuse. In 1978, he became an Assistant Professor of physiology at Northwestern University Medical School, Chicago, IL. He now holds the John G. Searle Chair in Sensory Motor Performance Program at the Rehabilitation Institute of Chicago, Chicago, IL, while also holding appointments as Professor of physiology and biomedical engineering at Northwestern University and at VA Lakeside, Chicago, IL. His research is concerned with biomechanics and neural control of movement.

Fang Lin (M’98) received the D.Sc. degree in electronic engineering and information processing from the University of Science and Technology, Hefei, China, in 1997. She completed a postdoctoral fellowship in biomedical engineering in Tsinghua University, Beijing, China, in 1999, and a postdoctoral fellowship in biomechanics at Northwestern University, Chicago, IL, in 2003.
She is a Research Assistant Professor of Physical Therapy and Human Movement Sciences, and Physical Medicine and Rehabilitation at Northwestern University, Chicago, IL. Her research interests are in the orthopaedic and biomechanics, tissue material properties post spinal cord injury, and rehabilitation biomechanics.
Dr. Lin is a member of RESNA and ORS.
Footnotes
This paper was presented in part at WC2006, Seoul, Korea August 2006.
Contributor Information
Mohsen Makhsous, Email: m-makhsous2@northwestern.edu, Departments of Physical Therapy and Human Movement Science, Physical Medicine and Rehabilitation, and Orthopaedic Surgery Northwestern University, Chicago, IL 60611 USA and also with the Sensory Motor Performance Program, Rehabilitation Institute of Chicago, Chicago, IL 60611 USA.
Dohyung Lim, Department of Physical Therapy and Human Movement Science, Northwestern University, Chicago, IL 60611 USA and also with the Department of Biomedical Engineering, Yonsei University, Wonju, Kangwon 220-710, Korea.
Ronald Hendrix, Department of Radiology, Northwestern University, Chicago, IL 60611 USA.
James Bankard, Department of Physical Therapy and Human Movement Science, Northwestern University, Chicago, IL 60611 USA.
William Z. Rymer, Departments of Physical Medicine and Rehabilitation, Biomedical Engineering and Physiology, Northwestern University, Chicago, IL 60611 USA and also with the Department of Sensory Motor Performance Program, Rehabilitation Institute of Chicago, Chicago, IL 60611 USA.
Fang Lin, Departments of Physical Therapy and Human Movement Science, and Physical Medicine and Rehabilitation, Northwestern University, Chicago, IL 60611 USA and also with the Sensory Motor Performance Program, Rehabilitation Institute of Chicago, Chicago, IL 60611 USA.
References
- 1.Cuddigan J, Ayello EA, Sussman C. Pressure ulcers in America: Prevalence, incidence and implications for the future National Pressure Ulcer Advisory Panel. Washington, DC: 2001. [DOI] [PubMed] [Google Scholar]
- 2.Frantz RA. Measuring prevalence and incidence of pressure ulcers. Adv Wound Care. 1997;10:21–24. [PubMed] [Google Scholar]
- 3.Young T. Pressure sores: Incidence, risk assessment and prevention. Br J Nursing. 1997;6:319–322. doi: 10.12968/bjon.1997.6.6.319. [DOI] [PubMed] [Google Scholar]
- 4.Barbenel JC. Pressure management. Prosthet Orthot Int. 1991;15:225–231. doi: 10.3109/03093649109164292. [DOI] [PubMed] [Google Scholar]
- 5.Gawron CL. Risk factors for and prevalence of pressure ulcers among hospitalized patients. J Wound Ostomy Continence Nursing. 1994;21:232–40. doi: 10.1097/00152192-199411000-00009. [DOI] [PubMed] [Google Scholar]
- 6.Kanj LF, Wilking SVB, Phillips TJ. Continuing medical education. J Am, Acad Dermatol. 1998;38:517–538. doi: 10.1016/s0190-9622(98)70113-6. [DOI] [PubMed] [Google Scholar]
- 7.Sanada H, Kanagawa K, Inagaki M, Imae J, Nishimura M, Yoshio K, Hiramatsu T. A study on the prevention of pressure ulcers: The relationship between transcutaneous PO2 in the sacral region and predictive factors for pressure ulcer development. Wounds. 1995;7:17–23. [Google Scholar]
- 8.Chow W, Odell E. Deformations and stresses in soft body tissues of a sitting person. J Biomech Eng. 1978;100:79–87. [Google Scholar]
- 9.Dabnichki P, Crocombe A, Hughes S. Deformation and stress analysis of supported buttock contact. Proc Inst Mech Eng. 1994;208:9–17. [Google Scholar]
- 10.Oomens C, Campen D, Grootenboer H. A mixture approach to the mechanics of skin. J Biomech. 1987;20:877–885. doi: 10.1016/0021-9290(87)90147-3. [DOI] [PubMed] [Google Scholar]
- 11.Oomens C, Bressers O, Bosboom E, Bouten C, Blader D. Can loaded interface characteristics influence strain distributions in muscle adjacent to bony prominences? Comput Methods Biomech Biomed Eng. 2003;6:171–180. doi: 10.1080/1025584031000121034. [DOI] [PubMed] [Google Scholar]
- 12.Bouten CV, Oomens CW, BFP, BDL The etiology of pressure ulcers: Skin deep or muscle bound? Arch Phys Med Rehabil. 2003;84:616–9. doi: 10.1053/apmr.2003.50038. [DOI] [PubMed] [Google Scholar]
- 13.Linder-Ganz E, Gefen A. Mechanical compression-induced pressure sores in rat hindlimb: Muscle stiffness, histology, and computational models. J Appl Physiol. 2004;96:2034–49. doi: 10.1152/japplphysiol.00888.2003. [DOI] [PubMed] [Google Scholar]
- 14.Nola GT, Vistnes LM. Differential response of skin and muscle in the experimental production of pressure sores. Plastic Reconstructive Surg. 1980;66:728–733. doi: 10.1097/00006534-198011000-00008. [DOI] [PubMed] [Google Scholar]
- 15.Brosh T, Arcan M. Modeling the body/chair interaction—An integrative experimental-numerical approach. Clin Biomech (Bristol, Avon) 2000;15:217–9. doi: 10.1016/s0268-0033(99)00073-x. [DOI] [PubMed] [Google Scholar]
- 16.Buschke D, Ignasiak P, Bushmaker K, Woodworth J. Computer simulations of two-component wheelchair cushions. Univ Wisconsin-La Crrosse J Undergraduate Res. 2003;VI [Google Scholar]
- 17.Kuroda S, Akimoto M. Finite element analysis of undermining of pressure ulcer with a simple cylinder model. J Nippon Med School. 2005;72:174–178. doi: 10.1272/jnms.72.174. [DOI] [PubMed] [Google Scholar]
- 18.Todd BA, Thacker JG. Three-dimensional computer model of the human buttocks, in vivo. J Rehabil Res Develop. 1994;31:111–119. [PubMed] [Google Scholar]
- 19.Torres-Moreno R, Jones D, Solomonidis SE, Mackie H. Magnetic resonance imaging of residual soft tissues for computer-aided technology applications in prosthetics—A case study. J Prosthet Orthot. 1999;11:6–11. [Google Scholar]
- 20.Protz PR, Chung KC. Implementing magnetic resonanc imaging for the quantification of load-bearing buttocks tissues. presented at the 13th Annu. RESNA Conf; Washington, DC. 1990. [Google Scholar]
- 21.Bonet J, Wood RD. Nonlinear Continuum Mechanics for Finite Element Analysis. 1. New York: Cambridge Univ. Press; 1997. [Google Scholar]
- 22.Morrey BF, An KN. Biomechanics of the shoulder. In: Rockwood CA Jr, Matsen FA III, editors. The Shoulder. Vol. 1. Philadelphia, PA: Saunders; 1990. pp. 208–245. [Google Scholar]
- 23.Linder-Ganz E, Shabshin N, Itzchak Y, Gefen A. Assessment of mechanical conditions in sub-dermal tissues during sitting: A combined experimental-MRI and finite element approach. J Biomech. 2007;40:1443–1454. doi: 10.1016/j.jbiomech.2006.06.020. [DOI] [PubMed] [Google Scholar]
- 24.Siegler S, Wang D, Plasha E, Berman AT. Technique for in vivo measurement of the three-dimensional kinematics and laxity characteristics of the ankle joint complex. J Orthop Res. 1994;12:421–431. doi: 10.1002/jor.1100120315. [DOI] [PubMed] [Google Scholar]
- 25.Daniel RK, Priest DL, Wheatley DC. Etiologic factors in pressure sores: An experimental model. Arch Phys Med Rehabil. 1981;62:492–498. [PubMed] [Google Scholar]


