

Abstract
The effect of cross-linking layer-by-layer (LbL) films consisting of bioreducible poly(2-dimethylaminoethyl methacrylate) (rPDMAEMA) and DNA is examined with regards to rigidity, biodegradability, cell adhesion, and transfection activity using 1,5-diiodopentane (DIP) cross-linker. DIP chemically reacts with the tertiary amines of rPDMAEMA, altering the chemical composition of these LbL films. The result is a change in surface morphology, film swelling behavior and film rigidity, measured with AFM and ellipsometry. It is found that the apparent Young’s modulus is increased more than four times its original value upon cross-linking. Cross-linking mass is additionally confirmed with quartz crystal microbalance with dissipation (QCM-D). Comprehensive analyses of these experimental values were investigated to calculate the degree of cross-linking using the rubber elasticity theory and the Flory-Rehner theory. Additionally, the Flory-Huggins parameter, χ, was calculated. Good agreement in the two methods yields a cross-linking density of ~0.82 mmol/cm3. The Flory-Huggins parameter increased upon cross-linking from 1.07 to 1.2, indicating increased hydrophobicity of the network and formation of bulk water droplets within the films. In addition, the effects of cross-linking on film disassembly by 1,4-dithiothreitol (DTT) is found to be insignificant despite the alteration in film rigidity. Mouse fibroblast cells and smooth muscle cells are used to study the effect of cross-linking on cell adhesion and cell transfection activity. In vitro transfection activity up to seven days is quantified using secreted alkaline phosphatase (SEAP) DNA. Film cross-linking is found to enhance cell adhesion and prolong the duration of cellular transfection. These results contribute to the development of bioreducible polymer coatings for localized gene delivery.
Keywords: AFM force measurements, cell adhesion, cell transfection, cross-linking, gene delivery, layer-by-layer film
INTRODUCTION
Layer-by-layer (LbL) films containing bioreducible polycations and DNA are a promising non-viral gene delivery system, allowing both temporal and spatial control over the release of DNA. LbL multilayer films are ideal coatings for biomaterials due to their ease of assembly on a variety of substrates and substrate geometries through the alternation of adsorbed polycation and polyanion layers.1-4 Electrostatic interaction and charge overcompensation ensure a film thickness increase upon each layer deposition. The LbL method allows for high DNA loading capabilities and the ease of controlling the amount and distribution of DNA within the films simply by altering the number of adsorbed DNA layers.
DNA-containing LbL films require an appropriate trigger for DNA release in order to achieve spatial and temporal control. Current methods of DNA triggered release include chemical degradation,5,6 pH,7,8 hydrolysis,9,10 and the use of charge shifting polycations.11,12 An additional method of DNA release is the incorporation of polycations containing disulfide bonds, which are capable of releasing DNA under physiologically compatible conditions.5,13-15 This reaction takes place through thiol-disulfide exchange reactions resulting in the degradation of high-molecular-weight polycations into low-molecular-weight oligocations. Previously, it has been assumed that DNA is released from these bioreducible LbL films upon cell attachment through the reaction of redox-active thiols in proteins at the cellular plasma membrane surface.5,16-19 Bioreducible films exhibit lower cytotoxicity and increased transfection activity when compared to control LbL films containing non-reducible polycations.20,21 A recent study has demonstrated a promising DNA transfection activity in vitro and in vivo using a disulfide-containing hyperbranched poly(amido amine) and DNA as a LbL film coating on stainless steel mesh.13 It is therefore suggested that DNA delivery systems containing bioreducible polycations offer an advantage over systems with non-reducible or hydrolytically degradable polycations since DNA release can be localized at the cell surface upon cell attachment.
LbL film assembly enables high amounts of DNA to be adsorbed into films by increasing the number of layers adsorbed. However, potential problems arise with increased layers since thicker films tend to have higher roughness and heterogeneous topographical features, characteristics which may limit cell-surface interactions.22,23 In general, cell adhesion properties are not only regulated by cell adhesion proteins but also surface properties including hydration,24-26 surface charge,27 pH,28 roughness,17 and rigidity.26,29-37 Reports have shown that often films are too soft for proper cell attachment due to a high degree of swelling and low rigidity.29,37,38 However, increasing the film mechanical integrity has shown to affect cell adhesion and cell spreading.26,36,39,40 One way of altering the film rigidity can be simply achieved via a chemical cross-linking reaction.41,42 Additionally, cross-linking has been shown to increase film resistance to solvent swelling and enzymatic degradation, both of which could prolong the duration of transgene expression.31
In this study, a disulfide-containing polycation, reducible poly(2-dimethylaminoethyl methacrylate) (rPDMAEMA), is used to create bioreducible DNA-containing LbL films. We report the effect of cross-linking on the film structure as well as transfection activity. Previous experiments have shown that rPDMAEMA had comparable transfection activity to the non-reducible PDMAEMA but with severely decreased cytotoxicity.43 1,5-Diiodopentane (DIP) is used as cross-linking agent where the cross-linking occurs via the targeting of the tertiary amines in rPDMAEMA (Scheme 1). The film structure, mechanical properties, cell adhesion, and transfection are studied for both non-cross-linked and cross-linked films. Characteristic parameters for covalent networks, such as cross-linking density and Flory-Huggins-Parameter are calculated from experimental data and the theory of rubber elasticity and Flory-Rehner-theory. In vitro transfection activity is investigated using smooth muscle cells (SMC) and mouse fibroblast cells (NIH-3T3). The kinetics of film degradation in reducing environment is investigated for both non-cross-linked and cross-linked films.
Scheme 1.

The reaction of DIP with rPDMAEMA to produce cross-linked LbL films.
MATERIALS AND METHODS
Materials
SEAP high-expression plasmid (5,757 bp) was purchased from Aldevron (Fargo, ND) and used without purification. Water was deionized to 18 MΩ cm resistivity using a Nanopure System from Barnstead. Polished n-type silicon wafers (resistivity 50–75 Ω cm) were purchased from Wafer World. DIP was obtained from Sigma with 95 % purity. 1,4-Dithiothreitol (DTT) was purchased from Acros Organics. All other materials were purchased from Fisher Scientific. The chemicals were used as received unless otherwise stated.
Polymer Synthesis
The synthesis of rPDMAEMA has been reported previously43 and is described only briefly herein. Oligomers of 2-dimethylaminoethyl methacrylate (DMAEMA) containing terminal thiol groups (DT-PDMAEMA) were synthesized by RAFT polymerization using a di-functional chain transfer agent. rPDMAEMA was synthesized by oxidation of the terminal thiol groups, which results in the formation of disulfide bonds in the backbone. rPDMAEMA was prepared by the following method. A small amount of DMSO was added to a solution of DT-PDMAEMA in deionized water and the reaction mixture was stirred for 13 days. Then, water was removed and rPDMAEMA was isolated by precipitation from DMSO. Polymers were characterized by 1H-NMR and size exclusion chromatography. Weight-average of molar mass of the rPDMAEMA used in this study was 16.7 kDa with a polydispersity index of 2.5. Additionally, rPDMAEMA is found to have low cytotoxicity and sufficient transfection activity in vitro.43
Film Assembly and Disassembly
The polymer solution contained 1.57 g/L rPDMAEMA in 0.1 M sodium acetate buffer (pH 5.5). The DNA solution contained 0.25 g/L of SEAP DNA in 0.1 M sodium acetate buffer (pH 5.5). The silicon wafer was cleaned in piranha solution (volume ratio: 3:1 of concentrated sulfuric acid to 30 % aqueous hydrogen peroxide solution). A 1×1 cm2 wafer piece was immersed into the rPDMAEMA solution for 15 min and rinsed three times with deionized water for 2 min each. This initial layer was followed by a layer of SEAP DNA following the same adsorption and rinse steps as described above. The deposition was repeated until 15 rPDMAEMA-DNA bi-layers were deposited, denoted [rPDMAEMA/DNA]15. The film degradation experiments were conducted in 10–20 mM DTT and 0.2 M NaCl, a commonly used condition to simulate the physiologic reducing environment.
Film Cross-linking
The LbL film was placed in 1 M DIP solution in water with 5% hexane at 50–55 °C for 1 h. The sample was rinsed with deionized water and dried with filtered air.
Ellipsometry
A phase-modulated ellipsometer (Beaglehole Instruments, New Zealand) fixed at the incidence angle (≈ 70 °) was used to quantify film thickness change during the LbL assembly and disassembly. The in situ degradation experiment follows the same procedure as a previous investigation of reducible TAT polypeptide and DNA LbL films.5,44 The ellipticity at the Brewster angle, θB, , was measured, where rp and rs are the complex reflection amplitudes for p and s polarizations, respectively. The ellipticity was converted to film thickness using the Drude equation. For the in situ experiments, data points were automatically collected every 50 s for 24 h.
Quartz Crystal Microbalance with Dissipation (QCM-D)
QCM-D (D300, Q-Sense, Sweden) was used to monitor mass change during film assembly in real time. The quartz crystal was first cleaned using a piranha solution, rinsed with water, and placed in the QCM holder. The crystal was mounted on a fluid cell with one side exposed to the solution. Next, deionized water was flushed through the QCM chambers until a constant frequency was observed (f1). The polycation solution was introduced to the QCM cell. The measurement continued until the total adsorption was calculated. The sample was rinsed with water until once again the frequency reached a constant value (f2). The same procedure was followed to monitor the adsorption of subsequent layers. The Sauerbrey equation (Eq 1) was used to calculate the mass change, Δm, during the film assembly.45-47
| Eq (1) |
Δfn is the frequency change due to deposition of one layer, Δfn = (f2 – f1)n. C is the mass sensitivity constant, 17.7 ngcm−2Hz−1 at 5 MHz, and n is the frequency overtone number, n = 1, 3, etc.
Atomic Force Microscopy (AFM)
AFM was used to study the surface morphological change during film assembly and disassembly and the effect of cross-linking on the topography and rigidity of LbL films (Multimode IIIa AFM (Digital Instruments) with an E-scanner (maximum scan area = 14.2×14.2 μm2)). The AFM study of film disassembly was conducted in 20 mM DTT with 0.2 M NaCl. Film disassembly was sampled every 2 h by taking the sample out of the degradation solution, rinsing with deionized water, and drying. After imaging, the sample was placed back in the same solution. Tapping mode in air was conducted using silicon tips (TESP, VEECO). Only height images are shown unless otherwise specified. Height images have been plane-fit in the fast scan direction with no additional filtering operation. The surface roughness of the films was determined using the root-mean-square surface roughness where zi is the height value and N is the number of measurement points. All Rq values reported were obtained on images of the same scan size (5×5 μm2).
AFM force-versus-distance curves were measured in Liquid Contact Force Calibration Mode using silicon nitride tips (NP type, VEECO) with a nominal radius 20 nm, length of 120 μm, and width of 15 μm. The sample and an AFM tip immersed in deionized water were allowed to equilibrate at room temperature for at least 20 min before measurements. The tip approaching speed was approximately 400 nm/s. Force curves were fitted to the Hertz model, δ = AFb, where δ is the indentation on the LbL films, F is the load force and b is assumed 2/3 (taken as the inverse exponent of Eq 2). Specifically, the cantilever distance, z – z0, versus cantilever deflection, d – d0, data from AFM approaching force curves were fitted to the Hertz model using Eq 2 by assuming a spherical tip indenting a planar film.48
| Eq (2) |
Fsphere is the load force of a spherical tip. The cantilever spring constant, k, was determined to be 0.20 N/m by measuring the free resonance frequency in air.49,50 d – d0 is the cantilever deflection. z is the piezo Z position. z0 is the contact point, which was determined from the onset of the repulsive force in the force-versus-distance curve. v is the Poisson’s ratio of the polymer film, which was assumed to be 0.5. R is the tip radius, which was assumed to be 20 nm. The measured elastic modulus, E, neglects nonlinear elasticity and viscoelasticity of real polymers but is qualitatively related to the Young’s modulus.51 Since the Si3N4 AFM probe is much less compliant than the film substrate, its contribution is neglected. Since the purpose here is not to obtain absolute values, we compare E values of the same film before and after cross-linking using the same AFM tip.
X-ray Photoelectron Spectroscopy (XPS)
XPS data were collected using a Perkin Elmer Model 5500 spectrometer with a monochromatized Al K-α X-ray source (1486.6 eV) operating at 15 kV and 14 mA. The electron detector was a concentric hemispherical analyzer at a 45 ° take-off angle. The working pressure was less than 1.0×10⁻⁸ torr. The spectrometer was calibrated to the Au 4f7/2 peak at 83.8 eV and the Cu 2p3/2 peak at 932.4 eV. A survey scan was acquired before each multiplex scan. All multiplex scans used a pass energy of 23.5 eV with a scan step of 0.05 eV and a time/step of 60 ms. The number of sweeps per peak varied from 10 to 20.
Cell Attachment and Proliferation
Silicon wafers containing [rPDMAEMA/DNA]15 films before and after cross-linking were cut into 1×1 cm2 pieces and placed at the bottom of 12-well plates. NIH-3T3 cells were grown to 80 % confluence, trypsinized, washed with PBS, and resuspended in DMEM. Next, 40,000 cells were placed in the well plate with the silicon substrate and incubated in 5 % CO2 at 37 °C for 1 h. The silicon substrates with the cells attached were removed and placed into new wells containing fresh DMEM supplemented with 10% FBS. Cell culture medium was replaced every day by carefully washing the silicon substrate with PBS and transferring the sample into new well plates with 2 mL of fresh medium. Cell attachment and proliferation was imaged daily with an inverted optical microscope.
Transfection Activity in vitro
Cells were seeded on silicon substrates containing [rPDMAEMA/SEAP DNA]15 films, which were either non-cross-linked or cross-linked. To determine the transfection activity of LbL films, the alkaline phosphatase secreted from the cells was measured. 2 mL of the medium was taken every 24 h, replaced with fresh medium, and stored at −80 °C until further analysis. For the SEAP reporter gene expression, 10 μL of the sample was diluted with 40 μL of the dilution buffer and heated at 65 °C for 30 min to deactivate endogenous phosphates and then cooled on ice for another 30 min. 100 μL of the assay buffer was added and incubated for 5 min. 100 μL of the reaction buffer (including the CSPD® substrate) was added and incubated for another 20 min. A single tube Sirius® luminometer (Zylux Corporation) was used to measure the luminescence with the measurement taken for 10 s with 2 s delay time. The transfection results were determined by adding up the individual SEAP amounts obtained at the different time points. Significant differences between two groups were determined by Student’s t-test. A value of P < 0.05 was considered statistically significant. Triplicate samples were used in all transfection experiments.
RESULTS AND DISCUSSION
Film Assembly
The LbL film build-up was confirmed by in situ ellipsometry in a liquid cell containing a 0.2 M NaCl solution. These results on film growth are summarized in Figure 1, where the film thickness is given as a function of the number of layers, [rPDMAEMA/DNA]n/2. From the data, we derive that the increase in average film thickness is described best by two different regimes. For the first regime, which comprises the first to the tenth layer, the average layer thickness is 2 nm. For the second regime beyond the tenth layer the average thickness is 5 nm. These results are comparable to layer thicknesses reported for DNA containing films and proof of two different growth regimes where the first regime is dominated by surface interaction, and the second regime is influenced by the film.2
Figure 1.
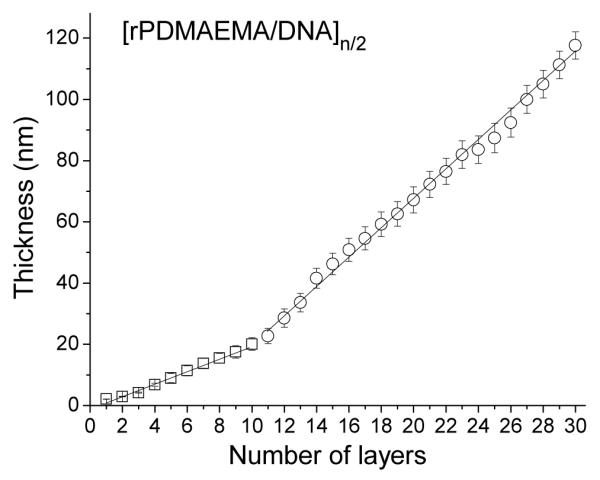
Film thickness from ellipsometry measurements as a function of number of layers [rPDMAEMA/DNA]n/2. The data were fitted by two linear functions for 1–10 layers (□) (slope = 2 nm per layer) and 11–30 layers (○) (slope 5 nm per layer (number of trials = 3).
The adsorption times and the adsorbed mass per surface area for each layer were measured by QCM. In order to accurately determine these values, the adsorbate solutions were allowed to completely equilibrate in the QCM chamber under continuous flow. The average adsorption time of rPDMAEMA was ~10 min while the one of DNA was ~20 min. The average mass per surface area was ~0.18 μg/cm2 and ~0.35 μg/cm2 for a rPDMAEMA layer and a DNA layer, respectively. The fact that DNA needed a longer absorption time can be explained by limited diffusion due to size and the rigid structure of DNA. The difference in mass per surface area in comparison to rPDMAEMA might simply be caused by the DNA being larger and more rigid, preventing unfolding of DNA at the interface.
The film morphology and roughness were analyzed by AFM. AFM images on film growth are summarized in Figure 2. The images show that the film morphology changed with growth. Initially a smooth, homogenous film was formed between 1 to 4 adsorbed layers. With adsorption of additional layers, a fibrous network appeared, most-likely caused by the mutual alignment and aggregation of wormlike DNA chains between 4 and 12 adsorbed layers. Starting from 8 bi-layers, we observed a transition from a fibrous network to a film morphology dominated by large aggregate features. In agreement with the change in morphology, we measured an increase in roughness with increasing film thickness. Interestingly, DNA layers show a larger roughness than rPDMAEMA layers (Supporting Information). These results are in agreement with previously published data.5
Figure 2.
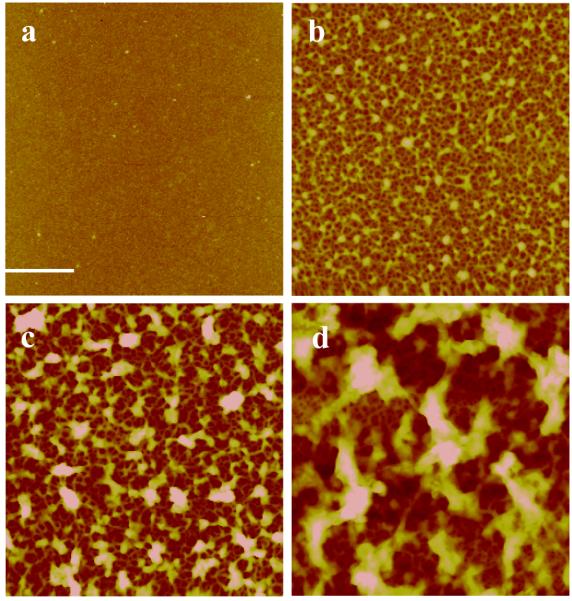
AFM images of [rPDMAEMA/DNA]n/2 LbL films with different number of layers, n. Scan size for all images is 5×5 μm2. (a) n = 2 (Z-range = 15 nm and Rq = 0.63 nm). (b) n = 10 (Z-range = 50 nm and Rq = 8.5 nm) (c) n = 20 (Z-range = 110 nm and Rq = 16 nm). (d) n = 30 (Z-range = 200 nm and Rq = 32 nm). Reference bar is 1 μm.
The Effect of Cross-linking on Film Structure and Rigidity
Cross-linking of the films was done by submerging the dried [rPDMAEMA/DNA]15 film into 1,5-diiodopentane (DIP) solution, where the DIP reacts with the tertiary amine in the rPDMAEMA to produce charged quaternary ammonia (Scheme 1). The cross-linking reaction between rPDMAEMA and DIP follows the aliphatic nucleophilic substitution mechanism.52 The α,ω-diiodoalkanes such as DIP are more reactive over dichloro- and dibromoalkanes.53 The slow reaction can be accelerated by heating to an elevated temperature. After the cross-linking reaction, elemental analysis of the film by XPS54 shows the chemical analysis of the film surfaces along with negligible traces of I− (Supporting Information). The presence of iodine in the cross-linked film suggests the existence of quaternized amines accompanied by iodide counterions. The newly formed chemical bonds at the PDMAEMA units slightly increase the overall polymer charge density. But in general, monitoring the cross-linking by XPS elemental analysis yielded no clear evidence on cross-linking because the changes in chemical composition are at the instrumental limit (Supporting Information).
The influence of the cross-linking on the overall film thickness was measured by ellipsometry in a liquid cell containing a 0.2 M NaCl solution. The thickness decreased from 118 to 96 nm after cross-linking in a liquid environment consisting of 0.2 M NaCl. In a dry state the thickness was found to be 85 and 75 nm, respectively. Both film loss during solvent immersion and film compaction upon cross-linking could contribute to the film thickness reduction. In order to determine the exact mechanism behind the film loss, a control sample was submerged into the solvent mixture without DIP for 1 h at 50–55 °C. In this case, the film thickness decreased by 8–10 nm in the dry state and by 10–15 nm in solution. It seems that solvent contact is the main contributor to film loss. The cross-linking reaction was quantified in more detail using in situ QCM. Switching the solvent from water to DIP-hexane/water solution resulted in a weight gain of ~0.78 μg/cm2 (Figure 3). After rinsing with water a net weight gain of 0.43 μg/cm2 was measured. In comparison, immersion in pure hexane for 1 h resulted in a net gain of only 0.11 μg/cm2. Therefore, a significant amount of DIP, 0.32 μg/cm2, was incorporated into the LbL film as a result of the cross-linking reaction. Form these data, we calculated a theoretical cross-linking density (vth) under the assumption that a) the cross-linker is point-like and forms only one cross-linking point and b) the reaction yields a 100 % conversion. The material density was determined from the mass per area (QCM) and the film thickness (ellipsometry). The theoretical cross-linking density (vth) was 0.475 ± 0.105 mmol/cm3 (equations and summary of results are shown in the Supporting Information). Additionally, AFM confirmed that the film integrity is kept after immersion into hexane with or without DIP (Figure 4). However, the surface features appear to have shrunk after cross-linking as seen in Figure 4b and the Rq value decreased from 30 nm to 18 nm (Figure 4a,b). More importantly, the film reaction with DIP resulted in an increase in the apparent elastic modulus, E. Figure 5 shows AFM force indentation curves before and after cross-linking and the corresponding fitting by the Hertz model. E was found to be 1.8 ± 0.8 MPa for [rPDMAEMA/DNA]15 film before cross-linking and 7.9 ± 1.1 MPa after cross-linking. It is known that the elastic modulus of a film measured by AFM is strongly influenced by the substrate if the film is very thin.55,56 Since our goal is not to obtain the absolute values, we can make a valid comparison of the E values before and after cross-linking by using the same AFM probe (same R value), same film (similar film thickness), and similar maximum indentation This means that an increased rigidity in only the uppermost layer would result in a slight influence on the Young’s modulus. Therefore, it is concluded that a change in Young’s modulus by a factor of ~ 4.4 indicates cross-linking to occur most-likely in the majority of the film and not only in proximity to the film surface. The use of N-alkylation cross-linkers has been previously reported.52-53, 57 These studies have used FTIR spectroscopy, UV-visible absorption and X-ray photoelectron spectroscopy (XPS) to confirm cross-linking of films. In this investigation, we were able to further confirm and quantify the extent of cross-linking in the LbL films through the use of the theory of rubber elasticity and the Flory-Rehner theory.58,59 According to the theory of rubber elasticity, the cross-linking density (vE) is directly related to the elasticity modulus (Young’s modulus) E by Eq (3).
| Eq (3) |
Figure 3.
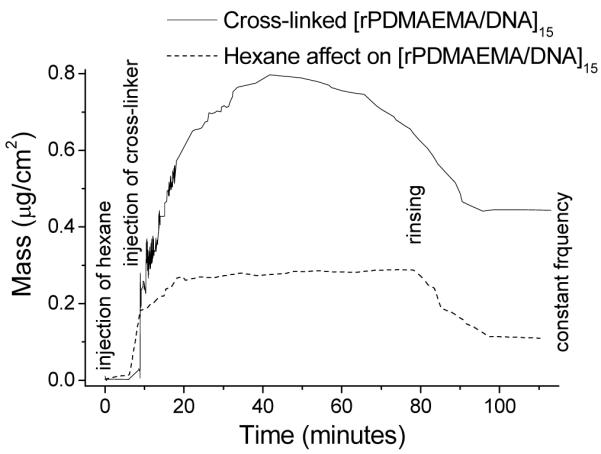
QCM curves of subjecting [rPDMAEMA/DNA]15 to (a) 1 M DIP hexane solution at 50 °C for 1 h and (b) hexane solution at 50 °C for 1 h. A final continuous rinse in deionized water was applied for 30 min in both cases.
Figure 4.
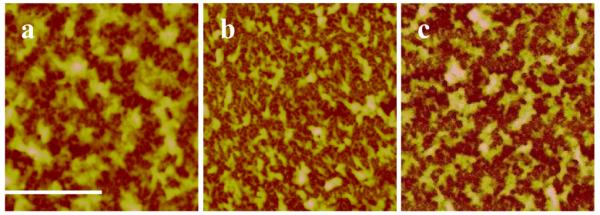
AFM images (scan size = 10×10 μm2) of [rPDMAEMA/DNA]15 LbL film (a) before cross-linking reaction (Z-range = 220 nm and Rq = 30 nm), (b) after cross-linking reaction (Z-range = 180 nm and Rq = 18 nm, and (c) before cross-linking but immersed in hexane at 50–55 °C for 1 h (Z-range = 220 nm and Rq = 33 nm). Reference bar is 2 μm.
Figure 5.

Indentation vs. load force curved obtained by AFM and the fit to the Hertz model. (a) Non-cross-linked [rPDMAEMA/DNA]15 film. (b) Cross-linked [rPDMAEMA/DNA]15 film.
To calculate the DIP cross-linking density of LbL films, we have to determine first the cross-linking density resulting from the electrostatic interaction of oppositely charged polyelectrolyte in non-cross-linked films and compare it to that of cross-linked films. The chemical cross-linking by DIP is the difference between these values. We calculated vE to be 0.242 ± 0.108 mmol/cm3, 1.063 ± 0.148 mmol/cm3 and 0.821 ± 0.256 mmol/cm3 for non cross-linked films, cross-linked films and the DIP cross-linking, respectively. Noticeably, the theory of rubber elasticity supports our assumption that cross-linking by DIP occurred, additionally shown by the increase in elastaticity modulus. However, the values differ by a factor of ~1.7 in comparison to the vth calculated from QCM. This difference arises in the calculation of vth assuming that DIP acts as a point-like cross-linker. Under the assumption that DIP forms two cross-linking points, vth needs to be multiplied by two to give 2vth = 0.95 ± 0.21 mmol/cm3 also under the assumption of 100 % conversion. Interestingly, we achieve good agreement between the calculated values although the errors are quite large. Due to the large errors, the conversion rate cannot reasonably be estimated.
The Flory-Rehner theory on thermodynamics of networks, allows us to determine either the cross-linking density, v, or the Flory-Huggins solvent polymer interaction parameter, χ, from swelling experiments for ideal networks Eq (4).
| Eq (4) |
Here V0 is the molar volume of the solvent, and Vr is the volume fraction of polymer in the swollen sample. The volume fraction of polymer in swollen state is commonly determined by either gravimetric or volumetric measurements according to Eq (5), with ρ being the density and V being the volume of solvent or the dry polymer.60
| Eq (5) |
We calculated the Flory-Huggins parameter, χ, with the cross-linking density from the Young’s modulus (vE). Vr was determined from ellipsometry data from water swollen and non-swollen films, assuming that films can only swell in one direction (thickness), allowing the use of the measured film thicknesses instead of the volume. χ was found to be 1.07 ± 0.06 and 1.21 ± 0.10 for non-cross-linked and cross-linked films, respectively. These values are in agreement with previously published data61 and indicate that the solvent-polymer interaction decreases upon cross-linking, meaning an increase of hydrophobicity. Additionally, the χ-values are approximately 1, which in general is a sign of a very poor interaction between solvent and polymer. This result is surprising, because the film forming polyelectrolytes are well soluble in water, and one would expect χ-values below or close to 0. It has been shown, that the charge compensation in the films lead to two effects; first, hydration of the ionic centers in the film and second the formation of bulk liquid water droplets within the film.61
Although we were not able to provide data whether the cross-linking is restricted within individual layers, ellipsometry, QCM, and AFM data clearly show that a significant amount of DIP is incorporated into the LbL film and it results in a denser and more rigid film. The increase in cross-linking density upon DIP adsorption shows that in fact a network is formed. The network formation leads to an increase in film hydrophobicity. From the calculated Flory-Huggins solvent interaction parameter, χ, we can conclude that water is predominantly absorbed into liquid droplets within the film and is not primarily interacting with the water soluble polyelectrolytes. Noticeably, we find an excellent agreement between cross-linking density calculated from QCM and AFM by the theory of rubber elasticity. From transfection rates in cell studies shown below, it is reasonable to assume that alkylation/cross-linking occurred primarily on the rPDMAEMA units and not on the DNA.
The Effect of Cross-linking on Reductive Disassembly
Film disassembly of non-cross-linked and cross-linked films in 0.02 M DTT and 0.2 M NaCl was monitored by in situ ellipsometry over 24 h. The film thickness versus degradation time is plotted in Figure 6 for both samples. Both cross-linked and non-cross-linked films showed initially a rapid decrease in film thickness. Within the first 5 hours the thickness of the non-cross-linked and cross-linked films decreased by 70 and 50 nm, respectively. Afterwards, degradation occurs at a much slower rate. After 10 h, the degradation curves of non-cross-linked and cross-linked films merged, resulting in a film with a thickness of 26–28 nm. Since the thiol-disulfide exchange reaction occurs rapidly,62,63 we attribute the initial fast degradation of the film to the kinetics of the thiol-disulfide exchange reaction. The following slow degradation is most likely caused by the slow kinetics of oligocation and DNA rearrangement on the surface and desorption. The steps (marked by the arrows in Figure 6) occurred consistently but stochastically. Similar features have been observed for other types of reducible DNA-containing LbL films.5 We assume this effect to be caused by the occasional release of large molecular aggregates or fragments. In light of the efficiency of the thiol-disulfide exchange reaction, we reason that the remaining film materials found after 15 h are predominantly oligocations and DNA complexes. These fragments are still large enough to bind stably to the surface but yet small enough to prevent formation of a complete, homogeneous film (see also AFM data below).
Figure 6.
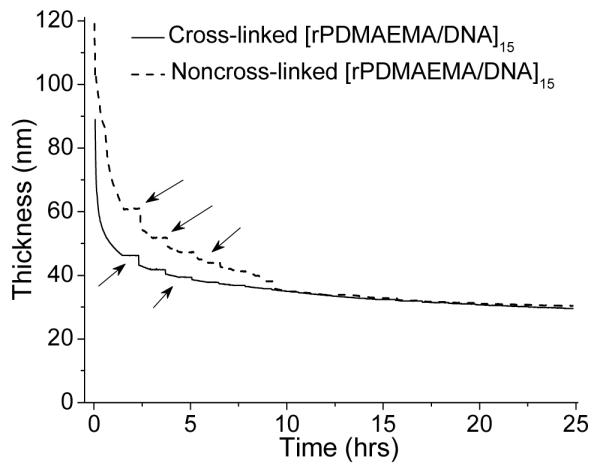
Film thickness as a function of immersion time in 20 mM DTT and 0.2 M NaCl for both non-cross-linked and cross-linked [rPDMAEMA/DNA]15 films.
Figure 7 shows time-lapsed AFM images of [rPDMAEMA/DNA]15 films exposed to DTT solution for up to 12 h. Images of non-cross-linked and cross-linked film are split into columns in Figure 7a-d and Figure 7e–h, respectively. Figure 8 provides more details on the roughness measured by AFM as a function of degradation time for both non-cross-linked and cross-linked samples. The initial fast decrease is visualized together with the slower decrease which follows. Interestingly, the film morphology between the non-cross-linked and cross-linked films remained nearly unchanged during the degradation process. In both cases we observed initially a uniform film with full coverage, and with degradation the film turned into a more heterogeneous distribution of material on the surface. Additionally, the surface features appear to be more compact in the cross-linked film throughout the degradation process compared to the non-cross-linked film.
Figure 7.

The [rPDMAEMA/DNA]15 film morphological change during reductive degradation. The AFM image size for all images is 5×5 μm2. (a–d) Film before cross-linking and after immersion in DTT solution for 1 h (Z-range = 190 nm and Rq = 21.8 nm), 2 h (Z-range = 120 nm and Rq = 16.2 nm), 4 h (Z-range = 80 nm and Rq = 8.8 nm), and 8 h (Z-range = 40 nm and Rq = 4.8 nm), respectively. (e–h) Film after cross-linking and after immersion in DTT solution for 1 h (Z-range = 190 nm and Rq = 17.6 nm), 2 h (Z-range = 100 nm and Rq = 15.9 nm), 4 h (Z-range = 60 nm and Rq = 10.8 nm) and 8 h (Z-range = 40 nm and Rq = 4.2 nm), respectively. Reference bar is 1 μm.
Figure 8.
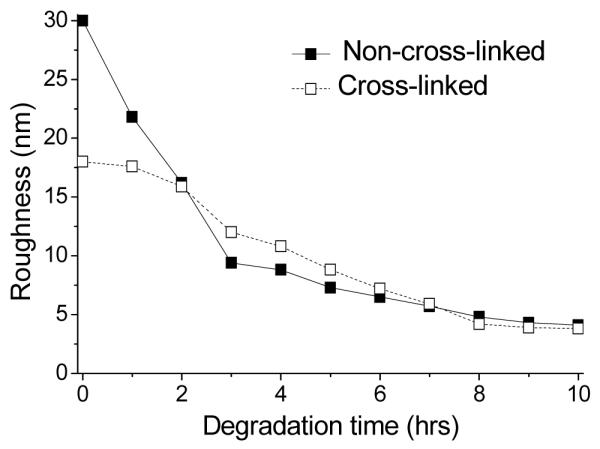
Surface roughness as a function of degradation time for the [rPDMAEMA/DNA]15 film.
From the ellipsometry and AFM data, we conclude that degradation of the film occurs very fast and cross-linking does not seem to influence degradation. A more detailed picture of degradation cannot be derived since AFM and ellipsometry measurements require different treatments of the sample (ellipsometry: liquid cell, continuous measurement; AFM: dry state, interrupted reaction, rinsing of sample, drying by air flow). Therefore the results are not directly comparable. Furthermore, reaction kinetics are too quick to be investigated in detail with these techniques. A more detailed study should be subject to a forthcoming investigation.
Cell Growth and Transfection Activity in vitro
Figure 9 shows the growth of NIH-3T3 cells on cross-linked films over 7 days. In comparison, additional 24 hours were required for the NIH-3T3 cells to attach and begin spreading on the same film. A similar trend was also observed for SMC. SMC attached readily to cross-linked [rPDMAEMA/DNA]15 films but not to non-cross-linked films. It has been hypothesized that alterations in cell shape can alter gene expression, therefore affecting cell adhesion and or spreading.64 With this note, it is important to first examine cell adhesion and cell shape on LbL films, which can help verify that the cells are healthy and normal.65 The cells appeared to grow normally through their growth period, reaching confluence on day 7. Cells attached to non-cross-linked films died after 4 days. Fewer cells initially attached to the non-cross-linked films and out of those that attached, only about 20 % spread after 2 days of growth. Cell spreading was much more abundant on cross-linked films, showing the preference of the cells for the cross-linked films over the non-cross-linked ones. It is generally known that cells exposed to polymer films display down-regulation of cell binding proteins such as fibronectin mostly due to the reduction in cell adhesion.66 This leads us to believe that the cell adhesion properties are improved by cross-linking and the alteration of the mechanical properties since it is observed that cells prefer cross-linked films for adhesion and spreading.
Figure 9.
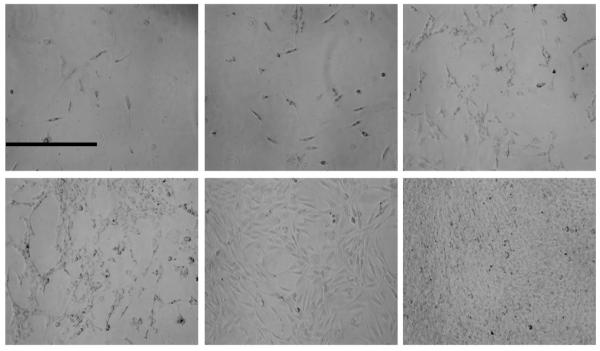
Optical microscopy of NIH-3T3 cells on cross-linked [rPDMAEMA/DNA]15 for 6 days (day 1-3, top panel and day 4-6, bottom panel). The cells grow for 6 days before reaching 100 % confluence. Reference bar is 0.5 mm.
NIH-3T3 transfection studies showed higher transfection activity for cross-linked films compared to the non-cross-linked films (Figure 10). After 24 h of cell growth, both cross-linked and non-cross-linked films showed low levels of transfection activity. After another 24 h, the non-cross-linked films continued to exhibit low transfection levels compared to the cross-linked films which increased steadily within the first 4 days. The transfection activity gradually began to level off after day 4 until day 7 when the experiment was terminated and the cells were 100 % confluent on the surface. These data suggest that cells adhere better to more rigid films and the better adhesion leads to prolonged cell transfection.
Figure 10.
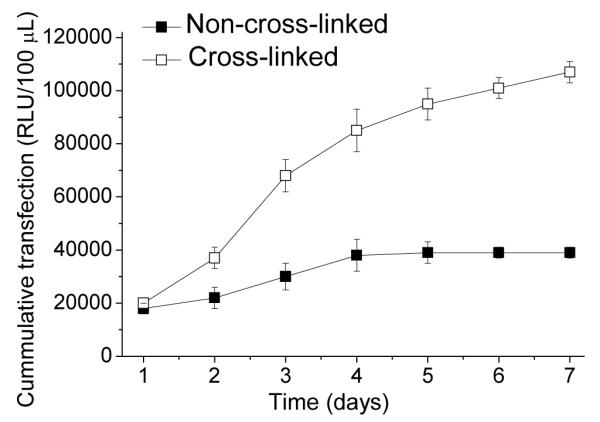
Transfection studies of cross-linked and non-cross-linked rPDMAEMA/SEAP DNA films with NIH-3T3 cells over two weeks. Samples were taken every 2 days and analyzed using luminescence. It was found that cross-linked films had an averaged total of around 400,000 RLU’s over one week and a total average of about 110,000 RLU’s for the non-cross-linked films.
Conclusions
Cross-linking of bioreducible DNA-containing LbL films was shown to enhance film rigidity, cell adhesion, and transfection. Furthermore, the idea of altering film rigidity for enhancement of cell adhesion is significant in the field of biomaterials and biological coatings. Although the conversion rate for the cross-linking of the films by DIP could not be determined, the theory of rubber elasticity proves that the films are highly cross-linked (cross-linking density: 0.821 mmol/cm3). Additionally, upon cross-linking, the elasticity modulus increased by a factor of 4.4 showing a change in mechanical properties of the films. Initial cell adhesion to a film can be improved by this chemo-mechanical alteration of the films. From swelling experiments, we found that the films in the swollen state possess an internal structure that is comprised of bulk liquid water droplets and de-mixed polymer networks. Correlation between film rigidity and cell adhesion and transfection provides a means to enhance transfection activity of biological coatings.
Supplementary Material
ACKNOWLEDGMENT
The authors acknowledge partial support from the National Institutes of Health (CA 109711) and the National Science Foundation (CBET-0553533 and CBET-0755654) and the Max Planck Society. J.B. acknowledges the support of the National Science Foundation International Research and Education in Engineering supplement and the Fulbright Program to conduct the QCM experiments at the Max Planck Institute of Colloids and Interfaces. We thank the laboratories of Dr. Gregory Auner for the use of XPS and Dr. Ashis Mukhopadhyay for the use of ellipsometry.
Footnotes
Supporting Information Available: QCM measurements of the adsorption time and change in area mass adsorption for each adsorbed layer are presented. Roughness data obtained from AFM measurements during film assembly is also incorporated. Additional data on the cross-linked films includes XPS % spectra and detailed calculations of the Flory-Rehner theory, rubber elasticity theory and the Flory-Huggins parameter, χ. This material is available free of charge via the Internet at http://pubs.acs.org.
References
- (1).Decher G, Hong JD, Schmitt J. Thin Solid Films. 1992;210/211:831–835. [Google Scholar]
- (2).Lvov Y, Decher G, Sukhorukov G. Macromolecules. 1993;26:5396–5399. [Google Scholar]
- (3).Decher G. Science. 1997;277:1232–1237. [Google Scholar]
- (4).Schonhoff M. J. Phys.: Condens. Matter. 2003;15:R1781–R1808. [Google Scholar]
- (5).Blacklock J, Handa H, Manickam D. Soundara, Mao G, Mukhopadhyay A, Oupicky D. Biomaterials. 2007;28:117–124. doi: 10.1016/j.biomaterials.2006.08.035. [DOI] [PubMed] [Google Scholar]
- (6).Jewell CM, Zhang J, Fredin NJ, Wolff MR, Hacker TA, Lynn DM. Biomacromolecules. 2006;7:2483–2491. doi: 10.1021/bm0604808. [DOI] [PMC free article] [PubMed] [Google Scholar]
- (7).Wang C, Ge Q, Ting D, Nguyen D, Shen HR, Chen J, Eisen HN, Heller J, Langer R, Putnam D. Nat. Mater. 2004;3:190–196. doi: 10.1038/nmat1075. [DOI] [PubMed] [Google Scholar]
- (8).Akinc A, Anderson DG, Lynn DM, Langer R. Bioconjug. Chem. 2003;14:979–988. doi: 10.1021/bc034067y. [DOI] [PubMed] [Google Scholar]
- (9).Hedley ML, Curley J, Urban R. Nat. Med. 1998;4:365–368. doi: 10.1038/nm0398-365. [DOI] [PubMed] [Google Scholar]
- (10).Jones DH, Corris S, McDonald S, Clegg JC, Farrar GH. Vaccine. 1997;15:814–817. doi: 10.1016/s0264-410x(96)00266-6. [DOI] [PubMed] [Google Scholar]
- (11).Zhang J, Montanez SI, Jewell CM, Lynn DM. Langmuir. 2007;23:11139–11146. doi: 10.1021/la702021s. [DOI] [PubMed] [Google Scholar]
- (12).De Geest BG, Dejugnat C, Verhoeven E, Sukhorukov GB, Jonas AM, Plain J, Demeester J, De Smedt SC. J. Controlled Release. 2006;116:159–169. doi: 10.1016/j.jconrel.2006.06.016. [DOI] [PubMed] [Google Scholar]
- (13).Blacklock J, You YZ, Zhou QH, Mao G, Oupicky D. Biomaterials. 2009;30:939–950. doi: 10.1016/j.biomaterials.2008.10.012. [DOI] [PMC free article] [PubMed] [Google Scholar]
- (14).Chen J, Huang S-W, Lin W-H, Zhuo R-X. Small. 2007;3:636–643. doi: 10.1002/smll.200600301. [DOI] [PubMed] [Google Scholar]
- (15).Zelikin AN, Quinn JF, Caruso F. Biomacromolecules. 2006;7:27–30. doi: 10.1021/bm050832v. [DOI] [PubMed] [Google Scholar]
- (16).McKenzie DL, Kwok KY, Rice KG. J. Biol. Chem. 2000;275:9970–9977. doi: 10.1074/jbc.275.14.9970. [DOI] [PubMed] [Google Scholar]
- (17).Wittmer CR, Phelps JA, Saltzman WM, Van Tassel PR. Fibronectin terminated multilayer films: Protein adsorption and cell attachment studies. Biomaterials. 2007;28(5):851–860. doi: 10.1016/j.biomaterials.2006.09.037. [DOI] [PMC free article] [PubMed] [Google Scholar]
- (18).Miyata K, Kakizawa Y, Nishiyama N, Harada A, Yamasaki Y, Koyama H, Kataoka K. J. Am. Chem. Soc. 2004;126:2355–2361. doi: 10.1021/ja0379666. [DOI] [PubMed] [Google Scholar]
- (19).Manickam DS, Oupicky D. Bioconjugate Chem. 2006;17:1395–1403. doi: 10.1021/bc060104k. [DOI] [PubMed] [Google Scholar]
- (20).Lin C, Zhong Z, Lok MC, Jiang X, Hennink WE, Feijen J, Engbersen JF. J. Controlled Release. 2006;116:130–137. doi: 10.1016/j.jconrel.2006.09.009. [DOI] [PubMed] [Google Scholar]
- (21).Jeong J. Hoon, Christensen LV, Yockman JW, Zhong Z, Engbersen JF, Kim W. Jong, Feijen J, Kim S. Wan. Biomaterials. 2007;28:1912–1917. doi: 10.1016/j.biomaterials.2006.12.019. [DOI] [PubMed] [Google Scholar]
- (22).Picart C, Mutterer J, Richert L, Luo Y, Prestwich GD, Schaaf P, Voegel JC, Lavalle P. Proc. Natl. Acad. Sci. U. S. A. 2002;99:12531–12535. doi: 10.1073/pnas.202486099. [DOI] [PMC free article] [PubMed] [Google Scholar]
- (23).Juliano RL, Haskill S. J. Cell Biol. 1993;120:577–585. doi: 10.1083/jcb.120.3.577. [DOI] [PMC free article] [PubMed] [Google Scholar]
- (24).Vankooten TG, Schakenraad JM, Vandermei HC, Busscher H. J. Biomaterials. 1992;13:897–904. doi: 10.1016/0142-9612(92)90112-2. [DOI] [PubMed] [Google Scholar]
- (25).Groth T, Altankov G. Biomaterials. 1996;17:1227–1234. doi: 10.1016/0142-9612(96)84943-x. [DOI] [PubMed] [Google Scholar]
- (26).Wittmer CR, Phelps JA, Saltzman WM, Van Tassel PR. Biomaterials. 2007;28:851–860. doi: 10.1016/j.biomaterials.2006.09.037. [DOI] [PMC free article] [PubMed] [Google Scholar]
- (27).Chanana M, Gliozzi A, Diaspro A, Chodnevskaja I, Huewel S, Moskalenko V, Ulrichs K, Galla HJ, Krol S. Nano Lett. 2005;5:2605–2612. doi: 10.1021/nl0521219. [DOI] [PubMed] [Google Scholar]
- (28).Kirchhof K, Groth T. Clin. Hemorheol. Microcirc. 2008;39:247–251. [PubMed] [Google Scholar]
- (29).Francius G, Hemmerle J, Ohayon J, Schaaf P, Voegel JC, Picart C, Senger B. Microsc. Res. Tech. 2006;69:84–92. doi: 10.1002/jemt.20275. [DOI] [PubMed] [Google Scholar]
- (30).Richert L, Engler AJ, Discher DE, Picart C. Biomacromolecules. 2004;5:1908–1916. doi: 10.1021/bm0498023. [DOI] [PubMed] [Google Scholar]
- (31).Schneider A, Richert L, Francius G, Voegel JC, Picart C. Biomed. Mater. 2007;2:S45–51. doi: 10.1088/1748-6041/2/1/S07. [DOI] [PubMed] [Google Scholar]
- (32).Pelham RJ, Wang YL. Proc. Natl. Acad. Sci. U. S. A. 1997;94:13661–13665. doi: 10.1073/pnas.94.25.13661. [DOI] [PMC free article] [PubMed] [Google Scholar]
- (33).Engler AJ, Griffin MA, Sen S, Bonnetnann CG, Sweeney HL, Discher DE. J. Cell Biol. 2004;166:877–887. doi: 10.1083/jcb.200405004. [DOI] [PMC free article] [PubMed] [Google Scholar]
- (34).Engler A, Bacakova L, Newman C, Hategan A, Griffin M, Discher D. Biophys. J. 2004;86:617–628. doi: 10.1016/S0006-3495(04)74140-5. [DOI] [PMC free article] [PubMed] [Google Scholar]
- (35).Lo CM, Wang HB, Dembo M, Wang YL. Biophys. J. 2000;79:144–152. doi: 10.1016/S0006-3495(00)76279-5. [DOI] [PMC free article] [PubMed] [Google Scholar]
- (36).Dikovsky D, Bianco-Peled H, Seliktar D. Biophys. J. 2008;94:2914–2925. doi: 10.1529/biophysj.107.105841. [DOI] [PMC free article] [PubMed] [Google Scholar]
- (37).Richert L, Boulmedais F, Lavalle P, Mutterer J, Ferreux E, Decher G, Schaaf P, Voegel JC, Picart C. Biomacromolecules. 2004;5:284–294. doi: 10.1021/bm0342281. [DOI] [PubMed] [Google Scholar]
- (38).Mendelsohn JD, Yang SY, Hiller J, Hochbaum AI, Rubner MF. Biomacromolecules. 2003;4:96–106. doi: 10.1021/bm0256101. [DOI] [PubMed] [Google Scholar]
- (39).Li M, Cui T, Mills DK, Lvov YM, McShane MJ. J. Nanosci. Nanotechnol. 2005;5:1809–1815. doi: 10.1166/jnn.2005.436. [DOI] [PubMed] [Google Scholar]
- (40).Ma L, Zhou J, Gao C, Shen J. J. Biomed. Mater. Res., Part B. 2007;83:285–292. doi: 10.1002/jbm.b.30794. [DOI] [PubMed] [Google Scholar]
- (41).Ghosh K, Ren XD, Shu XZ, Prestwich GD, Clark RA. Tissue Eng. 2006;12:601–613. doi: 10.1089/ten.2006.12.601. [DOI] [PubMed] [Google Scholar]
- (42).Bornstein P, Sage EH. Curr. Opin. Cell Biol. 2002;14:608–616. doi: 10.1016/s0955-0674(02)00361-7. [DOI] [PubMed] [Google Scholar]
- (43).You YZ, Manickam DS, Zhou QH, Oupicky D. J. Controlled Release. 2007;122:217–225. doi: 10.1016/j.jconrel.2007.04.020. [DOI] [PMC free article] [PubMed] [Google Scholar]
- (44).Blacklock J, You Y-Z, Zhou Q-H, Mao G, Oupický D. Biomaterials. 2009;30:939–950. doi: 10.1016/j.biomaterials.2008.10.012. [DOI] [PMC free article] [PubMed] [Google Scholar]
- (45).Rodahl M, Kasemo B. Sens. Actuators, B. 1996;B37:111–116. [Google Scholar]
- (46).Rodahl M, Kasemo B. Rev. Sci. Instrum. 1996;67:3238–3241. [Google Scholar]
- (47).Hook F, Rodahl M, Brzezinski P, Kasemo B. J. Colloid Interface Sci. 1998;208:63–67. doi: 10.1006/jcis.1998.5774. [DOI] [PubMed] [Google Scholar]
- (48).Laney DE, Garcia RA, Parsons SM, Hansma HG. Biophys. J. 1997;72:806–813. doi: 10.1016/s0006-3495(97)78714-9. [DOI] [PMC free article] [PubMed] [Google Scholar]
- (49).Liang X, Mao G, Ng KYS. Colloids Surf., B. 2003;34:41–51. doi: 10.1016/j.colsurfb.2003.10.017. [DOI] [PubMed] [Google Scholar]
- (50).Cleveland JP, Manne S, Bocek D, Hansma PK. Rev. Sci. Instrum. 1993;64:403–405. [Google Scholar]
- (51).Thompson MT, Berg MC, Tobias IS, Rubner MF, Van Vliet KJ. Biomaterials. 2005;26:6836–6845. doi: 10.1016/j.biomaterials.2005.05.003. [DOI] [PubMed] [Google Scholar]
- (52).Zhao B, Neoh KG, Kang ET, Tan KL. Chem. Mater. 2000;12:1800–1806. [Google Scholar]
- (53).Germain J, Frechet JMJ, Svec F. J. Mater. Chem. 2007;17:4989–4997. [Google Scholar]
- (54).Zuwei M, Zhengwei M, Changyou G. Colloids Surf., B. 2007:137–157. [Google Scholar]
- (55).Akhremitchev BB, Walker GC. Langmuir. 1999;15:5630–5634. [Google Scholar]
- (56).Kim MT. Thin Solid Films. 1995;283:12–16. [Google Scholar]
- (57).Mohan H, Asmus KD. J. Am. Chem. Soc. 1987;109:4745–4746. [Google Scholar]
- (58).Flory PJ. Principles of polymer chemistry. Cornell University Press; Ithica, N. Y.: 1953. [Google Scholar]
- (59).Flory PJ, Rehner J. J. Chem. Phys. 1943;11:512–520. [Google Scholar]
- (60).Rout S-P, Butler GB. Polym. Bull. 1980;2:513–520. [Google Scholar]
- (61).Kohler R, Donch I, Ott P, Laschewsky A, Fery A, Krastev R. Langmuir. 2009;25:11576–11585. doi: 10.1021/la901508w. [DOI] [PubMed] [Google Scholar]
- (62).Iyer KS, Klee WA. J. Biol. Chem. 1973;248:707–710. [PubMed] [Google Scholar]
- (63).Gilbert HF. Adv. Enzymology Related Areas Mole. Biology. 1990;63:69–172. doi: 10.1002/9780470123096.ch2. [DOI] [PubMed] [Google Scholar]
- (64).Chen CS, Mrksich M, Huang S, Whitesides GM, Ingber DE. Science. 1997;276:1425–1428. doi: 10.1126/science.276.5317.1425. [DOI] [PubMed] [Google Scholar]
- (65).Maniotis AJ, Chen CS, Ingber DE. Proc. Natl. Acad. Sci. U. S. A. 1997;94:849–854. doi: 10.1073/pnas.94.3.849. [DOI] [PMC free article] [PubMed] [Google Scholar]
- (66).Allen MJ, Bradbury EM, Balhorn R. Nucl. Acids Res. 1997;25:2221–2226. doi: 10.1093/nar/25.11.2221. [DOI] [PMC free article] [PubMed] [Google Scholar]
Associated Data
This section collects any data citations, data availability statements, or supplementary materials included in this article.