Abstract
The success of adult ventricular assist devices (VADs), coupled with the high transplant waiting list mortality of infants (40 %) has prompted Penn State to develop a pediatric version of the clinically successful adult device. While the primary use of this device will be bridge-to-transplant, there has been sufficient clinical data to demonstrate the efficacy of VADs in a bridge-to-recovery setting. However, removing the patient from the device, a process known as weaning, demands operation of the device at a lower beat rate and concomitant increased risk for thromboembolism. Previous studies have shown that the interrelated flow characteristics necessary for the prevention of thrombosis in a pulsatile VAD are a strong inlet jet, a late diastolic recirculating flow, and a wall shear rate greater than 500 s−1. In an effort to develop a strong inlet jet and rotational flow pattern at a lower beat and flow rate; we have compressed diastole by altering the end-diastolic delay time (EDD). Particle image velocimetry was used to compare the flow fields and wall shear rates in the chamber of the 12 cc Penn State pulsatile pediatric VAD operated at 50 beats per minute using EDDs of 10, 50, and 100 ms. While we expected the 100 ms end-diastolic delay to have the best wall shear profiles, we found that the 50 ms EDD condition was superior to both the 10 and 100 EDD conditions, due to a longer sustained inlet jet.
Key Terms: pediatric ventricular assist device, thrombosis, fluid dynamics, pulsatile, wall shear, particle image velocimetry, weaning
Introduction
Congenital heart disease is the most common and leading cause of birth-defect related deaths, with 36,000 children afflicted annually in the United States (1). While a few of these patients have irreversibly damaged or deformed hearts that require transplantation, a simple operation can lead to recovery for a select population (2). The importance of early extracorporeal membrane oxygenation (ECMO) or ventricular assist device implantation (for any period greater than a week) post-operatively, to sustain a patient with the expectation of recovery of natural ventricular function has been demonstrated(3).
It has been shown, in the adult population suffering from cardiomyopathy, that ventricular unloading can alleviate enough of the stress on the heart to allow for reverse remodeling and improved ventricular function (4). Studies have also been conducted, that demonstrated remodeling on a molecular level, using histological, genetic and biochemical markers (5,6,7). Both the reduction of metalloproteinase expression in the myocardial matrix and the decrease of myocardial fibrosis contribute to the reverse remodeling that correlates with ventricular function convalescence (8,9,10). Frazier et al. demonstrated significant heart function recovery in 31 patients supported with a left ventricular assist device (LVAD) for at least a month (11).
While the benefits of ventricular unloading are well documented, the optimal method of device removal and ventricular reloading, termed weaning, is still relatively controversial. The eventual goal of weaning is to reduce the flow rate of the device to a level at which the natural heart sustains the patient, and the device can be safely explanted. Frazier et al. outline a rapid rate reduction method incorporating both periodic hand pumping of the device as well as dobutamine stress testing to ensure sufficient cardiac function (12). Others prefer to gradually reduce the beat rate, or the stroke volume, which will effectively reduce the flow rate (13). The current in vitro study considers the fluid dynamics associated with the 12 cc pediatric pulsatile VAD operating at a reduced beat rate, the preferred method of flow rate reduction by the Penn State group (14).
Regardless of VAD type or weaning method, thromboembolism is the major concern of VAD designers and clinicians as both high and low shear regions can be anticipated. Mechanical heart valves are known to activate platelets and lyse red blood cells, steps early in the clotting cascade, while thrombus formation has been shown to correlate with low wall shear stress and long blood residence time (15). The minimum wall shear stress to prevent clot formation on segmented polyurethane (a material similar to the blood sac material of the Penn State VAD) was calculated by Hubbell and McIntire to be 500 s−1 (16). Although the coagulation cascade is quite complex, a reasonable design goal is to generate shear rates above the Hubbell and McIntire threshold, defined as sufficient “wall washing”, on all blood contacting surfaces of the Penn State PVAD.
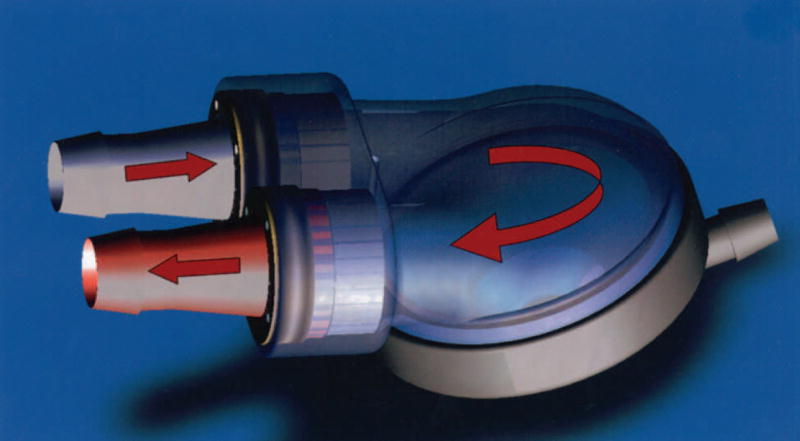
A review of aspects of VAD fluid mechanics important to thrombus deposition can be found in Deutsch et al. (17). Working with the 70 cc Penn State device, Baldwin et al. noted that a strong diastolic jet (1.9 m/s) produces a rotational flow that provides good wall washing. The success of adult VADs, coupled with the high transplant waiting list mortality of infants (40 % (18)) has prompted Penn State to develop a pediatric version of the clinically successful adult device. Aspects of the fluid dynamics within the latest design iteration, the 12 cc pulsatile device (Figure 1), have been studied at 86 bpm (beats per minute) (19), 75 bpm (20), and 50 bpm (14).
Figure 1.
The Penn State 12 cc pulsatile pediatric ventricular assist device (PVAD).
In a recently published study of the 12 cc pediatric VAD operated at 86 bpm, Manning et al. found that a weak diastolic jet (less than 1.0 m/s) failed to penetrate fully into the body of the device leading to shear regions below 500 s−1 throughout the cycle (19). However, concurrent ex vivo work conducted by Lukic et al. determined that the pump should be operated under the constraints of complete filling and complete ejection, conditions not met in the Manning et al. study, to reduce blood damage by valve cavitation (21). While maintaining complete filling and ejection at 75 bpm, Cooper et al., in a valve comparison study of the pump, found the Björk-Shiley Monostrut (BSM) tilting disc valve to be superior to the CarboMedics bi-leaflet valve, as it produced a stronger diastolic jet and higher wall shear rates (20). In order to assess the feasibility of weaning the patient from the device from a fluid dynamics viewpoint, Roszelle et al. performed a comparison study between 50 and 75 bpm. The investigation concluded that insufficient diastolic flow momentum resulted in more regions of low shear, below 500 s−1, at the lower beat rate (14).
Here, in an attempt to improve wall washing at a weaning beat rate, we reduce the time of filling to compress the inflow waveform and generate higher diastolic velocities in the body of the pump. As a result of diastolic compression, a delay must be added to the pump cycle between diastole and systole, which is referred to as the end-diastolic delay (EDD). For example, the 75 bpm study by Cooper et al. was conducted with an EDD of 10 ms (20). This parameter will affect the fluid dynamics; hence the current study compares the flow fields for EDDs of 10, 50, and 100 ms using particle image velocimetry (PIV).
Methods
In vivo, the chamber of the device consists of a segmented polyurethane blood sac and diaphragm. Positive pressure from a pneumatic driver inflates the diaphragm to expel fluid from the blood sac into the outlet cannula. Negative pressure then deflates the diaphragm to allow fluid to enter the device so the cycle can be repeated. In the implantable device, the diaphragm and blood sac are two separate structures to ensure that a leak in the diaphragm does not allow air to enter the circulation. To gather meaningful PIV data from within the chamber of the 12 cc Penn State PVAD, modifications had to be made to the clinically implanted prototype. To allow the laser to penetrate the chamber of the device, the stationary boundaries of the device were modeled out of acrylic. To further improve optical access, the blood sac was removed and the interior surface of the model, opposite the diaphragm, was contoured to simulate the curvature of the blood sac and stationary component of the device.
The PIV experiments were performed using the 12cc Penn State PVAD in series with a mock circulatory system originally designed by Rosenberg et al. (22). The valves used in the device were two 17 mm Björk-Shiley Monostrut valves (effective orifice area of 1.1 cm2) in the mitral and aortic positions. The BSM valve was oriented so that the strut was parallel to the diaphragm and the major orifice opened to the outside wall of the device for both the mitral and aortic positions. The segmented-polyurethane diaphragm was inflated with a pneumatic pump which allows beat rate, systolic duration, driveline pressure, and driveline vacuum to be set independently. For the current study, the heart rate was fixed at 50 bpm, the flow rate at 0.8 L/min, and the systolic duration at 33% (400 ms) of the 1200 ms cycle to simulate a reduced flow rate, weaning condition. The aortic pressure was maintained at 90/60 mmHg throughout to simulate physiological conditions typical of pediatric patients (23).
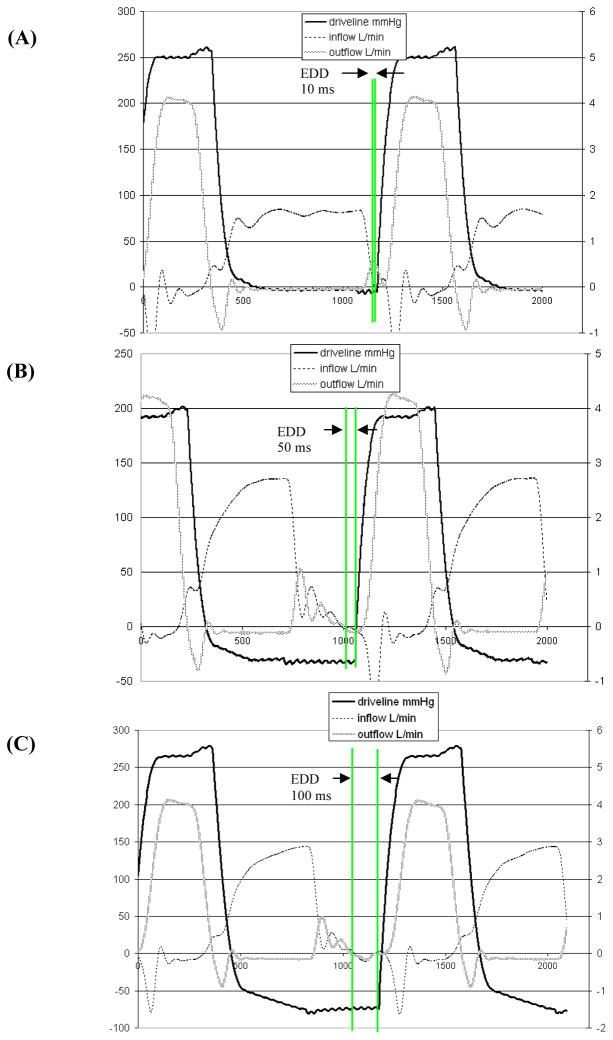
The experimental operating parameter of this study was the end-diastolic delay, the time between the end of inflow (diastole) and the start of outflow (systole). The three end-diastolic delays tested were 10, 50, and 100 ms (referred to as 10, 50, and 100 EDD in Figure 2). These end-diastolic delays correspond to reduced diastolic times of 790, 750, and 700 ms, respectively. Complete device ejection, which occurs when the time from the start of systole (positive drive line slope) to the end of systole (zero outflow) is less than or equal to the systolic duration (as set on the pump), was assured for each end diastolic time.
Figure 2.
Inflow, outflow and driveline pressure waveforms for the (A) 10, (B) 50, and (C) 100 ms end-diastolic delay (EDD) conditions.
A 40% hematocrit viscoelastic blood analog, with an index of refraction matching that of the acrylic model (n = 1.488), was used. It consists of xanthan gum (0.03 %), glycerin (16%), sodium iodide (50%), and water (35%) and is based on work by Brookshier and Tarbell (15) as modified by Long et al. (24). The flow was seeded with 10 micron hollow glass beads (Potters Industries Inc., Valley Forge, PA). Inlet and outlet flow waveforms were measured using ultrasonic flow meters (Transonic Systems, Inc., Millis, MA). Aortic, atrial, and driveline pressure waveforms were measured using pressure transducers (Maxxim Medical, Athens, TX). Flow and pressure waveforms for all three end-diastolic delay conditions are shown in Figure 2.
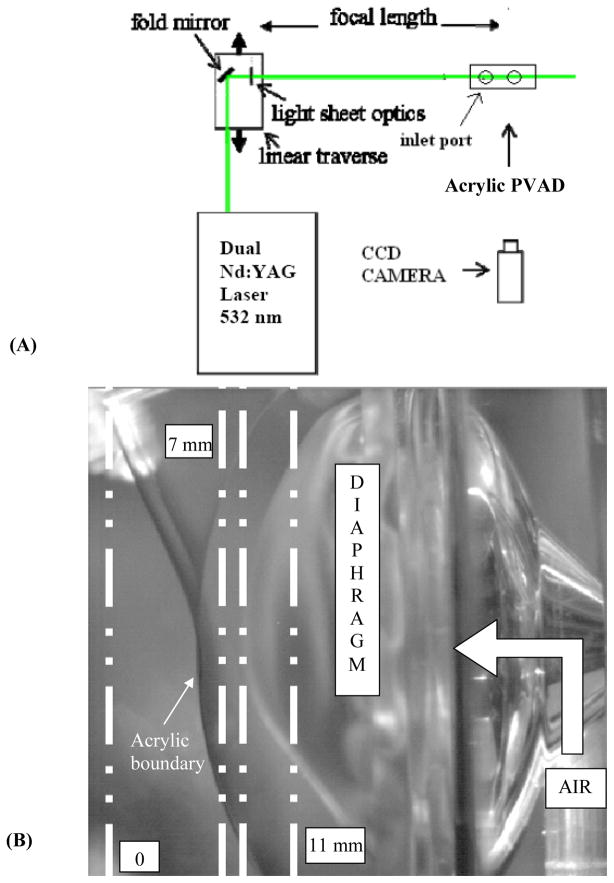
Particle image velocimetry was used to produce global views of instantaneous flow fields. Dual Nd:YAG lasers (New Wave Research Inc., Fremont, CA) provided the light source, with approximately 120 mJ/pulse at 532 nm wavelength and a pulse width of 10 ns. The 6 mm diameter beam was passed through a −25 mm cylindrical lens coupled with a 25 mm diameter high-energy mirror and a 500 mm spherical lens to create a 200 μm thick light sheet across the model. Data were taken in three planes parallel to the diaphragm at 7, 8.2, and 11 mm from the leading edge of the ports of the PVAD, as illustrated in Figure 3.
Figure 3.
(A) Schematic illustrating the experimental PIV setup and (B) PVAD acrylic test model highlighting the 7, 8.2, and 11 mm data acquisition planes.
The PIV images were captured using a PIVCAM 10-30 charge-coupled device (CCD) camera (TSI, Inc., Shoreview, MN). The camera has a 1000 × 1016 pixel CCD chip with a 9 μm/pixel square spacing. It was operated at a fixed frame rate of 30 Hz, with a shutter open time of 225 μs. Frame straddling was employed to enable each laser pulse to be captured on its own frame, which effectively eliminates directional ambiguity and improves the dynamic range of the image. A laser pulse delay of 300 μs was chosen for all measurements. With a maximum velocity in the device of about 0.7 m/s and a camera resolution of 58 μm/pixel, this yields a maximum particle displacement of 3 pixels.
The images were processed using Insight 3G (TSI, Inc., Shoreview, MN). The software divides the images into small “interrogation regions” and computes the average particle displacement within each region by performing a spatial cross-correlation between each image pair. We used a deformation grid with an initial interrogation region size of 32 × 32 pixels and a final size of 16 × 16. The recursive Hart Correlation algorithm (25) was used for cross-correlation, since it more efficiently uses the extra information garnered from correlation algorithms that overlap interrogation regions than do standard, fast fourier transform (FFT) techniques. The average particle displacement for each interrogation region is divided by the laser pulse delay to obtain the velocity of the particles. The data was taken every 50 ms in the cardiac cycle, referenced to the start of inflow. For each of the collection points, 200 sets of PIV images were averaged and the resulting flow field plotted and analyzed.
Wall shear rates were calculated by dividing the tangential component of velocity to the wall by the normal distance between it and the wall. A zero masking and a fluid centroid shifting technique were performed to facilitate a wall coordinate decomposition of the near wall velocity vectors and a first order, one-sided differencing of the tangential velocity component. A no-slip boundary condition at the wall was used. Further details of the wall shear rate calculation can be found in Hochareon et al. (26).
Results
The complex geometry of this device necessitates caution in the data collection and analysis process. Some of the possible concerns are bias and precision errors, three dimensionality, and imaging artifacts due to light sheet reflections and concomitant CCD camera pixel saturation. The overall error associated with our current wall shear rate calculations is approximately 20%, with the velocity error contributing only a fraction of a percent to this error. A more complete discussion on error analysis regarding our measurements is given in Cooper et al.(20).
Another challenge with data collection of this type is to capture the flow in a three dimensional device with an inherently two dimensional method. In order to obtain a global view of the fluid dynamics of the device, we acquired data in three planes parallel to the diaphragm and 9 planes perpendicular to the diaphragm. While the entire data set was thoroughly analyzed, only the flow maps in the 8.2 mm plane (parallel to the diaphragm) and the wall shear maps in the 7 and 11 mm planes will be presented. Any deviations in other planes of the device are noted.
Flow Maps
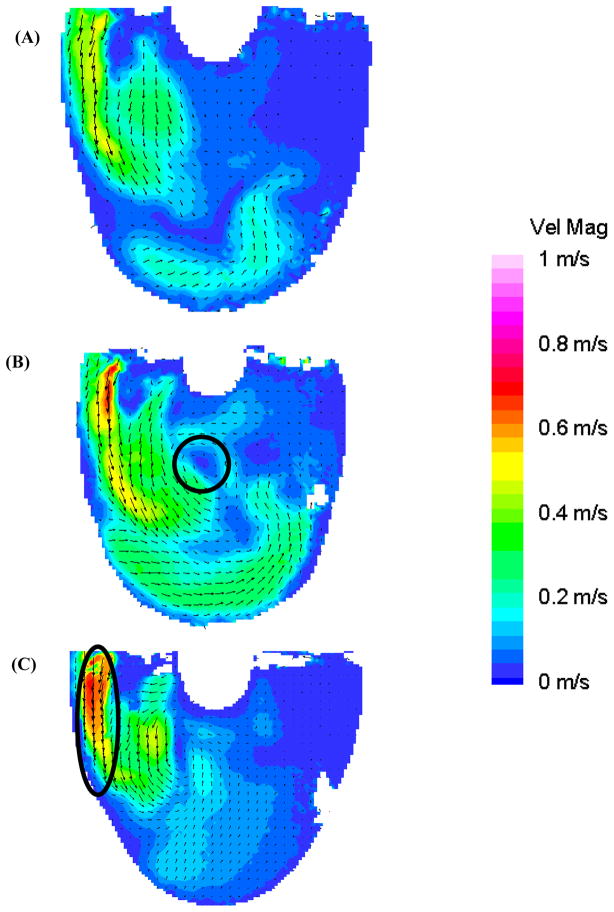
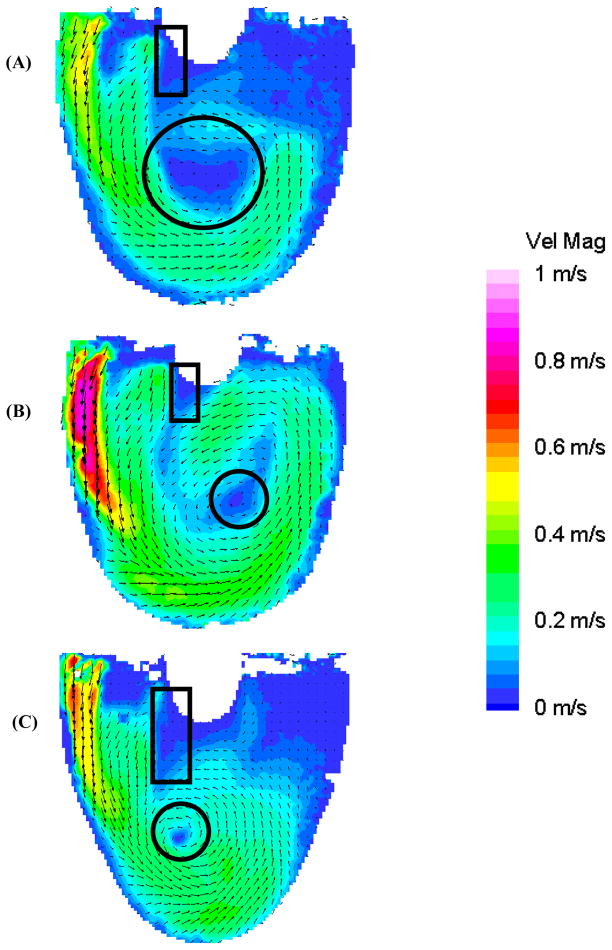
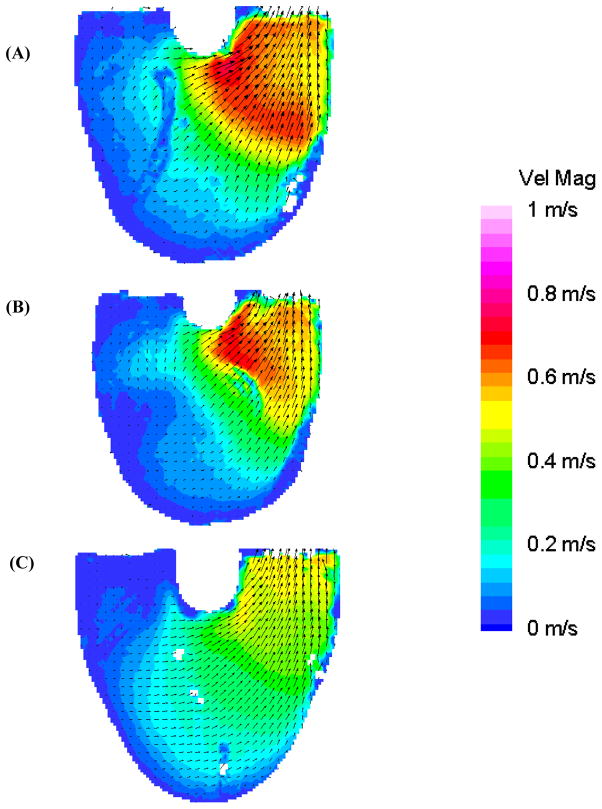
We have shown that a strong inlet jet is crucial to establishing a uniform rotational flow pattern (17). In early diastole (Figure 4: 300 ms), the 100 EDD condition has the strongest diastolic jet with a larger area of high velocity (oval Figure 4c, maximum velocity 0.7 m/s) than either the 10 or 50 EDD experiments. However, the inlet jet associated with the 50 EDD condition penetrates deeper into the device than the higher velocity 100 EDD condition. This penetration leads to a rotational core forming early for the 50 EDD condition (circle in Figure 4b). The inlet jets continue to build in the 10 and 50 ms end diastolic delay conditions as diastole progresses. The inlet jet in the 100 EDD condition reaches maximum velocity at 350 ms and starts to decay in breadth and magnitude as diastole progresses. Although, the rotational flow pattern continues to strengthen until mid diastole.
Figure 4.
Mean PIV flow maps in the 8.2 mm plane at 300 ms for the (A) 10 (B) 50, and (C) 100 EDD condition demonstrating the developing recirculating flow pattern in the 50 EDD condition (circle in (B)) and formation of the diastolic jet in the 100 EDD condition (oval in (C)).
In mid diastole (Figure 5: 450 ms), the inlet jet in the 50 EDD condition peaks with a maximum velocity of 0.85 m/s. This jet penetrates to the apex of the device and is diverted along the outer walls in a broad, circular flow pattern that is characteristic with wall washing sufficient to prevent thrombosis (27). The center of this rotational flow pattern has wandered toward the outlet port over 150 ms (circles in Figure 4b and 5b). The 100 EDD condition (Figure 5c) has intermediate inlet jet strength relative to the 10 and 50 EDD conditions, with a maximum velocity of 0.7 m/s, wrapping around the outside wall to contribute to the established rotational flow. While this tight rotary pattern may at first appear advantageous, it leaves a large flow separation near the inner inlet wall (rectangle in Figure 5c). Also, there is very low flow at the outlet of the device in contrast to the 50 EDD condition. The entering fluid in the 10 EDD condition, with the weakest inlet jet at this time, does not have enough momentum to reach the outlet side of the device with enough velocity (maximum 0.5 m/s) to generate the desired rotational flow pattern. Flow separation near the inlet wall is also noted with a rectangle in Figure 5 in both the 10 and 50 EDD conditions (Figures 5a and 5b, respectively); with the larger separation occurring in the 10 EDD condition.
Figure 5.
Mean PIV flow maps in the 8.2 mm plane at 450 ms for the (A) 10 (B) 50, and (C) 100 EDD condition showing fluid separation near the inner wall (rectangles) and the rotational flow patterns (circles) of differing intensity.
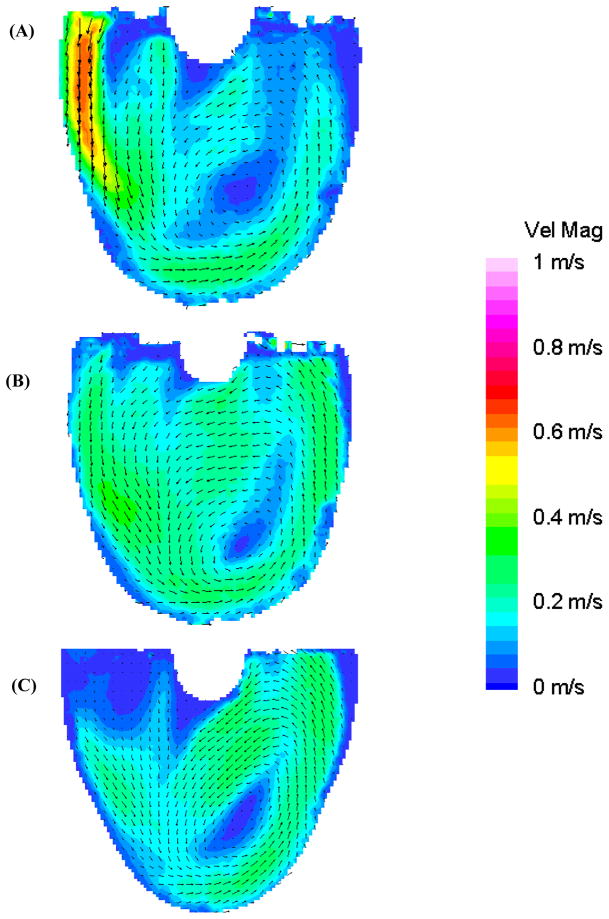
In late diastole, the rotational flow pattern in the 50 EDD condition is maintained until 600 ms. Figure 6 shows flow maps of the 8.2 mm plane for all three conditions at 650 ms to show the time evolution of the respective rotational flow patterns. The rotational flow pattern in the 100 EDD condition, absent of any semblance of an inlet jet after 650 ms, begins to dissociate. The rotational flow pattern of the 10 EDD condition, with an inlet jet lasting until after 750 ms, never fully develops with significant velocity as a result of the lack of a strong enough inlet jet; a result seen in Roszelle et al. (14).
Figure 6.
Mean PIV flow maps in the 8.2 mm plane at 650 ms for the (A) 10 (B) 50, and (C) 100 EDD condition, showing the evolution of the respective flow patterns.
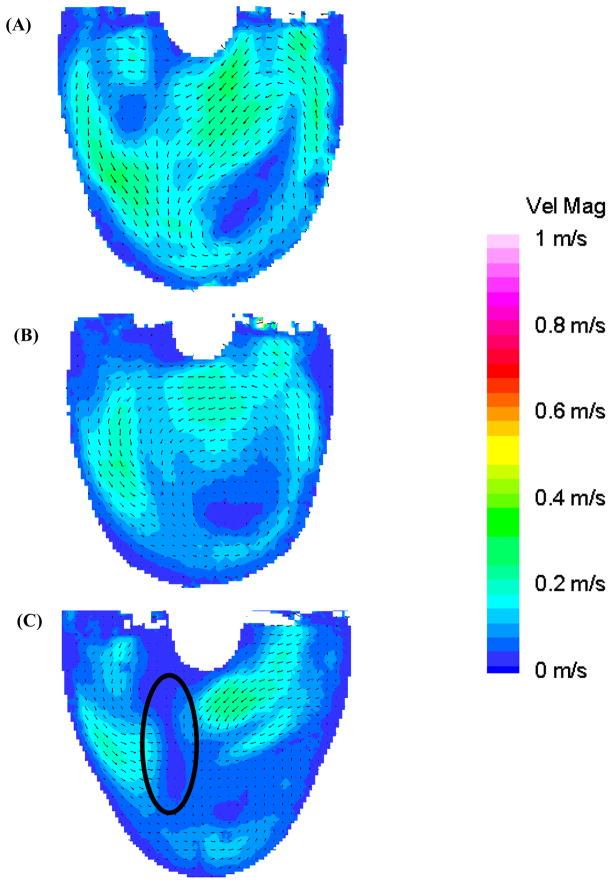
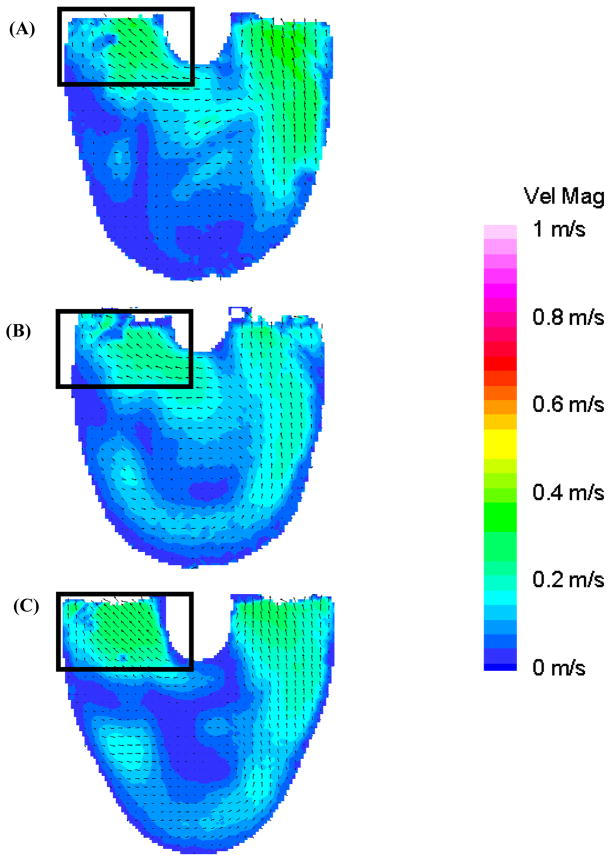
Figure 7, at 850 ms, shows the transitional period between diastole and systole. The flow pattern in the 50 EDD condition is the most organized (Figure 7b) owing to the sustained high velocity inlet jet. The 100 EDD condition shows a much disorganized flow pattern throughout the body of the device, with relatively low velocity and an area of counter productive fluid convergence near the center of the device (oval in Figure 7c). The 10 EDD is the intermediate condition with a flow that, while somewhat disorganized, still appears to be attached to the walls of the device (Figure 7a). As systole progresses, the fluid transitions from the standard diastolic rotational flow pattern to a more disorganized pattern for 50–100 ms, and then to ejection. Surprisingly, within this transitional period (Figure 8: 950 ms), the inlet valve opens and some fluid leaks into the inlet cannula. This is consistent in all three conditions with the most significant being the 100 EDD and the least significant being the 10 EDD, as illustrated with rectangles in Figure 8. The outlet jet gains momentum as systole progresses in all three conditions without any striking anomalies. The only curious aspect of the flow, as the pump ejects the fluid from the device, is the varying strength of the outlet jets throughout the different time conditions. One would expect that without any major alterations to systole, the velocity of the outlet jets would all be of equal magnitude. This rationale holds true for the 10 and 50 EDD conditions with a maximum velocity of 0.75 m/s, but not for the 100 EDD, with a maximum velocity of 0.5 m/s (Figure 9). One explanation is that while the diaphragm motion is similar for the 10 and 50 EDD conditions, it is markedly different for the 100 EDD condition. This may be a result of increased driveline pressures necessary to produce an end diastolic delay of 100 ms.
Figure 7.
Mean PIV flow maps in the 8.2 mm plane at 850 ms for the (A) 10 (B) 50, and (C) 100 EDD condition, illustrating the transition from diastole to systole and the marked area of disorganization in the 100 EDD condition (oval in (C)).
Figure 8.
Mean PIV flow maps in the 8.2 mm plane at 950 ms for the (A) 10 (B) 50, and (C) 100 EDD condition show the regurgitation of fluid out of the inlet valve (rectangles) during the beginning of systole.
Figure 9.
Mean PIV flow maps in the 8.2 mm plane at 1100 ms for the (A) 10 (B) 50, and (C) 100 EDD condition demonstrating the differences in systolic jets in the three conditions.
Discussion
Wall Shear
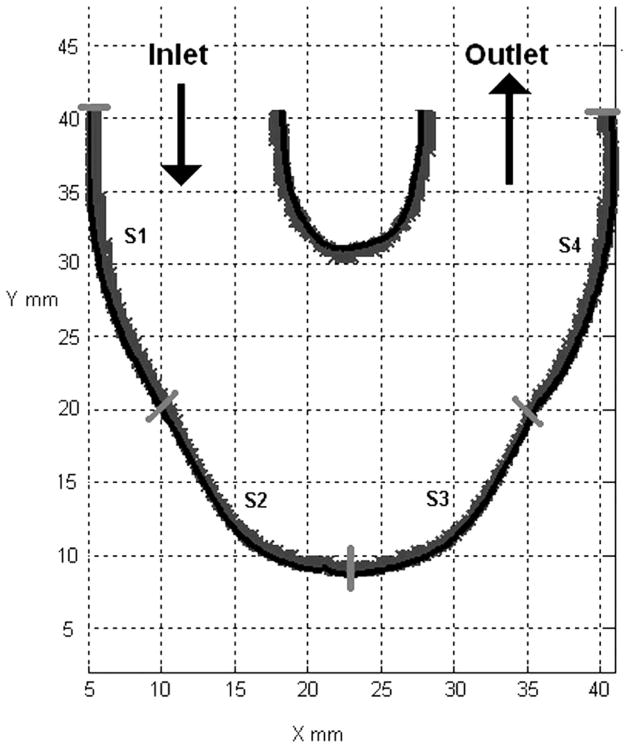
The three different end diastolic delays, 10, 50 and 100 ms, produced different flow patterns in the body of the device. More desirable flow patterns will result in more regions of wall shear rates over 500 s−1. to help prevent fibrin/thrombus deposition throughout the body of the device. We used an in-house Matlab 7.1 algorithm (26) to calculate the wall shear rate. We divided the outer wall of the device into 4 segments (Figure 10). The outer wall is defined in a counter-clockwise fashion, with the origin of the wall at the inlet valve port. The high degree of lateral curvature between the ports makes determining wall location difficult, which adds to the uncertainty of the calculated wall shear values, so that those results are not presented here. Repositioning of the light source in combination with high magnification PIV might help to obtain accurate results in this location.
Figure 10.
Surface locations (S1–S4) used in wall shear calculations for all three end diastolic delay conditions.
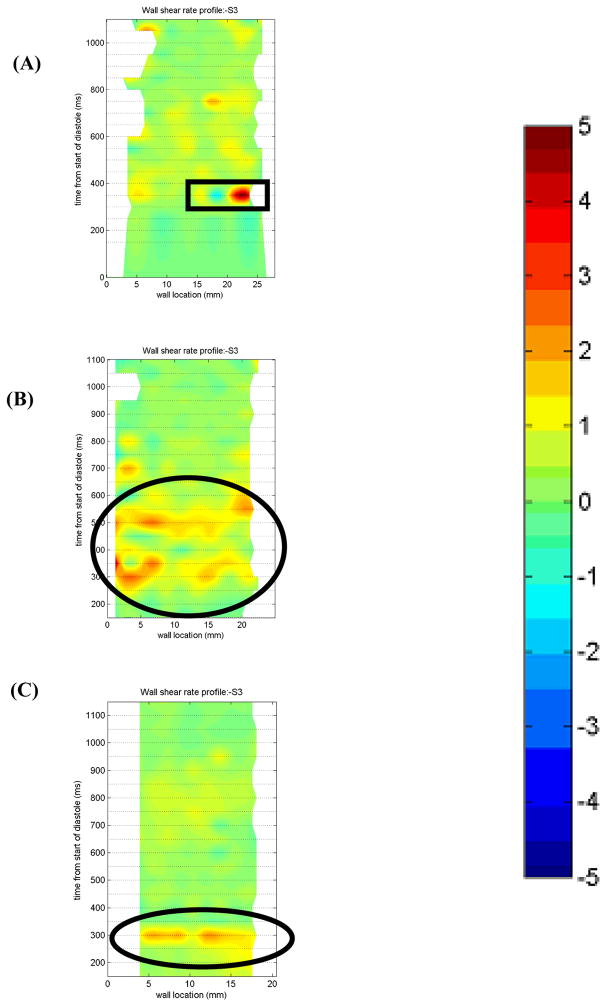
A flood contour map was generated for each surface for the three EDD trials. The color corresponds to wall shear rate, which is placed spatially (according to wall location) and temporally (according to time in the cardiac cycle) in the x and y axes, respectively. The raw shear rate values were normalized by 500 s−1. In the absence of data more detailed than that of Hubbell and McIntire, we assume that anything above 500 s−1 (1 or −1 in the plots) is sufficient to prevent thrombus deposition (16). In order to present more of the extensive data set and still remain within space constrictions, select wall shear figures from the 7 and 11 mm plane are presented. The wall shear rates will be discussed, without figures, in the context of the previously presented flow maps from the 8.2 mm plane.
Surface 1
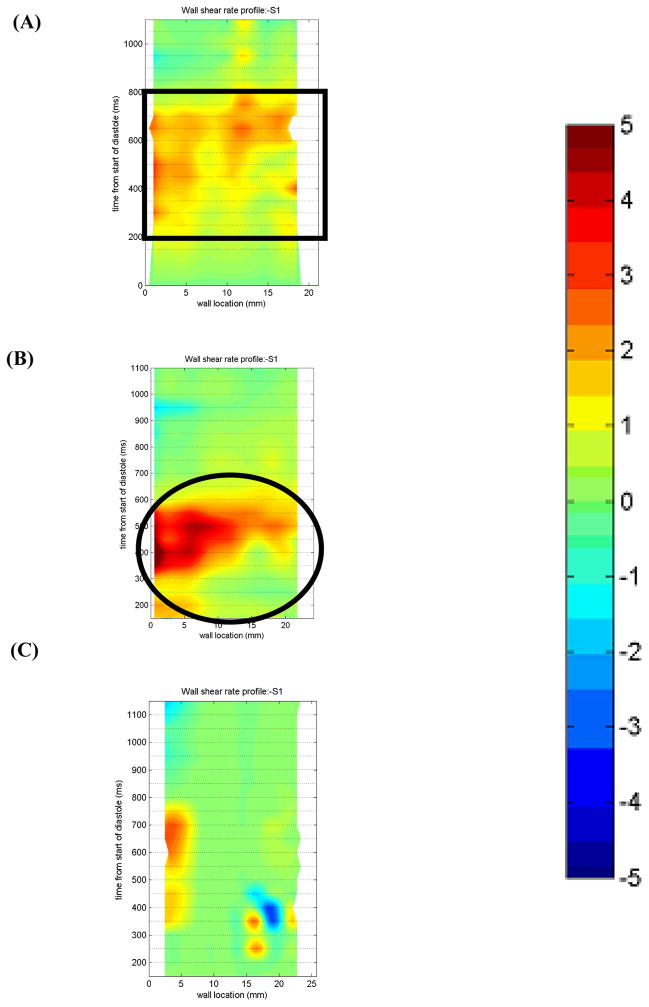
In the 7 mm plane (Figure 11), there is sufficient wall washing with the 50 EDD condition from 400–600 ms for all locations along Surface 1, as indicated in an oval in Figure 11b. Because of the separation of the inlet jet in the 100 EDD condition (indicated with a box in Figure 6), there is very low wall shear along the majority of the wall. The 10 EDD condition shows a better wall shear profile than the 100 EDD. There is a large area of shear greater than 500 s−1 from 200–800 ms (rectangle in Figure 11a). However, the maximum wall shear is lower than that of the 50 EDD condition.
Figure 11.
Non-dimensionalized wall shear maps for Surface 1 in the 7 mm plane for the (A) 10 (B) 50, and (C) 100 EDD condition. Areas of interest are highlighted with a rectangle in (A) and an oval in (B). Note that the wall locations are defined in a counterclockwise fashion.
The 8.2 mm plane illustrates similar wall shear patterns for both the 50 and 100 EDD conditions. High wall shear (4,000 s−1) occurs in both conditions in a 10 mm region at the inlet of the device from 350–600 ms. Earlier in the cardiac cycle, there is still sufficient washing at this location for both conditions with the 100 EDD having slightly larger wall shear rates. The 10 EDD condition shows a broader area of sufficient shear than the other two conditions. While the 10 EDD never demonstrates wall shear rates eclipsing 4,000 s−1, the larger area of shear rates over 500 s−1 may prove to prevent thrombus more successfully than the other two end diastolic delay conditions.
The 11 mm plane (not shown) demonstrates sufficient wall washing during diastole in the 50 EDD condition. The high shear region that develops in the 11 mm plane is due to the strong inlet jet that is established early in diastole in the 50 EDD condition. The 100 EDD condition shows an area of sufficient shear in the same approximate location as the other conditions, the section of the wall closest to the inlet valve. The entire wall does not get washed because the inlet jet separates from the wall. All of Surface 1 is washed in the 10 EDD condition from 450–800 ms. The reason for the delay in higher shear areas is the extra time it takes for the inlet jet to develop and reach a maximum as compared to the 50 or the 100 EDD.
Surface 2
Along Surface 2, the lower half of the inlet wall (Figure 10), the wall shear decreases significantly in all three conditions in the 7 mm plane (not shown). The 10 EDD condition shows one isolated area of high shear for the first 5 mm of the wall which spans 550–850 ms into the cardiac cycle. On the other hand, the 50 EDD condition shows multiple regions of sufficient washing throughout the entire cardiac cycle. The wall shear rate never exceeds 1500 s−1 but the multiple regions over 500 s−1 would seem preferable over the one isolated region of more intense shear that is seen in the 10 EDD condition. The 100 EDD, over the entire cycle, shows wall shear rates less than 500 s−1 at every location along Surface 2.
Data in the 8.2 mm plane follow similar trends to the 7 mm plane at Surface 2. The 50 EDD conditions shows similar, though somewhat less frequent, regions of sufficient shear throughout the majority of the cycle. There is, however, higher wall shears concentrated from 300–600 ms associated with the higher velocity of the inlet jet at this time for the 50 EDD condition. The 10 EDD shows areas of sufficient shear similar to that of the 50 EDD condition, although it takes longer to develop. The 100 EDD condition again shows a lack of wall washing throughout the entire cardiac cycle.
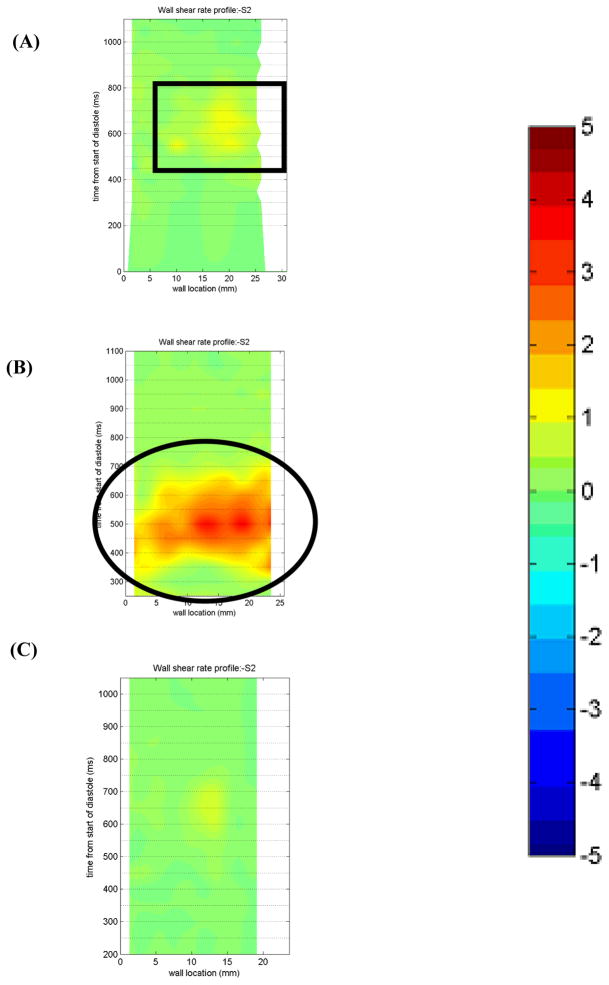
The 11 mm plane (Figure 12) shows a markedly different wall shear rate pattern for the three end diastolic delay conditions. When operating the PVAD with an end diastolic delay of 50 ms, from 300–700 ms in the cardiac cycle, Surface 2 is sufficiently washed with wall shear rates as high as 3600 s−1 (Oval in Figure 12b). This pattern is far superior to that observed for the 10 and 100 EDD conditions. The 10 EDD condition shows only an isolated region with shear rates over 500 s−1 indicated with a box in Figure 12a. The 100 EDD condition has only one area with shear rates of approximately 500 s−1(Figure 12c).
Figure 12.
Non-dimensionalized wall shear maps for Surface 2 in the 11 mm plane for the (A) 10 (B) 50, and (C) 100 EDD condition. Areas of interest are highlighted with a rectangle in (A) and an oval in (B). Note that the wall locations are defined in a counterclockwise fashion.
Surface 3
In the 7 mm plane at Surface 3 (Figure 13), the bottom half of the outlet wall (Figure 10), the three end diastolic delays produce different wall shear profiles. The 50 EDD demonstrates wall shear rates over the 500 s−1 threshold for most of diastole (oval in Figure 13b). This is consistent with the strong rotational flow seen in the 50 EDD condition. The strength and uniformity of the inlet jet leads to relatively high velocities near the wall of the device which can act to prevent thrombus formation. The 10 EDD condition exhibits an interesting flow reversal at 350 ms highlighted in the rectangle in Figure 13a. Upon further inspection of the flow maps, velocity vector contribution maps, and raw images, we conclude that this is an imaging artifact caused by a reflection of the light sheet off of the diaphragm. The remainder of the wall shear profile shows some regions of sufficient washing after 300 ms that will aid in the prevention of the thrombus deposition. The 100 EDD condition is relatively unremarkable with only one region of possible washing at 300 ms (circle in Figure 13c).
Figure 13.
Non-dimensionalized wall shear maps for Surface 3 in the 7 mm plane for the (A) 10 (B) 50, and (C) 100 EDD condition. Areas of interest are highlighted with a rectangle in (A) and ovals in (B) and (C). Note that the wall locations are defined in a counter-clockwise fashion.
Surface 3, in the 8.2 mm plane, provides a slightly different shear pattern than either the 7 or 11 mm planes. The 10 and 50 EDD conditions both show regions of wall shear over the 500 s−1 threshold for a third of the cardiac cycle (450–850 ms and 400–800 ms, respectively). This 50 ms delay in adequate wall washing is due, in part, to the increased time it takes the 10 EDD condition to establish a rotational flow pattern. Curiously, within this 400 ms time frame, both the 10 and 50 EDD show sharp peaks (2500 s−1) in wall shear; with the 50 EDD condition containing more such peaks. In contrast to these two conditions, the 100 EDD demonstrates sufficient wall shear over the 500 s−1 threshold for only one fourth of the cardiac cycle. However, within this 300 ms (600–900 ms), the wall shear rate is consistent at roughly 1750 s−1, in contrast to the peaked pattern seen in the 10 and 50 EDD conditions. This can be accounted for by the continuity of the rotational flow pattern, albeit shorter in duration, of the 100 EDD condition.
In the 11 mm plane (not shown), the 50 EDD condition shows the most desirable wall shear pattern. The strong circulatory flow pattern established by the sustained inlet jet produced significant tangential velocities along the entire outer wall of the device. This is evident in the wall shear map, with adequate washing (maximum 1800 s−1) along the majority of the wall from 300–750 ms. The 10 EDD condition is less successful at producing adequate shears in the 11 mm plane at Surface 3. There is a small region of less intense wall shear (600 s−1) for the first third of the wall throughout the cardiac cycle. The 100 EDD condition does not produce adequate wall shear anywhere along Surface 3 in the 11 mm plane at any point in the cardiac cycle. This low shear at Surface 3 can be attributed to the weaker rotational flow pattern set up by the quite transient high velocity inlet jet. The short duration and proximity to the inlet wall of the device do not allow sufficient washing of Surface 3.
Surface 4
The wall shear profiles in all three planes for all three conditions demonstrate relatively low shear for most of the cardiac cycle, but high shear during the ejection phase of systole. The magnitude of the shear is about 500 s−1 larger in the 10 and 50 EDD conditions because of the higher velocity systolic jet. The 100 EDD has lower wall shear rates due to the more diffuse systolic jet as seen in Figure 9.
Conclusions
We observe the effects of altering diastolic timing while maintaining a constant beat rate. We had hypothesized that by compressing the inflow waveform, stronger diastolic jets would produce a tighter, more sustained rotational flow and lead to greater shear rates at the walls of the device. With this in mind we expected the 100 ms end diastolic delay to have the best wall shear profiles. Surprisingly, this was not the case. However, the 50 ms end diastolic delay provided a significant improvement over the 10 ms end diastolic delay condition used in earlier 50 bpm studies (14).
These findings show that with minor protocol alterations (changing the settings on the pneumatic driver), wall shear rate, and thus device performance, can be greatly improved. This highlights the changing role of fluid dynamics studies in VAD design; from a more time consuming mantra of optimization of device geometry to a more delicate manipulation of operational parameters. Now, devices can be run at beat rates that were previously at high risk for thromboembolism, such as those associated with weaning, with only minor parameter modifications. Additional work, focused on diastolic, end diastolic delay, and systolic timing, as well as device-ventricle synchronization, can prove beneficial in the design and development of all pulsatile ventricular assist devices.
Acknowledgments
Supported by NIH NHLBI Grant HV 48191.
References
- 1.American Heart Association. Statistical Reference Book. Dallas, TX: 2005. [Google Scholar]
- 2.Duncan BW, Hraska V, Jonas RA, Wessel DL, Del Nido PJ, Laussen PC, Mayer JE, Lapierre RA, Wilson JM. Mechanical circulatory support in children with cardiac disease. J Thorac Cardiovasc Surg. 1999;117:529–42. doi: 10.1016/s0022-5223(99)70333-8. [DOI] [PubMed] [Google Scholar]
- 3.Ferrazzi P, Glauber M, Di Domenico A, Fiocchi R, Mamprin F, Gamba A, Crupi G, Cossolini M, Parenzan L. Assisted circulation for myocardial recovery after repair of congenital heart disease. Eur J Cardiothorac Surg. 1991;5:419–23. doi: 10.1016/1010-7940(91)90187-o. [DOI] [PubMed] [Google Scholar]
- 4.Frazier OH, Benedict CR, Radovancevic B, Bick RJ, Capek P, Springer WE, Macris MP, Delgado R, Buja LM. Improved left ventricular function after chronic left ventricular unloading. Ann Thorac Surg. 1996;62:675–82. doi: 10.1016/s0003-4975(96)00437-7. [DOI] [PubMed] [Google Scholar]
- 5.Lee SH, Doliba N, Osbakken M, Oz M, Mancini D. Improvement of myocardial mitochondrial function after hemodynamic support with left ventricular assist devices in patients with heart failure. J Thorac Cardiovasc Surg. 1998;116:344–9. doi: 10.1016/s0022-5223(98)70136-9. [DOI] [PubMed] [Google Scholar]
- 6.Milting H, EL Banayosy A, Kassner A, Fey O, Sarnowski P, Arusoglu L, Thieleczek R, Brinkmann T, Kleesiek K, Korfer R. The time course of natriuretic hormones as plasma markers of myocardial recovery in heart transplant candidates during ventricular assist device support reveals differences among device types. J Heart Lung Transplant. 2001;20:949–55. doi: 10.1016/s1053-2498(01)00289-3. [DOI] [PubMed] [Google Scholar]
- 7.Uray IP, Connelly JH, Frazier OH, Taegtmeyer H, Davies PJ. Mechanical unloading increases caveolin expression in the failing human heart. Cardiovasc Res. 2003;59:57–66. doi: 10.1016/s0008-6363(03)00352-3. [DOI] [PubMed] [Google Scholar]
- 8.Bruckner BA, Stetson SJ, Perez-Verdia A, Youker KA, Radovancevic B, Connelly JH, Koerner MM, Entman ME, Frazier OH, Noon GP, Torre-Amione G. Regression of fibrosis and hypertrophy in failing myocardium following mechanical circulatory support. J Heart Lung Transplant. 2001;20:457–64. doi: 10.1016/s1053-2498(00)00321-1. [DOI] [PubMed] [Google Scholar]
- 9.Müller J, Wallukat G, Weng YG, Dandel M, Spiegelsberger S, Semrau S, Brandes K, Bieda H, Hummel M, Loebe M, Meyer R, Hetzer R. Temporary mechanical left heart support. Recovery of heart function in patients with end-stage idiopathic dilated cardiomyopathy. Herz. 1997;22:227–36. doi: 10.1007/BF03044251. [DOI] [PubMed] [Google Scholar]
- 10.Li YY, Feng Y, McTiernan CF, Pei W, Moravec CS, Wang P, Rosenblum W, Kormos RL, Feldman AM. Downregulation of matrix metalloproteinases and reduction in collagen damage in the failing human heart after support with left ventricular assist devices. Circulation. 2001;104:1147–52. doi: 10.1161/hc3501.095215. [DOI] [PubMed] [Google Scholar]
- 11.Nishimura M, Radovancevic B, Odegaard P, Myers T, Springer W, Frazier OH. Exercise capacity recovers slowly but fully in patients with a left ventricular assist device. ASAIO J. 1996;42:M568–70. doi: 10.1097/00002480-199609000-00050. [DOI] [PubMed] [Google Scholar]
- 12.Frazier OH, Delgado RM, 3rd, Scroggins N, Odegaard P, Kar B. Mechanical bridging to improvement in severe acute “nonischemic, nonmyocarditis” heart failure. Congest Heart Fail. 2004;10:109–13. doi: 10.1111/j.1527-5299.2004.03366.x. [DOI] [PubMed] [Google Scholar]
- 13.Slaughter MS, Silver MA, Farrar DJ, Tatooles AJ, Pappas PS. A new method of monitoring recovery and weaning the Thoratec left ventricular assist device. Ann Thorac Surg. 2001;71:215–8. doi: 10.1016/s0003-4975(00)01930-5. [DOI] [PubMed] [Google Scholar]
- 14.Roszelle BN, Cooper BT, Long TC, Deutsch S, Manning KB. The 12 cc Penn State pulsatile pediatric ventricular assist device: flow field observations at a reduced beat rate with application to weaning. ASAIO J. 2008;54:325–31. doi: 10.1097/MAT.0b013e3181695cfe. [DOI] [PubMed] [Google Scholar]
- 15.Brookshier KA, Tarbell JM. Evaluation of a transparent blood analog fluid: aqueous xanthan gum/glycerin. Biorheology. 1993;30:107–16. doi: 10.3233/bir-1993-30202. [DOI] [PubMed] [Google Scholar]
- 16.Hubbell JA, McIntire LV. Visualization and analysis of mural thrombogenesis on collagen, polyurethane and nylon. Biomaterials. 1986;7:354–63. doi: 10.1016/0142-9612(86)90006-2. [DOI] [PubMed] [Google Scholar]
- 17.Deutsch S, Tarbell JM, Manning KB, Rosenberg G, Fontaine AA. Experimental Fluid Mechanics of Pulsatile Artificial Blood Pumps. Annu Rev Fluid Mech. 2006;38:65–86. [Google Scholar]
- 18.Dellgren G, Koirala B, Sakopoulus A, Botta A, Joseph J, Benson L, McCrindle B, Dipchand A, Cardella C, Lee KJ, West L, Poirier N, Van Arsdell GS, Williams WG, Coles JG. Pediatric heart transplantation: improving results in high-risk patients. J Thorac Cardiovasc Surg. 2001;121:782–91. doi: 10.1067/mtc.2001.111383. [DOI] [PubMed] [Google Scholar]
- 19.Manning KB, Wivholm BD, Yang N, Fontaine AA, Deutsch S. Flow behavior within the 12-cc Penn State pulsatile pediatric ventricular assist device: an experimental study of the initial design. Artif Organs. 2008;32:442–52. doi: 10.1111/j.1525-1594.2008.00565.x. [DOI] [PubMed] [Google Scholar]
- 20.Cooper BT, Roszelle BN, Long TC, Deutsch S, Manning KB. The 12 cc Penn State pulsatile pediatric ventricular assist device: fluid dynamics associated with valve selection. J Biomech Eng. 2008;130:041019-1–041019-14. doi: 10.1115/1.2939342. [DOI] [PubMed] [Google Scholar]
- 21.Lukic B, Zapanta CM, Griffith KA, Weiss WJ. Effect of the diastolic and systolic duration on valve cavitation in a pediatric pulsatile ventricular assist device. ASAIO J. 2005;51:546–50. doi: 10.1097/01.mat.0000178964.45296.9b. [DOI] [PubMed] [Google Scholar]
- 22.Rosenberg G, Phillips WM, Landis D, Pierce WS. Design and Evaluation of The Pennsylvania State University Mock Circulatory System. ASAIO J. 1981;4:41–49. [Google Scholar]
- 23.Mavroudis C, Backer CL. Pediatric Cardiac Surgery. Philadelphia, PA: Mosby Inc; 2003. pp. 119–122. [Google Scholar]
- 24.Long JA, Undar A, Manning KB, Deutsch S. Viscoelasticity of pediatric blood and its implications for the testing of a pulsatile pediatric blood pump. ASAIO J. 2005;51:563–6. doi: 10.1097/01.mat.0000180353.12963.f2. [DOI] [PubMed] [Google Scholar]
- 25.Hart DP. Super-Resolution PIV Processing by Recursive Local-Correlation. J Visualization. 1999;10:187–194. [Google Scholar]
- 26.Hochareon P, Manning KB, Fontaine AA, Tarbell JM, Deutsch S. Wall Shear-Rate Estimation within the 50cc Penn State Artificial Heart using Particle Image Velocimetry. J Biomech Eng. 2004;126:430–437. doi: 10.1115/1.1784477. [DOI] [PubMed] [Google Scholar]
- 27.Hochareon P, Manning KB, Fontaine AA, Tarbell JM, Deutsch S. Correlation of In Vivo Clot Deposition with the Flow Characteristics in the 50 cc Penn State Artificial Heart: A Preliminary Study. ASAIO J. 2004;50:537–542. doi: 10.1097/01.mat.0000145694.40637.a0. [DOI] [PubMed] [Google Scholar]


