Abstract
Several family-based approaches for testing genetic association with traits obtained from longitudinal or repeated measurement studies have been previously proposed. These approaches utilize the multivariate data more efficiently by using estimated optimal weights to combine univariate tests. We show that these FBAT approaches are still robust against hidden population stratification, but their power can be heavily affected since the estimated weights might provide poor approximation of the true theoretical optimal weights with the presence of population stratification. We introduce a permutation-based approach FBAT-MinP and an equal combination approach FBAT-EW, both of which do not involve the use of estimated weights. Through simulation studies, FBAT-MinP and FBAT-EW are shown to be powerful even in the presence of population stratification, when other approaches may substantially lose their power. An application of these approaches to the Childhood Asthma Management Program (CAMP) study data for testing an association between body mass index and a previously reported candidate SNP is given as an example.
1. Introduction
For a genetic association study, population stratification is present when the population is comprised of several subpopulations, and the allele frequency of interest differs in each subpopulation (Ewens and Spielam, 1995; Risch, 2000; Lander and Schork, 1994; Pritchard and Donnelly, 2001). Although most population stratification occurs when there are multiple races or ethnicities in the study population (Risch et al., 2002), significant population stratification was reported even within an apparently homogeneous North American population of European ancestry (Campbell et al., 2005).
Population stratification is mainly thought to be a concern for case-control studies. Since family-based association studies are robust against population stratification, they are often used to replicate associations found with case-control studies. However family-based tests can lose power in the presence of population stratification (Lewinger and Bull, 2006; He et al., 2008), and it is therefore particularly important to address the impact of population stratification on family-based studies in order to ensure these studies have sufficient power to detect the target genetic association.
For studies with phenotypes measured longitudinally or repeatedly, several family-based association test (FBAT) approaches have been introduced which use population information to enhance the power (Lange et al., 2004; Ding et al., 2009). All these approaches combine univariate tests to construct more powerful global test, by using different estimated weights to approximate the theoretical optimal weights. We evaluate the impact of population stratification on the power of these FBAT approaches and find that these estimated weights may no longer provide an appropriate approximation of the optimal weights in the presence of population stratification. We suggest that equal weights can be used to combine univariate tests to provide an alternative testing approach, which can be robust against population stratification. In addition, by extending the idea of combining tests of multiple markers, we propose a permutation-based approach FBAT-Min P, which is expected to be a more powerful approach than Bonferroni correction.
2. Methods
Suppose there are N families. For simplicity, assume we have parents with one offspring (trios); the results can be easily generalized to other family structures (Rabinowitz and Laird, 2000). We denote the vector containing all m phenotypic observations for each offspring by Ỹi = (Yi1, ..., Yim)T, where Yij is the j-th phenotype for the i-th offspring. The standard biometric model (Falconer, 1997) describing a single phenotype as a function of the genotype is
| (1) |
where αj is the genetic effect for the j-th measurement, and Xi denotes the coding of the marker genotype of the i-th offspring. The vector containing all traits for each offspring can be expressed as T̃i = (Ti1, ..., Tim)T, where Tij is the j-th trait for the i-th offspring. Here Tij is a function of the phenotype Yij for example, or Yij adjusted for covariates (Lunetta, 2000).
For the j-th measurement, the univariate family-based association test (FBAT) statistic (Rabinowitz and Laird, 2000) can be written as
| (2) |
where E(Xi|Pi) and V ar(Xi|Pi) denote the expectation and variance of the marker score computed under the null hypothesis (no genetic association), conditional on the parental genotypes Pi. With large samples, the vector containing all univariate test statistics S̃ = (S1, S2, ..., Sm)T asymptotically follows a multivariate normal distribution under H0 (Lange et al., 2003b). Here is an m-dimensional vector of zeroes and Σ0 is the variance-covariance matrix of those univariate test statistics:
| (3) |
Several approaches have been introduced to utilize the multivariate data efficiently to test for genetic association in family-based studies. Lange et al. (2004) developed the FBAT-PC approach, which is an extension of FBAT for traits that are measured longitudinally or repeatedly over time. Based on generalized principle component analysis, FBAT-PC uses a weighted linear combination of the measurements to construct an overall phenotype with maximal locus-specific heritability. To avoid biasing the significance level of any subsequent tests, Lange and Laird (2003), Lange et al. (2003a) proposed the Conditional Mean Model (CMM) to estimate the optimal weights to use in FBAT-PC. In equation (1), we replace the observed marker score xi by the expected marker score E(Xi|Pi),
| (4) |
Ding et al. (2009) introduced FBAT-PCM as a modification to FBAT-PC with higher power, along with two other approaches: FBAT-LC and FBAT-LCC, which have more power in some circumstances.
Furthermore, all three of these statistics can be expressed as a weighted combination of those univariate tests Sj, with different methods to compute the weights:
| (5) |
| (6) |
| (7) |
where , and VP = V ar(Ỹi|Xi = xi) is the phenotypic residual variance-covariance matrix. Note that is estimated by the conditional mean model (equation 4), and all the weights used in equation (5) to (7) are different approximation of the theoretical optimal weights (Ding et al., 2009). Thus it is important that is a good estimate of the true genetic effect as in equation (1).
Use equal weights to combine univariate statistics: FBAT-EW
The weight vectors for FBAT-LC, FBAT-LCC and FBAT-PCM are all estimated by the conditional mean model. Although the CMM will not bias any subsequent tests, it can introduce noise, especially when there is hidden population substructure. Therefore one intuitive question may arise: do we really gain by estimating those weights via the CMM; what if we simply use some constants as our weights?
Without any previous information, the natural way of choosing the constants is to let the weights be all equal. In other words, instead of using estimates like q̃, and in equations (5)–(7), we just assign the weight vector to be (a vector of ones) and name the statistic as FBAT-EW,
| (8) |
Note that this is the same as taking the summation of each individual test Sj as the test statistic and normalizing by its standard error. Under the alternative, those weights for FBAT-LC, FBAT-LCC and FBAT-PCM should be positively correlated with S̃ (Ding et al., 2009), intuitively because α̃ is positively correlated with S̃. Here since the weights are chosen to be vector of ones, we can no longer guarantee a positive correlation between the weights and the univariate tests, thus FBAT-EW is a two-sided test.
Assuming that all the underlying genetic effects are equal, i.e., α1 = α2 = . . . = αm and the phenotypic residual variance matrix VP is compound symmetry, the optimal weights to combine univariate tests can be easily shown to be approximately proportional to . Therefore, when the true genetic effects for different measurement points are nearly equal, and the variance-covariance matrix is close to compound symmetry, FBAT-EW is expected to work well. When using equal weights, we can avoid the possible non-robustness of estimating the weights via the conditional mean model. But at the same time, we make the assumption of equal genetic effects and a compound symmetry variance-covariance matrix, which may or may not be appropriate, depending upon the underlying model. Furthermore, FBAT-EW may not be appropriate when the correlation among traits is negative.
Permutation test based on univariate statistics: FBAT-Min P
For the univariate test statistic Sj in equation (1), we can standardize it as
| (9) |
Letting C0 be the correlation matrix corresponding to the variance-covariance matrix Σ0, it is easy to show that Z̃ = (Z1, Z2, ..., Zm)T asymptotically follows multivariate normal distribution, , under the null hypothesis.
In order to get a one degree of freedom test and gain more power than Bonferroni correction, we define our statistic as the most significant univariate test (whose p-value is the minimum):
| (10) |
Though the distribution of ZFBAT–MinP under the null hypothesis is theoretically difficult to derive, the corresponding p-value can be easily obtained via Monte Carlo permutation. First, we generate K (a sufficiently large number) random m-dimensional vectors Ũ1, ..., ŨK that follow a multivariate normal distribution . Second, for each vector Ũk, k = 1, ..., K, we find the maximum absolute value of its m elements and record it as . Therefore, the set is a random sample from the distribution of the standardized test statistic with the minimum univariate p-value. Last, we determine how many are actually bigger or equal to ZFBAT–MinP, and then divide the number by K to get the empirical p-value:
| (11) |
3. Simulation
In our simulations, the marker of interest is a bi-allelic locus. Assuming an additive genetic model, the parental genotypes P1 and P2 are generated by drawing from a binomial distribution B(2,p) where p is the minor allele frequency (MAF) of the target allele in the population. The genotype X of the offspring is obtained by simulated Mendelian transmission based on the parental genotypes P1 and P2. For each offspring, the same type of phenotype is measured 6 times. The 6-dimensional phenotypic vector is a random sample from a multivariate normal distribution
| (12) |
where VP is the phenotypic variance-covariance matrix, is the phenotypic mean and α1, . . ., α6 are the genetic effects for measurement 1 to 6, respectively.
The simulation is repeated 10,000 times, in each replicate, 400 trios are generated for analysis. The power of each approach is estimated by the proportion of the number of times when the test statistic is significant at α level=0.05 (alpha level=0.01 and 0.001 are also studied, and the results are very similar). We only report results for MAF p=0.2, as results for other values are very similar. Since the power of a statistical test heavily depends upon the true underlying model, we perform our simulations under several different models for the genetic effects α1, . . ., α6. In all the models, the variances at each measurement are set to , i = 1, . . ., 6, while the correlation matrix CP is compound symmetry with various correlation values. In other words, , where ρ is the correlation among different measurements for the same subject. Therefore, we have
Other correlation structures taken from some actual data set have also been used but are not reported in this paper since the results are quite similar to the compound symmetry model.
Model 1: no genetic effect at any measurement point
Under the null hypothesis, there is no genetic association at all (i.e. the genetic effect is zero for any of the six measurement points), so the phenotypes are generated from αi = 0, i = 1, . . ., 6.
Model 2: same genetic effects across all measurement points
In this model, we assume that αi = αh, i = 1, . . ., 6, where αh is the genetic effect size that corresponds to the heritability h2 (Falconer, 1997), i.e., for an additive genetic model. In model 2 and model 3, h2 is always set to be 0.01.
Model 3: arbitrary effects for different measurement points
Here the values of α1, . . ., α6 are given by
| (13) |
where U is the uniform distribution on the interval. Since the mean of the uniform distribution is αh, the average genetic effect here is also αh, with the average univariate heritability equal to 0.01.
Consideration of population stratification
In order to study the influence of population stratification on the power of these approaches, we modify our simulations to include possible population substructure. Instead of choosing all 400 trios from the same population of MAF p=0.2 and in equation (12), now we select 200 trios from subpopulation 1 and 200 trios from subpopulation 2 (p1 = 0.1, in subpopulation 1 and p2 = 0.3, in subpopulation 2).
For model 1, 2 and 3, we consider two extreme cases of possible population substructure: β1 = –αh, β2 = +αh for case 1, β1 = +αh, β2 = –αh and for case 2. For the first case, the correlation between phenotypic means and MAF of the two subpopulations is positive, which means the false positive results caused by population stratification are in the same direction as the true genetic effects. On the contrary, in case 2, the correlation is negative and the false signals caused by population stratification tend to cancel out the true genetic effects.
4. Results
Regardless of population stratification, the type-I error rates of FBAT-PCM, FBAT-LC and FBAT-LCC are all well maintained (Ding et al., 2009). For various values of the correlation ρ, the type-I error rates of FBAT-EW and FBAT-Min P under the null (model 1) are also well maintained (Table 1).
Table 1:
Type-I error rates of FBAT-EW and FBAT-Min P under the null
|
without any population stratification | ||||
| Correlation | 0 | 0.1 | 0.6 | 0.9 |
| FBAT-EW | 0.050 | 0.050 | 0.052 | 0.049 |
| FBAT-Min P | 0.052 | 0.049 | 0.048 | 0.049 |
|
positive population stratification (case 1) | ||||
| Correlation | 0 | 0.1 | 0.6 | 0.9 |
| FBAT-PCM | 0.048 | 0.047 | 0.054 | 0.050 |
| FBAT-LC | 0.049 | 0.047 | 0.052 | 0.052 |
| FBAT-LCC | 0.048 | 0.049 | 0.052 | 0.050 |
| FBAT-EW | 0.049 | 0.049 | 0.053 | 0.051 |
| FBAT-Min P | 0.050 | 0.043 | 0.048 | 0.052 |
|
negative population stratification (case 2) | ||||
| Correlation | 0 | 0.1 | 0.6 | 0.9 |
| FBAT-PCM | 0.048 | 0.050 | 0.051 | 0.046 |
| FBAT-LC | 0.049 | 0.046 | 0.050 | 0.043 |
| FBAT-LCC | 0.049 | 0.048 | 0.051 | 0.047 |
| FBAT-EW | 0.050 | 0.046 | 0.051 | 0.052 |
| FBAT-Min P | 0.048 | 0.047 | 0.054 | 0.052 |
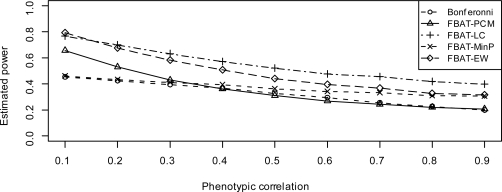
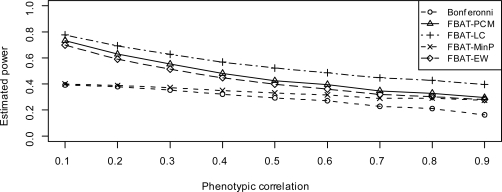
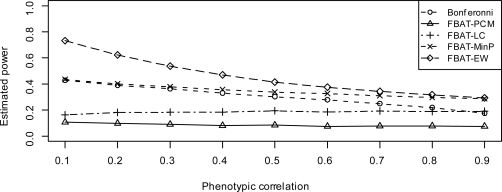
When there is no population stratification, Figure 1 and 4 show the estimated power of FBAT approaches, under models 2 and 3, respectively. When the variances are same, FBAT-LCC and FBAT-PCM are very similar to each other (Ding et al., 2009), so for simplicity we do not show FBATLCC. From these two figures, we see that FBAT-Min P always has higher power than Bonferroni correction, under either model 2 or model 3. Furthermore, since FBAT-Min P takes the correlation among traits into account, its power gain over Bonferroni correction increases when the correlation ρ increases. As for FBAT-EW, when the genetic effect sizes are all equal (model 2), it is more powerful than FBAT-PCM, FBAT-Min P and Bonferroni correction. FBAT-EW performs only slightly worse than FBAT-LC, which is basically due to the fact that FBAT-EW is a two-sided test, while FBAT-LC is one-sided. On the other hand, when the genetic effect sizes differ substantially (model 3), FBAT-EW is no longer a very powerful approach, especially when the correlation among traits is high.
Figure 1:
Estimated power when genetic effect sizes are same (model 2) and there is no population stratification
Figure 4:
Estimated power when genetic effects uniformly distribute (model 3) and there is no population stratification
We find that population substructure can affect the power of these approaches in either direction. In other words, population substructure can either increase (positive population stratification, i.e., case 1) or decrease (case 2 for negative stratification) the power, depending upon whether the false positive results caused by population substructure are in the same direction as the true genetic effects and which FBAT approach is used. In case 1, the hidden population substructure tends to increase the power of those weighted FBAT approaches, but not some other FBAT approaches such as FBAT-EW and FBAT-MinP. In case 2, the hidden population substructure is expected to reduce the power of all FBAT approaches. In addition, case 2 is the worst situation whereby population substructure can weaken the signal of the true genetic association. Therefore, we focus on case 2 to compare the power of these FBAT approaches under the worst case of hidden population substructure.
Figure 2 and 5 show the estimated power of these approaches under model 2 and model 3, respectively, when positive population stratification (case 1) exists.
Figure 2:
Estimated power when genetic effect sizes are same (model 2), under positive population stratification
Figure 5:
Estimated power when genetic effects uniformly distribute (model 3), under positive population stratification
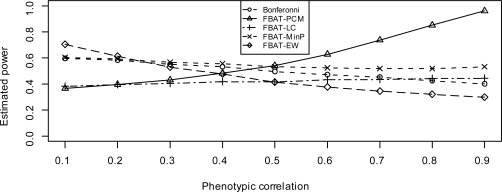
By comparing Figure 2 to Figure 1, as well as Figure 5 to Figure 4, we find that the positive population stratification can slightly improve the power of FBAT-PCM and FBAT-LC, especially under model 2. Since the false positive results caused by population substructure are in the same direction as true genetic effect, they tends to enhance the overall signal detected by the weighted FBAT approaches, i.e., FBAT-PCM and FBAT-LC. On the other hand, positive population stratification slightly reduce the power of FBAT-EW and FBAT-MinP. This is because those univariate FBAT statistics may slightly lose power due to positive population stratification.
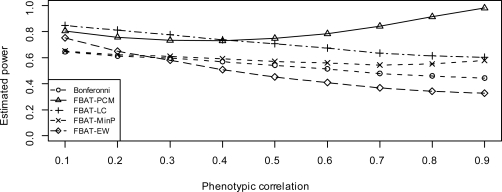
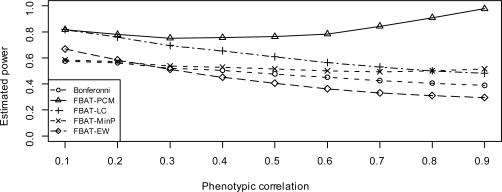
Figure 3 and 6 show the estimated power of these approaches under model 2 and model 3, respectively, when negative population stratification (case 2) exists.
Figure 3:
Estimated power when genetic effect sizes are same (model 2), under negative population stratification
Figure 6:
Estimated power when genetic effects uniformly distribute (model 3), under negative population stratification
By comparing Figure 3 to Figure 1, as well as Figure 6 to Figure 4, we find that the impact on the power of FBAT-PCM and FBAT-LC is substantial. This is due to the fact that both FBAT-PCM and FBAT-LC use the conditional mean model, which might provide poor approximation (or even approximation in the wrong direction) of the true underlying genetic effects with the presence of population stratification. An exception is that FBATPCM consistently does well for very high values of ρ when the genetic effect sizes are different (model 3). As expected, the impact of population stratification on FBAT-Min P and FBAT-EW is very limited, since neither approach involves the use of the conditional mean model. FBAT-Min P remains a powerful test with the presence of population stratification, and still holds a noticeable gain of power compared to Bonferroni correction. FBAT-EW has the highest power among all the approaches when the genetic effect sizes are all equal, or the correlation ρ is very low.
When the conditional mean model fails to approximate the true genetic model well, the FBAT approaches which use the conditional mean model may lose power since their weights are no longer good estimates of the unknown optimal weights. Theoretically, it is possible to adjust the conditional mean model for population substructure with approaches such as Eigen-strat (Price et al., 2006), suggesting that all the FBAT approaches involving the conditional mean model can maintain their power even when population substructure exists. However, in evaluating the impact of population substructure, remember that we considered a ‘worst possible case’, where the correlation between allele frequency and mean phenotype worked to negate the true phenotype-genotype association in the population. A correlation in the opposite direction would increase power. In practice, it will be difficult to predict the sign and extent of any correlation between marker allele frequencies and traits.
5. Data analysis
We test for the association between SNP rs7566605 and 15 longitudinal measures of BMI over 48 months for 212 parent-child trios from the Childhood Asthma Management Program (CAMP) study. SNP rs7566605 is located on chromosome 2q14.2 near the INSIG2 gene and has been reported to be associated with obesity in several populations (Herbert et al., 2006; Lyon et al., 2007).
Fulker et al. (1999) suggested that the genetic effect of a quantitative trait could be decomposed into between-family (b) and within-family (w) components. For family-based trio data, the model can be written as
| (14) |
where αbj and αwj are the between-family and within-family genetic effect sizes, respectively. Note that if there is no population stratification, α̂bj and α̂wj are both expected to be unbiased estimates of the true underline genetic effect, therefore the model reduces to equation (1). Furthermore, fitting the conditional mean model should give estimates nearly equivalent to α̂bj, since E(X) and X-E(X) are orthogonal in expectation (i.e. E{Cov (E(X|P), X – E(X|P))} = 0) [Faloner 1997], assuming an unselected sample). However, when sampling from a stratified population, even though α̂wj will remains unbiased, α̂bj may be biased. As shown in Table 3, between-family estimates α̂bj and within-family estimates α̂wj not only differ greatly in the values, but also hold opposite signs. In other words, the conditional mean model is no longer a reasonable approximate of the true genetic effects.
Table 3:
Estimators of genetic effect at each time point, based on Fulker model
| Model | Between-family α̂b | components s:e: (α̂b) | Within-family α̂w | components s:e: (α̂w) |
|---|---|---|---|---|
| BMI-PRE | −0.63 | 0.94 | 3.15 | 0.92 |
| BMI-RZ | −0.43 | 0.96 | 2.98 | 0.94 |
| BMI-M2 | −0.40 | 0.98 | 3.15 | 0.95 |
| BMI-M4 | −0.43 | 0.99 | 3.08 | 0.96 |
| BMI-M8 | −0.45 | 1.04 | 2.88 | 1.02 |
| BMI-M12 | −0.47 | 1.06 | 2.89 | 1.03 |
| BMI-M16 | −0.14 | 1.08 | 2.81 | 1.05 |
| BMI-M20 | −0.25 | 1.12 | 3.01 | 1.09 |
| BMI-M24 | −0.18 | 1.15 | 3.09 | 1.12 |
| BMI-M28 | −0.17 | 1.15 | 2.80 | 1.12 |
| BMI-M32 | −0.11 | 1.19 | 2.90 | 1.16 |
| BMI-M36 | −0.19 | 1.20 | 2.76 | 1.17 |
| BMI-M40 | −0.29 | 1.25 | 2.69 | 1.21 |
| BMI-M44 | −0.27 | 1.30 | 2.47 | 1.27 |
| BMI-M48 | −0.76 | 1.30 | 2.39 | 1.26 |
Here BMI-PRE is BMI measured at two months before the randomization, BMI-RZ means BMI measured at randomization, and BMI-M2, M4, . . . represent BMI measured at 2, 4,. . . months of follow up.
For these data, FBAT-PC, FBAT-PCM, FBAT-LC and FBAT-LCC all fail to detect the overall genetic association, while FBAT-Min P and FBAT-EW give significant results. The computation of both FBAT-Min P and FBATEW does not involve the conditional mean model at all, while all the other approaches use it. Therefore, when hidden population substructure is a concern, weighted FBAT approaches such as FBAT-PCM, FBAT-LC and FBATLCC may lose their power to detect an existing association, while our new approach FBAT-EW and FBAT-Min P give significant results.
6. Discussion
In this paper, we evaluate the impact of population stratification on the family-based association studies. Because of the robustness of univariate FBAT statistic against population stratification, the false positive rates are always well maintained for the longitudinal setting. But the power of FBAT approaches to detect true genetic association can be either increased or decreased by the existing population stratification in the study samples, depending upon the direction of the population stratification bias. For several FBAT approaches previously introduced to enhance the power of family-based studies with longitudinal phenotypes, we show that they can lose their power substantially when negative population stratification tends to cancel out the true signal of genetic effects. Here we introduce a permutation-based test FBAT-Min P and an equally weighted combination test FBAT-EW, both of which remain to be powerful approaches when population stratification is present.
As shown in the simulations and the analysis of the CAMP data, both FBAT-EW and FBAT-Min P do not need to fit the conditional mean model and are robust against hidden population substructure, so they are very good approaches to start with, regardless of whether there is a concern of population stratification. Furthermore, if we expect the genetic effects for different measurement points to be about the same, FBAT-EW is always a simple and powerful test. When the genetic effect size differs substantially, FBAT-PCM is very powerful when the correlation among traits is high, regardless of the presence or absence of hidden population stratification under our setting.
The computation of all these FBAT approaches is straightforward once you have all the univariate FBAT test statistics. In addition, univariate FBAT, FBAT-LC and FBAT-Min P have been implemented in the software package FBAT and is freely available at http://www.biostat.harvard.edu/∼fbat/default.html; FBAT-PC and FBAT-PCM have been implemented in the software package PBAT and is freely available at http://www.biostat.harvard.edu/∼clange/default.html.
Table 2:
Summary of the power of FBAT-EW and FBAT-Min P
| without any population stratification | with positive population stratification | with negative population stratification | |
|---|---|---|---|
| FBAT EW | has good power when αj are all equal; but not very powerful when αj are different unless the correlation is low | its power is only slightly affected; has good power when αj are all equal, but outperformed by FBAT-PCM and FBAT-LC | its power is only slightly affected; the most powerful approach when either αj are all equal or ρ is low |
| FBAT Min P | generally a powerful approach, especially when effects αj vary; has noticeable power gain over Bonferroni correction, especially when ρ is high | its power is only slightly affected; outperformed by FBAT-PCM and FBAT-LC | its power is only slightly affected; remain powerful under all situations |
Table 4:
Testing for association between rs7566605 and BMI in CAMP data
| P-value | |
|---|---|
| FBAT-PCM | 0.58 |
| FBAT-LC | 0.99 |
| FBAT-LCC | 0.73 |
| Bonferroni correction | 0.14 |
| FBAT-EW | 0.028 |
| FBAT-Min P | 0.022 |
Acknowledgments
We thank all subjects for their ongoing participation in this study. We acknowledge the CAMP investigators and research team, supported by the National Heart, Lung, and Blood Institute (NHLBI), for collection of CAMP Genetic Ancillary Study data. The CAMP Genetics Ancillary Study is supported by the NHLBI, N01-HR-16049. Additional support for this research came from grants P50 HL67664 and T32 HL07427 from the National Institutes of Health and the NHLBI. All work on data from the CAMP Genetics Ancillary Study was conducted at the Channing Laboratory and the Brigham and Women’s Hospital under appropriate CAMP policies and human subject’s protections. This study was supported by the National Institutes of Health (NIH) grants GM 029745 and MH 05932.
References
- The Childhood Asthma Management Program Research Group. The Childhood Asthma Management Program (CAMP): design, rationale, and methods. Controlled Clinical Trials. 1999;20(1):91–120. [PubMed] [Google Scholar]
- The Childhood Asthma Management Program Research Group. Long-term effects of budesonide or nedocromil in children with asthma. The New England journal of medicine. 2000;343(15):1054–63. doi: 10.1056/NEJM200010123431501. [DOI] [PubMed] [Google Scholar]
- Campbell C, Ogbrun E, Lunetta K, Lyon H, Freedman M, Groop L, Altshuler D, Ardlie K, Hirschhorn J. Demonstrating stratification in a European American population. Natural Genetics. 2005;37(8):868–872. doi: 10.1038/ng1607. [DOI] [PubMed] [Google Scholar]
- Ding X, Lange C, Xu X, Laird N. New powerful approaches for family-based association tests with longitudinal measurements. Annals of Human Genetics. 2009;73:74–83. doi: 10.1111/j.1469-1809.2008.00481.x. [DOI] [PubMed] [Google Scholar]
- Ewens W, Spielman S. The Transmission/Disequilibrium Test: History, Subdivision and Admixture. American Journal of Human Genetics. 1995;57:455–464. [PMC free article] [PubMed] [Google Scholar]
- Falconer D, Macky T. Introduction to quantitative genetics. Longman 1997 [Google Scholar]
- Fulker D, Cherny S, Sham P, Hewitt J. Combined linkage and association analysis for quantitative traits. American Journal of Human Genetics. 1999;64:259–267. doi: 10.1086/302193. [DOI] [PMC free article] [PubMed] [Google Scholar]
- He Y, Jiang R, Bergen A, Swan G, Jin L. Correlation of Population Parameters leading to Power Differences in Association Studies with Population Stratification. Annals of Human Genetics. 2008;72:801–811. doi: 10.1111/j.1469-1809.2008.00465.x. [DOI] [PMC free article] [PubMed] [Google Scholar]
- Herbert A, Gerry N, McQueen M, Heid I, Pfeufer A, Illig T, Wichmann H, Meitinger T, Hunter D, Hu F, Colditz G, Hinney A, Hebebrand J, Koberwitz K, Zhu X, Cooper R, Ardlie K, Lyon H, Hirschhorn J, Laird N, Lenburg M, Lange C, Christman M. A common genetic variant is associated with adult and childhood obesity. Science. 2006;312:279–283. doi: 10.1126/science.1124779. [DOI] [PubMed] [Google Scholar]
- Laird N, Lange C. Family-Based designs in the age of lange-scale gene-association studies. Nature Reviews/Genetics. 2006;7:385–394. doi: 10.1038/nrg1839. [DOI] [PubMed] [Google Scholar]
- Lander E, Schok N. Genetic dissection of complex traits. Science. 1994;265:2037–2048. doi: 10.1126/science.8091226. [DOI] [PubMed] [Google Scholar]
- Lange C, Laird N. On a general class of conditional tests for family-based association studies in genetics: The asymptotic distribution, the conditional Power, and optimality considerations. Genetic Epidemiology. 2002;23:165–180. doi: 10.1002/gepi.209. [DOI] [PubMed] [Google Scholar]
- Lange C, Lyon H, DeMeo D, Raby B, Silverman A, Weiss S. A new powerful non-parametric two-stage approach for testing multiple phenotypes in family-based association studies. Human Heredity. 2003;56:10–17. doi: 10.1159/000073728. [DOI] [PubMed] [Google Scholar]
- Lange C, Silverman E, Xu X, Weiss S, Laird N. A multivariate family-based association test using generalized estimating equations: FBAT-GEE. Biostatistics. 2003;4:195–206. doi: 10.1093/biostatistics/4.2.195. [DOI] [PubMed] [Google Scholar]
- Lange C, Laird N. Analytical sample size and power calculations for a general class of family-based association tests: Dichotomous traits. American Journal of Human Genetics. 2003;23:165–180. doi: 10.1086/342406. [DOI] [PMC free article] [PubMed] [Google Scholar]
- Lange C, Andrew T, MacGregor A, Lyon H, Raby B, DeMeo D, Murphy A, Silverman A, Weiss S, Laird N.2004A family-based association test for repeatedly measured quantitative traits adjusting for unknown environmental and/or polygenic effects Statistical Applications in Genetics and Molecular Biology 3Article 17. 10.2202/1544-6115.1067 [DOI] [PubMed] [Google Scholar]
- Lewinger J, Bull S. Validity, Efficiency, and Robustness of Family-Based Test of Association. Genetic Epidemiology. 2006;30:62–76. doi: 10.1002/gepi.20125. [DOI] [PubMed] [Google Scholar]
- Lunetta K, Farove S, Biederman J, Laird N. Family-based tests of association and linkage using unaffected sibs, covariates and interaction. American Journal of Human Genetics. 2000;66:605–614. doi: 10.1086/302782. [DOI] [PMC free article] [PubMed] [Google Scholar]
- Lyon H, Emilsson V, Hinney A, Heid I, Lasky-Su J, Zhu X, Thorleifsson G, Gunnarsdottir S, Walters G, Thorsteinsdottir U, Kong A, Gulcher J, Nguyen T, Scherag A, Pfeufer A, Meitinger T, Bronner G, Rief W, Soto-Quiros M, Avila L, Klanderman B, Raby B, Silverman E, Weiss S, Laird N, Ding X, Groop L, Tuomi T, Isomaa B, Bengtsson K, Butler J, Cooper R, Fox C, O’Donnell C, Vollmert C, Celedon J, Wichmann H, Hebebrand J, Stefansson K, Lange C, Hirschhorn J. The association of a SNP upstream of INSIG2 with Body Mass Index is reproduced in several but not all cohorts. PLoS Genetics. 2007;3(4) doi: 10.1371/journal.pgen.0030061. [DOI] [PMC free article] [PubMed] [Google Scholar]
- Price A, Patterson N, Plenge R, Weinblatt M, Shadick N, Reich D. Principal components analysis corrects for stratification in genome-wide association studies. Nature Genetics. 2006;38(8):904–9. doi: 10.1038/ng1847. [DOI] [PubMed] [Google Scholar]
- Pritchard J, Donnelly P. Case-Control studies of association in structured or admixed population. Theoretical Population Biology. 2001;60:227–237. doi: 10.1006/tpbi.2001.1543. [DOI] [PubMed] [Google Scholar]
- Rabinowitz D, Laird N. A unified approach to adjusting association tests for population admixture with arbitrary pedigree structure and arbitrary missing marker information. Human Heredity. 2000;50:211–223. doi: 10.1159/000022918. [DOI] [PubMed] [Google Scholar]
- Risch N. Searching for genetic determinants in the new millennium. Nature. 2000;405:847–856. doi: 10.1038/35015718. [DOI] [PubMed] [Google Scholar]
- Risch N, Burchard E, Ziv E, Tang H. Categorization of humans in biomedical research: genes, race and disease. Genome Biology. 2002 Jul 1;3(7) doi: 10.1186/gb-2002-3-7-comment2007. [DOI] [PMC free article] [PubMed] [Google Scholar]


