

Abstract
Spatial patterns of brain atrophy in mild cognitive impairment (MCI) and Alzheimer’s disease (AD) were measured via methods of computational neuroanatomy. These patterns were spatially complex and involved many brain regions. In addition to the hippocampus and the medial temporal lobe gray matter, a number of other regions displayed significant atrophy, including orbitofrontal and medial-prefrontal grey matter, cingulate (mainly posterior), insula, uncus, and temporal lobe white matter. Approximately 2/3 of the MCI group presented patterns of atrophy that overlapped with AD, whereas the remaining 1/3 overlapped with cognitively normal individuals, thereby indicating that some, but not all, MCI patients have significant and extensive brain atrophy in this cohort of MCI patients. Importantly, the group with AD-like patterns presented much higher rate of MMSE decline in follow-up visits; conversely, pattern classification provided relatively high classification accuracy (87%) of the individuals that presented relatively higher MMSE decline within a year from baseline. High-dimensional pattern classification, a nonlinear multivariate analysis, provided measures of structural abnormality that can potentially be useful for individual patient classification, as well as for predicting progression and examining multivariate relationships in group analyses.
Keywords: Alzheimer’s disease, early detection, mild cognitive impairment, MCI, pattern classification, structural MRI
Introduction
Alzheimer’s disease (AD) is the most common dementia, with incidence rates doubling every five years after the age of 65. It is estimated that half of the population above 80 years may have symptomatic AD, and that this number will grow rapidly as life expectancy increases, and as the baby boomers’ generation moves into the high risk age group. The psychological and financial cost of AD is tremendous and rapidly rising. Although there is currently no disease-modifying treatment, many potential treatments are being tested, some of which may have significant side-effects. It is therefore becoming clear that effective and well-targeted treatment necessitates early diagnosis of the disease.
Currently, definitive diagnosis of AD can be made if an autopsy documents the presence of the characteristic neuritic β-amyloid plaques and neurofibrilatory tangles in the appropriate brain regions in an individual with a history of progressive dementia. Therefore, there has been a keen interest in the neuroimaging community to develop imaging-based biomarkers, especially of early AD stages (Braak et al., 1998), as well as for predicting individuals that are likely to progress to AD and are therefore good candidates for therapy. Magnetic resonance imaging (MRI) can potentially play an important role as diagnostic tool, mainly because it is widely available and part of the American Academy of Neurology standard clinical evaluation for individuals with symptoms of dementia. MRI helps measure spatial patterns of atrophy, and their evolution with disease progressions, which are surrogate markers of the underlying neurodegenerative AD pathology.
The neuroimaging literature is rich in studies measuring volumes of regions of interest (ROIs) known to be affected by AD, especially of the hippocampus and the entorhinal cortex (Kaye et al., 1997; Jack et al., 1999; Convit et al., 2000; Killiany et al., 2000; Dickerson et al., 2001; Chetelat et al., 2002; Visser et al., 2002; Stoub et al., 2005; De Leon et al., 2006); more complex shape properties of hippocampal ROI’s have also been investigated (Csernansky et al., 2005). However, the pattern of AD pathology is complex and evolves as the disease progresses, starting mainly in the hippocampus and entorhinal cortex, and subsequently spreading throughout most of the temporal lobe and the posterior cingulate, finally involving extensive cortical regions, especially parietal, prefrontal and orbitofrontal. Therefore, measuring volumes of a few structures cannot capture the spatio-temporal pattern of brain atrophy in its entirety. Moreover, measurements of hand-drawn ROIs are not easily reproducible within and across different raters. Finally, the pattern of atrophy associated with AD does not necessarily follow predetermined anatomical boundaries.
During the past decade, methods of computational neuroanatomy, such as voxel-based and deformation-based analysis, have gained attention in the neuroimaging community (Davatzikos et al., 2001; Thompson et al., 2001; Chetelat et al., 2002; Ashburner et al., 2003; Karas et al., 2004; Pennanen et al., 2005; Bozzali et al., 2006; Saykin et al., 2006; Xie et al., 2006; Whitwell et al., 2007), because they allow for the complete evaluation of structural and functional brain images, without the need to make a priori assumptions about the size, extent, and number of regions to be measured. Instead, these methods apply voxel-by-voxel evaluation of the images, and identify potentially complex spatial patterns of brain atrophy.
In addition to voxel-based analysis methods, techniques for high-dimensional pattern classification have begun to find their way to the literature of neuroimaging of AD (Lao et al., 2003; Lao et al., 2004; Liu et al., 2004; Adeli et al., 2005; Tandon et al., 2006; Li et al., 2007), aiming to provide computational tools that classify individuals, based on their MRI or PET scans, rather than determining statistical group differences. The current study builds upon previous work in (Davatzikos et al., in press, 2006), which used a limited sample of patients with MCI and cognitively healthy individuals to construct classifiers that separate the two groups. The current study, however, emphasizes 1) application to a larger sample from the ADNI study; 2) inclusion of AD patients, in addition to healthy and MCI individuals; 3) a different methodological design, in which structural differences between healthy individuals and AD patients are used to construct a high-dimensional classifier, which is subsequently applied to MCI patients, rather than emphasizing differences between MCI and controls. This approach allows us to determine MCI subgroups that have structural profiles similar to AD or to healthy individuals. Most importantly, it allowed us to further associate these structural profiles with Mini Mental State Examination (MMSE) scores and their 1-year change in follow-up examinations, and demonstrate their prognostic value, an issue of very high importance currently in the AD literature.
In particular, the current study pursues a voxel-based morphometric analysis of cognitively normal individuals, individuals with MCI, and AD patients, using an atlas warping approach used to generate regional tissue density maps that reflect the regional distribution of brain tissue. The hypothesis was that this approach would allow us to quantitatively capture complex spatial pattern of brain atrophy that can potentially serve as sensitive and specific imaging signatures of MCI and AD. The classification analysis also offers one possible way to classify an entire pattern of atrophy to MCI or cognitively normal individuals (CN), and potentially to predict whether an MCI subject will eventually develop AD, using longitudinal follow-ups.
Materials and Methods
Data used in the preparation of this article were obtained from the Alzheimer’s Disease Neuroimaging Initiative (ADNI) database (www.loni.ucla.edu\ADNI). The goal of ADNI is to recruit 800 adults, ages 55 to 90, to participate in the research -- approximately 200 CN older individuals to be followed for 3 years, 400 people with MCI to be followed for 3 years, and 200 people with early AD to be followed for 2 years. For up-to-date information see www.adni-info.org.
Participants
All ADNI participants with structural MR images available on the ADNI web site as of February 2007 (the latest scan was from December 19, 2006) were part of this analysis. This included 66 CN individuals (mean age ± std. deviation 75.18±5.39), 88 MCI patients (76.38±7.60), and 56 AD patients (77.40±7.02), whose MRI scans were analyzed. The MMSE scores (mean ± std. deviation) of each group at baseline were 29.08±0.97, 26.78±1.91, and 23.07±1.83, respectively. The groups were relatively well-balanced in terms of gender (50%, 36%, 57% women in each of the 3 groups, respectively). MMSE scores from the subset of participants that had completed 3 follow-up exams by the end of this study in June 2007 were also included in the analysis, and used as a measure of disease progression.
Images
The datasets included standard T1-weighted MR images acquired sagittally using volumetric 3D MPRAGE with 1.25 × 1.25 mm in-plane spatial resolution and 1.2 mm thick sagittal slices (8° flip angle). Most of the images were obtained using 1.5 T scanners, while a few were obtained using 3T scanners: 8 CN, 11MCI, and 8 AD patients. Detailed information about MR acquisition procedures is available at the ADNI website.
Image Analysis
Images were first preprocessed according to previously validated and published techniques (Goldszal et al., 1998). The pre-processing steps included 1) alignment to the AC-PC plane; 2) removal of extra-cranial material (skull-stripping); 3)Tissue segmentation into grey matter (GM), white matter (WM), and cerebrospinal fluid (CSF), using a brain tissue segmentation method proposed in (Pham and Prince, 1999); 4) High-dimensional image warping (Shen and Davatzikos, 2002) to a standardized coordinate system, a brain atlas (template) that was aligned with the MNI coordinate space (Kabani et al., 1998); 5) formation regional volumetric maps, named RAVENS maps (Goldszal et al., 1998; Davatzikos et al., 2001; Shen and Davatzikos, 2003), using tissue preserving image warping (Goldszal et al., 1998). RAVENS maps quantify the regional distribution of GM, WM, and CSF, since one RAVENS map is formed for each tissue type. In particular, if the image warping transformation that registers an individual scan with the template applies an expansion to a GM structure, the GM density of the structure decreases accordingly to insure that the total amount of GM is preserved. Conversely, a RAVENS value increases during contraction, if tissue from a relatively larger region is compressed to fit a smaller region in the template. Consequently, RAVENS values in the template’s (stereotaxic) space are directly proportional to the volume of the respective structures in the original brain scan. Therefore, regional volumetric measurements and comparisons are performed via measurements and comparisons of the respective RAVENS maps. For example, patterns of GM atrophy in the temporal lobe are quantified by patterns of RAVENS decrease in the temporal lobe in the stereotaxic space.
The RAVENS approach has been extensively validated (Goldszal et al., 1998; Davatzikos et al., 2001) and applied to a variety of studies (Resnick et al., 2000; Resnick et al., 2001; Kim et al., 2003; Resnick et al., 2003; Resnick et al., 2004; Beresford et al., 2006; Beresford et al., 2006; Gur et al., 2006; Stewart et al., 2006; Driscoll et al., 2007). It bears similarities with the “optimized VBM” approach (Good et al., 2002), except it uses a highly conforming high-dimensional image warping algorithm that captures finer structural details. Moreover, it uses tissue-preserving transformations, which ensures that image warping absolutely preserves the amount of GM, WM and CSF tissue present in an individual’s scan, thereby allowing for local volumetric analysis.
Statistical analysis and pattern classification
Group comparisons were performed via voxel-based statistical analysis of respective RAVENS maps that were normalized by intra-cranial volume and smoothed using 8 mm full-width at half-maximum (FWHM) smoothing kernel. Group comparisons involved voxel-by-voxel t-tests applied by the SPM2 software (http://www.fil.ion.ucl.ac.uk/spm/software/spm2). Comparison for multiple corrections utilized the false discovery rate (FDR) method (Yekutieli and Benjamini, 1999), as implemented in the SPM software. In addition to the group analyses, we perform individual-patient analysis, aiming to classify individual scans belonging to CN, MCI, or AD participants. This analysis is important because it directly relates to our ability to use quantitative MRI analysis for individual diagnosis, rather than to identify statistical differences between two potentially overlapping groups. Toward this end, we applied a high-dimensional pattern classification approach, which has been published and used in various neuroimaging studies (Fan et al., 2005; Fan et al., 2007; Fan et al., 2007, in press; Davatzikos et al., in press, 2006). This approach considers all brain regions jointly, and identifies a minimal set of regions whose volumes jointly maximally differentiate between the two groups under consideration, on an individual scan basis. Leave-one-out cross-validation is used to test this classification scheme on datasets not used for training, and obtain a relatively unbiased estimate of the generalization power of the classifier to new patients. The pattern classification method provides a structural phenotypic score (SPS). For a classifier constructed from the CN and AD groups, positive SPS implies AD-like brain structure, and vice-versa. The classifier that was determined to maximally distinguish between CN and AD participants was subsequently applied to the MCI group.
We also utilized the standard region of interest (ROI) method to analyze the volumes of the hippocampus and the entorhinal cortex via a template warping method that has been previously published and validated (Shen and Davatzikos, 2002; Shen et al., 2002), in order to determine whether conventional ROI measurements are sufficient for classification of individual scans with high sensitivity and specificity.
SPS and rates of MMSE change
Since at this stage of the study, the clinical outcome is not yet available for most of the participants, we evaluated associations between the SPS determined from the MRI and rates of changes of the MMSE scores, which were calculated for those MCI individuals (n=38) that had at least 3 examinations (baseline plus 2 follow-ups, 18 months). These rates of change were computed separately for the two subgroups identified by the pattern classification: the MCI_CN (n=16) and MCI_AD (n=22) subgroups. Conversely, we divided the MCI participants into two groups, the progressors (MCI_PR) and the non-progressors (MCI_NPR). (We stress that strictly speaking, this categorization does not reflect progression to AD, but progression of the MMSE scores towards relatively lower values.) We then evaluated whether the pattern classification approach can separate MCI_PR from MCI_NPR, knowing that this is an extremely difficult task due to the noise that is inherent to the measurement of rate of change of MMSE, especially from 3 measurements within 1 year, but also because short-term MMSE decline does not necessarily imply clinical progression to AD. One of the caveats in this analysis was that it is difficult to define a threshold for MMSE rate of change that would define the subgroups MCI_PR and MCI_NPR. We cannot use a threshold of 0, because we know that even CN individuals display some decline. Therefore, we decided to examine a range of possible thresholds on MMSE rate of change, and test the group separability within that range. The hypothesis was that very low or very high thresholds would lead to non-separable subgroups (since they would lump together progressors and non-progressors into the same class), and somewhere in the small negative range (small rate of MMSE change) we should find maximal separability.
Results
Region of interest Volumetry
The volumes of the hippocampus (left + right) against the entorhinal cortex (left + right), after normalization by intra-cranial volume (ICV), are shown in Figure 1 as a scatter plot. AD and CN are relatively well separated, although classification accuracy would not be clinically sufficient, in terms of providing adequate sensitivity and specificity on an individual patient basis. Volumes of the MCI group completely overlap with both groups, especially the AD group. We also constructed SVM classifiers using these volume measurements. The classification accuracy computed via the leave-one-out cross-validation was 82.0%, 76.0%, and 58.3%, for AD vs. CN, MCI vs. CN, and AD vs. MCI, respectively.
Figure 1.
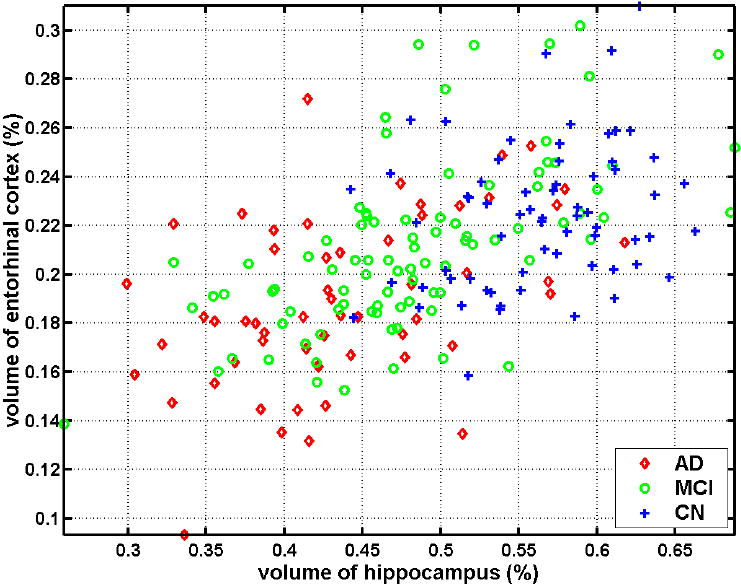
Scatter plot of the volumes of the hippocampus (left + right) against the entorhinal cortex (left + right) of the groups of CN, MCI, and AD, after normalization by ICV.
Voxel-based Analysis of RAVENS maps
Statistically significant results from the CN vs. AD comparisons via voxel-based statistical analysis are shown in Figure 2. These maps display the t-statistic of voxel-wise t-tests, however only the clusters with p-values corrected for multiple comparison above p=0.05 were obtained. SPM2 (FDR multiple comparison correction) was used for all voxel-based analyses. Figure 2 indicates severe GM atrophy in the AD group, and less pronounced WM atrophy mainly located around the hippocampus. Apparent WM atrophy in the anterior periventricular region is due to periventricular leukoareosis that tends to be segmented as GM, due to its darker T1 signal.
Figure 2.
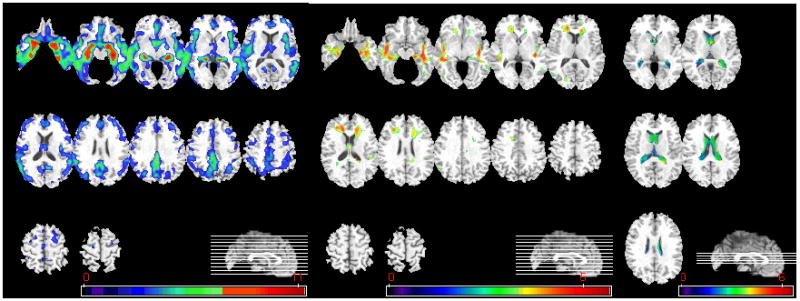
Voxel-based analysis of group difference between CN and AD. From left to right, group comparison results on GM, WM, and CSF are shown. (GM, WM: CN>AD, CSF: AD>CN, p<0.05, corrected). The color-maps indicate the scale for the t-statistic. Images are displayed in radiological convention.
Statistically significant findings from the voxel-based comparisons between the CN and MCI groups are shown in Figure 3. The pattern of atrophy is similar to the one in Figure 2, except less pronounced, as indicated by the values of the t-statistic. No significant WM group differences were found, after correction for multiple comparisons, therefore the WM regions shown were determined without multiple comparison correction at the p<0.001 level.
Figure 3.
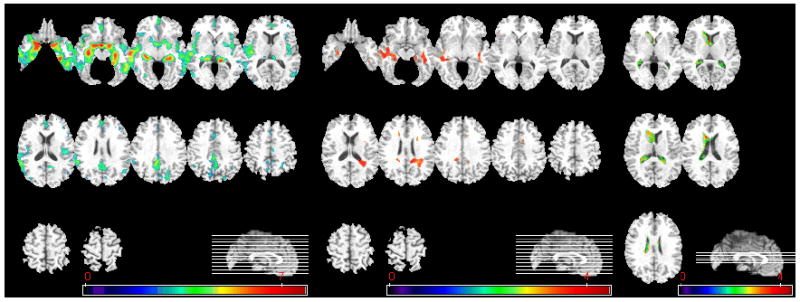
Voxel-based analysis of group difference between CN and MCI. From left to right, group comparison results on GM, WM, and CSF are shown. (GM: CN>MCI, p<0.05, FDR-corrected; CSF: MCI>CN, p<0.05, FDR-corrected; WM:CN>MCI, p<0.001, uncorrected). The color-maps indicate the scale for the t-statistic. Images are displayed in radiological convention.
Figure 4 shows the statistically significant findings from the MCI vs. AD comparison. Even smaller regional volumetric differences were found in this group comparison. Since the differences between MCI and AD were relatively small and almost disappeared after correction for multiple comparisons, Figure 4 also displays the results prior to FDR correction.
Figure 4.
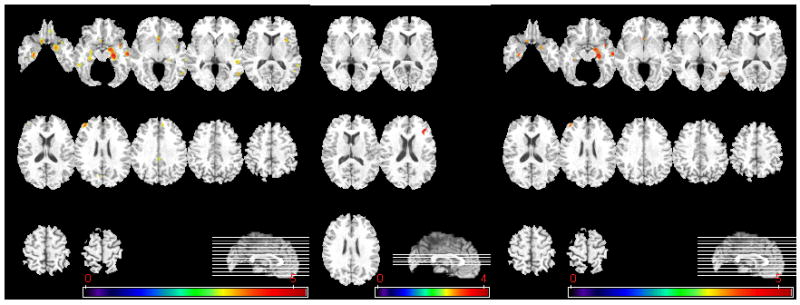
Voxel-based analysis of group difference between MCI and AD. Left column shows GM comparisons, and middle column shows WM comparisons, without correction of multiple comparisons (MCI>AD, p<0.001, uncorrected). After FDR correction (MCI>AD, p<0.05), significant group differences are found only in GM RAVENS maps, as shown in right column. No significant group difference was found on CSF comparisons. The color-maps indicate the scale for the t-statistic. Images are displayed in radiological convention.
Pattern Classification
The pattern classification approach was initially applied separately to each group comparison: 1) AD vs. CN; 2) MCI vs. CN; and 3) AD vs. MCI. The classification accuracy was determined via the leave-one-out (LOO) cross-validation to be 94.3%, 81.8%, and 74.3%, respectively, for the 3 comparisons. Because LOO was applied, these are estimations of classification accuracy of a new individual’s scan and therefore of direct diagnosis relevance. These classifiers’ receiver operating characteristic (ROC) curves are shown in Figure 5 (these ROC curves were determined using LOO). These classifications’ respective AUCs (area under the ROC curve) were 96.5%, 84.6%, and 75.9%.
Figure 5.
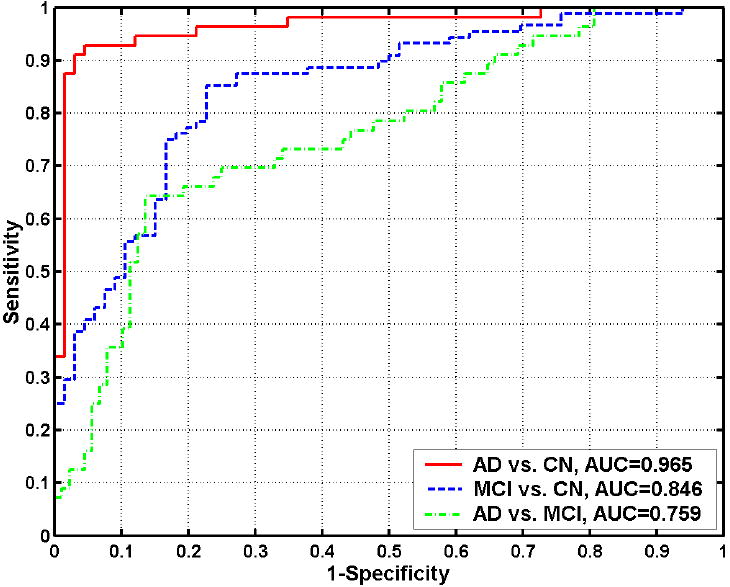
ROC curves showing the overall classification performance in MRI-based classification of AD from CN, MCI from CN, and AD from MCI. Their respective AUCs (area under the ROC curve) are 0.965, 0.846, and 0.759.
Subgrouping of MCI participants and follow-up MMSE scores
In order to further investigate the patterns of brain atrophy in the MCI participants, the classifier built from the AD and CN groups was applied to MCI participants. As described in the Methods section, this classifier provides SPS that is positive for AD-like structure and negative for CN-like structure. Figure 6 shows the distribution of the SPS’s of all MCI participants, further indicating that the majority of the MCI participants displayed AD-like structural profiles. MCI participants were further divided into the ones that had positive SPS (AD-like patterns) and the ones that had negative SPS (CN-like patterns). We refer to these two groups as MCI_AD (57 MCI participants) and MCI_CN (31 MCI participants), respectively. These two subgroups were then compared via voxel-based analysis of their RAVENS maps. Statistically significant regional volumetric differences are shown in Figure 7.
Figure 6.
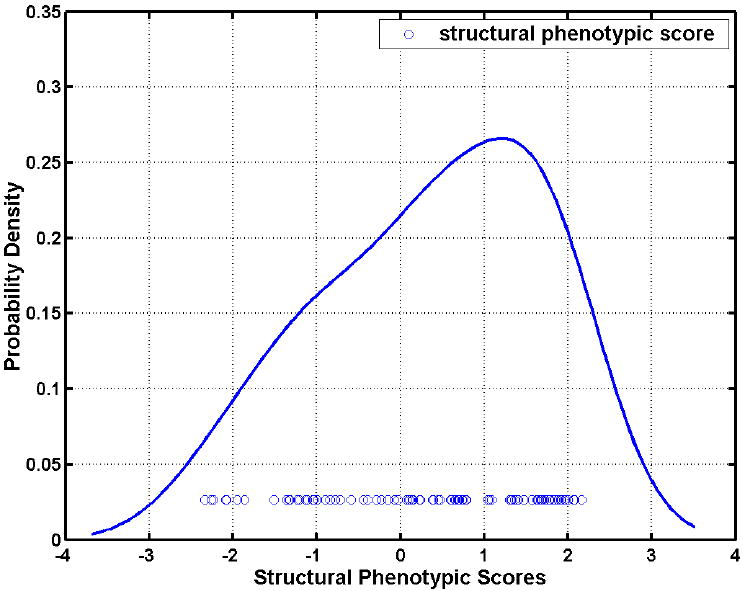
Histograms of the MRI-based classification scores for MCI subjects obtained via applying the classifiers built on AD and CN participants. 57 out of 88 MCI subjects display positive scores, i.e. their MRI scans indicate that they possess the structural pattern characteristic of AD.
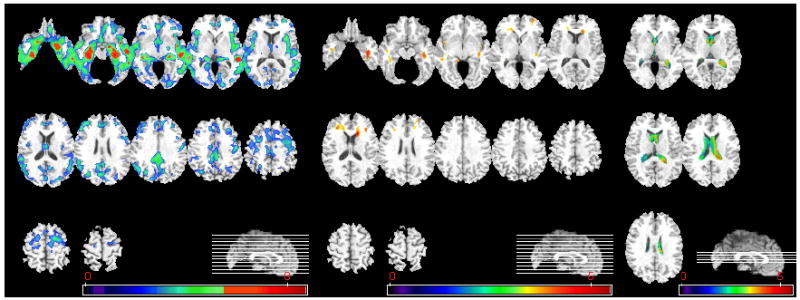
Figure 7.
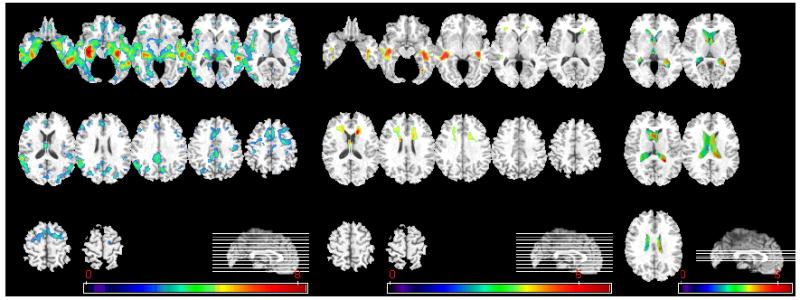
Voxel-based analysis of group differences between MCI_CN and MCI_AD. From left to right, group comparison results on GM, WM, and CSF are shown. (GM, WM: MCI_CN>MCI_AD, CSF: MCI_AD > MCI_CN, p<0.05, corrected). The color-maps indicate the scale for the t-statistic. Images are displayed in radiological convention.
Figure 8 shows the group differences between MCI_AD and CN participants via voxel-based statistical analysis. It is worth noting that the group differences in WM RAVENS maps were even stronger than group differences between AD and CN participants. Figure 9 shows the group differences between MCI_CN and AD participants via voxel-based statistical analysis. The group differences between MCI_CN and AD participants are similar with those between CN and MCI_AD. Almost no significant group differences were found between MCI_CN and CN participants via voxel-based statistical analysis: only a small region in the medial orbitofrontal cortex passed the p=0.05 threshold, after FDR correction for multiple comparisons. Similarly, no group differences between MCI_AD and AD participants reached significance, after FDR correction.
Figure 8.
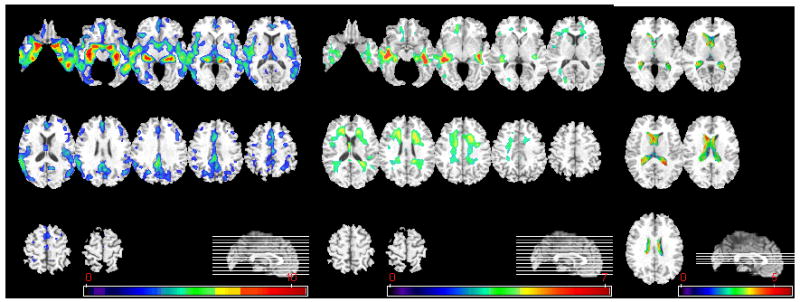
Voxel-based analysis of group difference between CN and MCI_ AD. From left to right, group comparison results on GM, WM, and CSF are shown. (GM, WM: CN>MCI_AD, CSF: MCI_AD>CN, p<0.05, corrected). The color-maps indicate the scale for the t-statistic. Images are displayed in radiological convention.
Figure 9.
Voxel-based analysis of group difference between MCI_CN and AD. From left to right, group comparison results on GM, WM, and CSF are shown. (GM, WM: MCI_CN >AD, CSF: AD> MCI_CN, p<0.05, corrected). The color-maps indicate the scale for the t-statistic. Images are displayed in radiological convention.
SPS and rate of MMSE change
As discussed in Methods, rates of change of the MMSE scores were calculated separately for the two subgroups identified by the pattern classification: the MCI_CN (n=16) and MCI_AD (n=22) subgroups. The rate of MMSE score annual decrease of the former group was significantly smaller than that of the latter group with p value 0.028. The average rate of MMSE score annual decrease (mean ± std. deviation) was -0.30± 3.13 for the former group and -2.31± 3.07 for the latter group. The correlation coefficient between the relationship of the SPS and the rate of MMSE change was -0.39 (p =0.0155). The distributions of the scores during baseline and follow-ups are shown in Figure 10, and a regression plot in Fig. 11.
Figure 10.
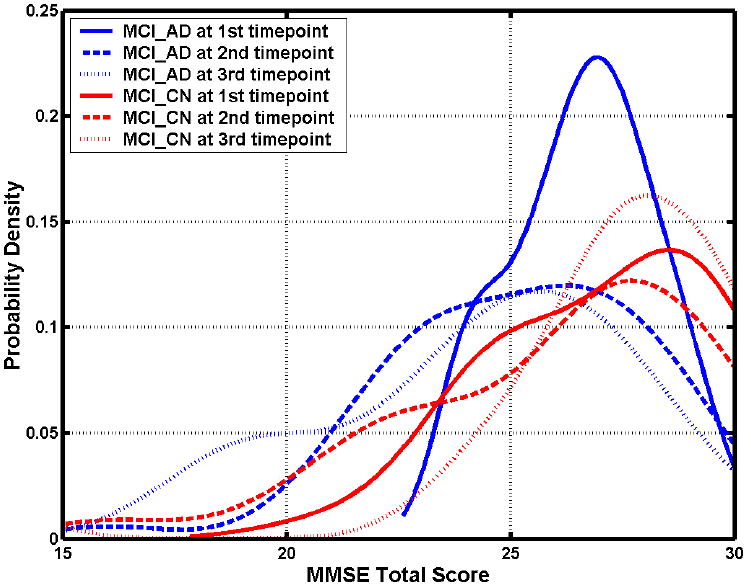
The distributions of the MMSE scores during baseline and follow-ups of MCI subgroups.
Fig. 11.
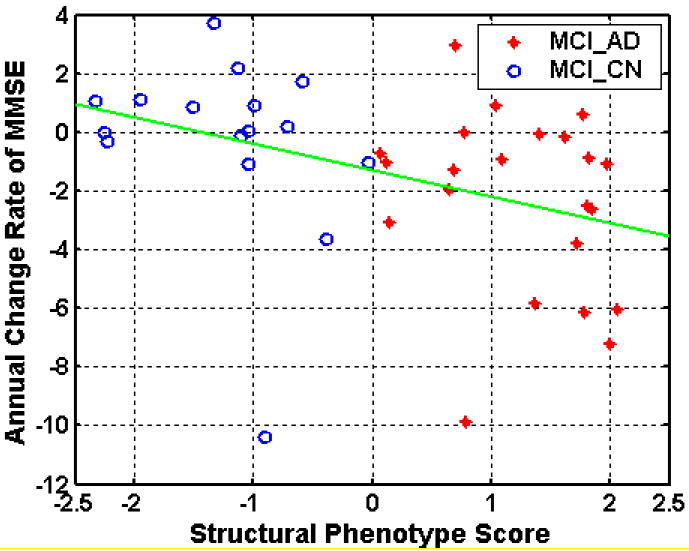
Regression plot of the rates of MMSE change and the SPS scores at baseline.
In Methods, we discussed the categorization of the MCI cohort into progressors and non-progressors: MCI_PR and MCI_NPR, via thresholding their rates of MMSE change at various thresholds. The classification results, after leave-one-out cross-validation, which were obtained from these two subgroups are shown in Fig. 12, for different values of the threshold on MMSE rate of change. These results indicate that maximal separation between MCI_PR and MCI_NPR is obtained for a threshold close to -1, which is in agreement with our expectations. The classification rate obtained at that threshold was 87% and the area under the curve was 0.86.
Fig. 12.
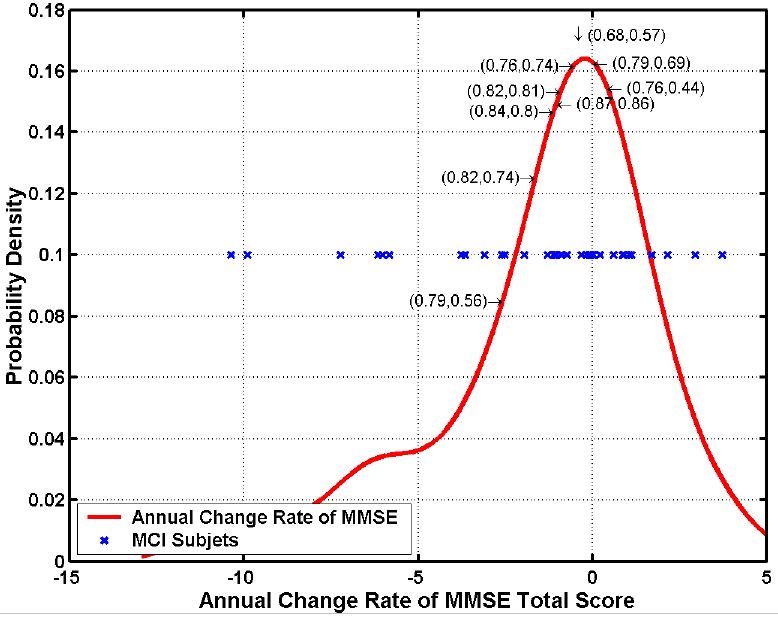
Classification rates and areas under the ROC curve obtained by subgrouping MCI patients into progressors and non-progressors, according to a threshold on their rates of MMSE change within a year. Optimal classification rate of 0.87=87% (AUC 0.86) was obtained for a threshold around -1, i.e. if one defines progressors as the MCI patients that display rates of change of MMSE score < -1/year. This is in agreement with the fact that even CN individuals display some rate of decline. The red curve is a histogram of the rate of MMSE change, the blue stars are individual MCI patients, and the numbers before and after comma within parentheses are the correct classification rates and the AUCs.
Discussions and Conclusion
This study utilized computational neuroanatomic methods to quantify cross-sectional patterns of brain atrophy in a relatively large sample of cognitively normal elderly individuals, and in patients with MCI and AD. Spatially complex spatial patterns of brain atrophy were measured, and were found to be consistent with known patterns of AD pathology from histological studies. MCI patients had significant temporal lobe atrophy, especially in the hippocampus, superior, inferior temporal gyrus, and uncus, as well as medial GM atrophy, especially in the posterior cingulate and adjacent precuneous, and the medial aspect of the uncus. Additional GM atrophy was measured between MCI and AD patients, particularly in the hippocampus, the entorhinal cortex, and the middle and inferior temporal gyrus. The pattern of atrophy also included the WM surrounding the hippocampus, and the ventricles, albeit at much lower significance, compared to GM atrophy.
The complexity of this pattern of atrophy suggests that perhaps more sophisticated methods for measuring structural brain changes in MCI and AD can be helpful for diagnosis and prognosis of the disease, compared to the most common approach that has been taken up to date in the neuroimaging literature (Kaye et al., 1997; Convit et al., 2000; Killiany et al., 2000; Dickerson et al., 2001; Chetelat et al., 2002), namely to examine volumes of a small number of structures typically of the hippocampus and the entorhinal cortex. This is further bolstered by histopathological studies (Braak et al., 1998) that have investigated the pattern of deposition of β-amyloid plaques and tau-pathology during the progression of AD, as well as with studies of magnetization transfer that indicated a more than expected widespread distribution of brain pathology (Van der Flier et al., 2002). The results of the current study also demonstrated that sole measurements of the hippocampus and the entorhinal cortex are not sufficient for separating the three groups from each other, not even AD from CN, with clinically adequate sensitivity and specificity, since hippocampal and entorhinal cortex measurements were highly overlapping between MCI and AD or CN (Fig. 1). Overlap was also observed between AD and CN.
Perhaps the most exciting finding of the current study is that the MCI subgroup identified by the classifier as AD-like showed a markedly faster rate of subsequent MMSE decline, whereas the group that had similar SPS to CN showed minor MMSE decline. Related was the converse finding, namely that MCI individuals whose MMSE scores decreased relatively more rapidly were relatively well distinguishable from the ones that shown no decline or relatively small decline similar to that of CN individuals. This finding indicates that the SPS score determined through pattern analysis and classification has predictive clinical value, which would render it a significant biomarker for early AD stages and for individuals that are good candidates for treatment. Importantly, the SPS scores were derived using a single cross-sectional MRI scan, and not from longitudinal scans, which renders them more practically feasible from a logistical as well as from a financial point of view.
One of the main conclusions of this study is that two thirds of the MCI patients of this cohort are closer to AD than they are to cognitively normal individuals. Although previous MRI-based studies of MCI patients have demonstrated brain atrophy mainly in medial temporal lobe structures (Convit et al., 1997; Jack et al., 1999; Jack et al., 2000; Xu et al., 2000; De Santi et al., 2001; Du et al., 2001; Grundman et al., 2002; Chetelat, 2003; Karas et al., 2004; Pennanen et al., 2005; Bozzali et al., 2006; Saykin et al., 2006; Whitwell et al., 2007), the present study finds that brain atrophy in this cohort is already quite extensive and involves superior, middle and inferior temporal gyri, the insula, the posterior cingulate and adjacent precuneous, the uncus, and the peri-hippocampal WM, mainly in the MCI_AD subgroup. Two factors might have contributed to this finding. First, the ADNI MCI population was selected so that an adequate number of converters would be expected within three years, so that the study would be adequately powered. Although our findings certainly agree with this clinically-based selection of patients, Fig. 1 suggests that the volumes of the hippocampus and entorhinal cortex of the MCI patients were highly overlapping with both CN and AD; the cross-validated classification results obtained from these ROI measurements also showed significant group overlap. Therefore, patient selection does not fully explain our finding. It is likely that the identification of more widespread and complex patterns of brain atrophy in our study is partly due to the fact that a high-dimensional template warping mechanism was used to determine the RAVENS maps and to capture spatial patterns of brain atrophy. This image warping algorithm has been previously found to achieve very accurate inter-individual registration, which is of fundamental importance for measuring subtle patterns of brain atrophy across individuals.
The similarity of a subgroup of the MCI group to AD was further supported by the complementary analysis using high-dimensional pattern classification to determine the optimal group separation. This analysis showed that the structural phenotypic scores of two thirds of the MCI group were more similar to those of AD patients. Relatively recent studies using the PIB compound have also shown a relatively widespread accumulation of amyloid plaques in many MCI patients(Kemppainen et al., 2007). These findings further support that AD pathology might already be at quite advanced stages by the time cognitive decline becomes clinically detectable, at least for a subgroup of the MCI population that is hypothesized to have significant AD pathology. Subsequent follow-up will determine whether this hypothesis is true, however the MMSE decline in this subgroup is a significant indicator that these patients are likely to convert to AD soon. The ability of pattern classification to serve as a biomarker for such a group would be very important.
The finding that the majority of MCI patients seem to have AD-like structural profiles also suggests that more emphasis should be placed on studying CN groups. Although current clinical trials of potential treatments, including ADNI, focus primarily on MCI groups, since MCI patients convert to AD at rates of approximately 15% annually, from a diagnostic perspective it would undoubtedly be beneficial to study cognitively normal populations that have less advanced AD pathology. By virtue of its ability to measure subtle patterns of brain atrophy, the methodology adopted in our study can potentially assist in identifying cognitively normal individuals that display patterns of atrophy that render them likely to be in a very early preclinical AD stage. Earlier analysis using the same methodology in a longitudinal study of normal aging demonstrated that high-dimensional pattern analysis and classification can identify abnormal patterns of brain trophy before clinically detectable cognitive decline (Davatzikos et al., 2006).
The finding of reduced WM volumes between MCI and CN is interesting and merits further research. The pattern of WM atrophy was bilateral, although more pronounced in the right hemisphere, and extended into the region adjacent to the entorhinal cortex as well as into the superior and middle temporal gyri. Dense connections existing between the hippocampus and the posterior cingulate, which coupled with the early changes that have been reported in the posterior cingulate (Chetelat, 2003; Chetelat et al., 2003), might imply that changes in WM might provide additional markers of disease progression, something that has traditionally not attracted much attention in the AD literature. A growing recent literature using diffusion tensor imaging further support the importance of examining white matter changes in AD (Bozzali et al., 2002; Moseley, 2002; Fellgiebel et al., 2004; Choi et al., 2005; Fellgiebel et al., 2005; Fellgiebel et al., 2006; Medina et al., 2006; Naggara et al., 2006; Ray et al., 2006; Huang and Auchus, 2007), albeit the majority of these studies have been restricted to measuring quantities such as fractional anisotropy and diffusivity, and therefore have not differentiated between brain atrophy and other tissue changes that can potentially have vascular underpinnings (for example, both fractional anisotropy and diffusivity are known to be lower in leukoareosis). More sophisticated types of analysis of diffusion tensor images (Khurd et al., 2006; Verma and Davatzikos, 2006) can potentially elucidate alterations of WM connectivity in AD.
Our findings suggest a bilateral pattern of atrophy in MCI, although the right hemisphere displayed higher magnitude and more widespread extent of atrophy of both GM and WM. This potential asymmetry was, however, balanced with disease progression, since the pattern of atrophy in AD was fairly symmetric. The interpretation of such asymmetries is known to be problematic, since the true reason might be bias in patient selection rather than differences of the underlying AD pathology. In particular, the right-more-than-left pattern that we observed is consistent with the hypothesis that patients that report to the clinic with memory complaints are more likely to report when they have language problems. Accordingly, one might expect that a smaller degree of atrophy on the left hemisphere would meet the threshold for a patient’s reporting to the clinic, compared to atrophy of the right hemisphere that would be likely to present less obvious cognitive deficits. Put differently, a relatively larger degree of right-hemisphere atrophy, compared to left, is likely to be tolerated before the patient reports to the clinic. Our pattern of asymmetry is the reverse of what another similar study reported (Karas et al., 2004). Differences between the two studies, especially with respect to the template warping method and the patient populations, render the two studies not directly comparable. The relatively higher sensitivity of our methodology in detecting GM and WM atrophy (e.g. values of the t-statistic in Figs 2-3) further speak to the methodological differences between the two studies.
The comparison between the MCI_CN and MCI_AD subgroups lead to two very interesting conclusions. First, the former group is almost entirely overlapping with CN, and the latter overlaps almost entirely with the AD group. Although this result yet remains to be tested in independent patient populations, it does highlight the potential of the high-dimensional pattern classification method to detect subgroups in MCI patients, which would be of great importance clinically. Second, the main WM differences between these two subgroups were in periventicular tissue. This finding could imply decrease of WM via Wallerian degeneration, however testing this hypothesis would require different imaging protocols, and especially diffusion tensor imaging, which are not available in ADNI. It is interesting to note, however, that the regions identified by this analysis are exactly where the bulk of leukoareosis tends to occur in elderly individuals with or without other significant vascular disease, and which tend to appear as gray rather than white matter in T1-weighted MR images. The resolution and contrast of the MRI sequences used in this study doesn’t allow us to investigate this issue. This finding raises the important issue of the potential role of vascular pathology in AD, which has also received attention in the literature (Snowdon et al., 1997; Schneider et al., 2003; Prins et al., 2004; Schneider et al., 2004) (Kim et al., 1998; Lin et al., 1999; Lin et al., 1999; Bennett et al., 2000; Shi et al., 2000; Nihashi et al., 2001). Our results suggest that one of the significant differences between the MCI_CN and MCI_AD subgroups is likely to be periventricular leukoareosis, and further support the need to examine vascular pathology in tandem with brain atrophy. Regardless of whether or not AD is pathophysiologically related to vascular disease, its clinical manifestation almost certainly depends on the concurrent presence of vascular disease (Schneider et al., 2004).
A relatively new technique, namely high-dimensional pattern classification, was used to analyze patterns of spatial distribution of brain tissue and integrate them into an abnormality score, which represents how similar the entire structural profile of an individual fits that of AD patients or of cognitively normal individuals. This approach has been recently used in several neuroimaging studies and has shown great potential as a diagnostic tool on individuals (Lao et al., 2004; Davatzikos et al., 2005; Fan et al., 2007; Davatzikos et al., in press, 2006). It is a significant deviation from either ROI-based or voxel-based techniques, which examine the brain region-by-region independently, without integrating the entire pattern of atrophy (or functional activity (Davatzikos et al., 2005)) throughout all brain regions together. This is very important, because although many regions generally display significant group differences, they also significantly overlap between groups (see Fig. 1), and therefore don’t offer sufficient sensitivity and specificity for diagnostic purposes. The methodology used herein achieves high group separation via nonlinear multivariate classification using support vector machines, and it has been shown to possess great diagnostic value in neurodegenerative and neuropsychiatric disorders, and likely beyond (Zhang et al., 2002; Davatzikos et al., 2005; LaConte et al., 2005; Mourao-Miranda et al., 2005).
In summary, this study used advanced quantitative pattern analysis and classification methodologies and determined spatially complex patterns of brain atrophy in MCI and AD patients. The MCI group was highly variable, as anticipated, but its majority overlapped with AD patients, with regard to brain atrophy. Analysis of the follow-up scans of this longitudinal study revealed that the group identified by pattern classification as being similar to the AD group did indeed present significantly higher rates of MMSE decline. Further follow-up will help reveal whether subsequent conversion of the MCI participants to AD will be in agreement with the two structural profiles observed in this study, i.e. whether the MCI subgroup that overlaps with AD will indeed progress to AD within the 3 year follow-up period of ADNI.
Acknowledgments
This study was financially supported by the NIH grant R01AG14971, and by a grant by the Institute for the Study of Aging. Data collection and sharing for this project was funded by the Alzheimer’s Disease Neuroimaging Initiative (ADNI; Principal Investigator: Michael Weiner; NIH grant U01 AG024904). ADNI is funded by the National Institute on Aging, the National Institute of Biomedical Imaging and Bioengineering (NIBIB), and through generous contributions from the following: Pfizer Inc., Wyeth Research, Bristol-Myers Squibb, Eli Lilly and Company, GlaxoSmithKline, Merck & Co. Inc., AstraZeneca AB, Novartis Pharmaceuticals Corporation, Alzheimer’s Association, Eisai Global Clinical Development, Elan Corporation plc, Forest Laboratories, and the Institute for the Study of Aging, with participation from the U.S. Food and Drug Administration. Industry partnerships are coordinated through the Foundation for the National Institutes of Health. The grantee organization is the Northern California Institute for Research and Education, and the study is coordinated by the Alzheimer’s Disease Cooperative Study at the University of California, San Diego. ADNI data are disseminated by the Laboratory of Neuro Imaging at the University of California, Los Angeles.
Footnotes
Data used in the preparation of this article were obtained from the Alzheimer’s Disease Neuroimaging Initiative (ADNI) database (www.loni.ucla.edu\ADNI). As such, the investigators within the ADNI contributed to the design and implementation of ADNI and/or provided data but did not participate in analysis or writing of this report. ADNI investigators include (complete listing available at http://www.loni.ucla.edu/ADNI/Data/ADNI_Manuscript_Citations.doc)
References
- Adeli H, Ghosh-Dastidar S, Dadmehr N. Alzheimer’s disease and models of computation: imaging, classification, and neural models. Journal of Alzheimer’s Disease. 2005;7:187–199. doi: 10.3233/jad-2005-7301. [DOI] [PubMed] [Google Scholar]
- Ashburner J, Csernansky JG, Davatzikos C, Fox NC, Frisoni GB, Thompson PM. Computer-assisted imaging to assess brain structure in healthy and diseased brains. The Lancet (Neurology) 2003;2:79–88. doi: 10.1016/s1474-4422(03)00304-1. [DOI] [PubMed] [Google Scholar]
- Bennett SAL, Pappas BA, Stevens WD, Davidson CM, Fortin T, Chen J. Cleavage of amyloid precursor protein elicited by chronic cerebral hypoperfusion. Neurobiology of Aging. 2000;21:207–214. doi: 10.1016/s0197-4580(00)00131-7. [DOI] [PubMed] [Google Scholar]
- Beresford T, Arciniegas D, Alfers J, Clapp L, Martin B, Beresford H, Du Y, Liu D, Shen D, Davatzikos C, Laudenslager M. Hypercortisolism In Alcohol Dependence and Its Relation to Hippocampal Volume Loss. Journal of Studies on Alcohol. 2006;67:861–867. doi: 10.15288/jsa.2006.67.861. [DOI] [PubMed] [Google Scholar]
- Beresford TP, Arciniegas DB, Alfers J, Clapp L, Martin B, Du Y, Liu D, Shen D, Davatzikos C. Hippocampus Volume Loss Due to Chronic Heavy Drinking. Alcoholism: Clinical and Experimental Research. 2006;30:1866–1870. doi: 10.1111/j.1530-0277.2006.00223.x. [DOI] [PubMed] [Google Scholar]
- Bozzali M, Falini A, Franceschi M, Cercignani M, Zuffi M, Scotti G, Comi G, Filippi M. White matter damage in Alzheimer’s disease assessed in vivo using diffusion tensor magnetic resonance imaging. Journal of Neurology Neurosurgery and Psychiatry. 2002;72:742–746. doi: 10.1136/jnnp.72.6.742. [DOI] [PMC free article] [PubMed] [Google Scholar]
- Bozzali M, Filippi M, Magnani G, Cercignani M, Franceschi M, Schiatti E, Castiglioni S, Mossini R, Falautano M, Scotti G, Comi G, Falini A. The contribution of voxel-based morphometry in staging patients with mild cognitive impairment. Neurology. 2006;67:453–460. doi: 10.1212/01.wnl.0000228243.56665.c2. [DOI] [PubMed] [Google Scholar]
- Braak H, Braak E, Bohl J, Bratzke H. Evolution of Alzheimer’s disease related cortical lesions. J Neural Transm Suppl. 1998;54:97–106. doi: 10.1007/978-3-7091-7508-8_9. [DOI] [PubMed] [Google Scholar]
- Chetelat G. Early diagnosis of Alzheiner’s Disease: contribution of structural neuroimaging. Neuroimage. 2003;18:525–541. doi: 10.1016/s1053-8119(02)00026-5. [DOI] [PubMed] [Google Scholar]
- Chetelat G, Desgranges B, de la Sayette V, Viader F, Eustache F, Baron J-C. Mapping gray matter loss with voxel-based morphometry in mild cognitive impairment. Neuroreport. 2002;13:1939–1943. doi: 10.1097/00001756-200210280-00022. [DOI] [PubMed] [Google Scholar]
- Chetelat G, Desgranges B, de la Sayette V, Viader F, Eustache F, Baron JC. Mild cognitive impairment: Can FDG-PET predict who is to rapidly convert to Alzheimer’s disease? Neurology. 2003;60:1374–1377. doi: 10.1212/01.wnl.0000055847.17752.e6. [DOI] [PubMed] [Google Scholar]
- Choi SJ, Lim KO, Monteiro I, Reisberg B. Diffusion Tensor Imaging of Frontal White Matter Microstructure in Early Alzheimer’s Disease: A Preliminary Study. Journal of Geriatric Psychiatry and Neurology. 2005;18:12–19. doi: 10.1177/0891988704271763. [DOI] [PubMed] [Google Scholar]
- Convit A, de Asis J, de Leon MJ, Tarshish CY, De Santi S, Rusinek H. Atrophy of the medial occipitotemporal, inferior, and middle temporal gyri in non-demented elderly predict decline to Alzheimer’s disease. Neurobiology of Aging. 2000;21:19–26. doi: 10.1016/s0197-4580(99)00107-4. [DOI] [PubMed] [Google Scholar]
- Convit A, De Leon MJ, Tarshish C, De Santi S, Tsui W, Rusinek H, George A. Specific hippocampal volume reductions in individuals at risk for Alzheimer’s disease. Neurobiol Aging. 1997;18:131–138. doi: 10.1016/s0197-4580(97)00001-8. [DOI] [PubMed] [Google Scholar]
- Csernansky JG, Wang L, Swank J, Miller JP, Gado M, McKeel D, Miller MI, Morris JC. Preclinical detection of Alzheimer’s disease: hippocampal shape and volume predict dementia onset in the elderly. Neuroimage. 2005;25:783–792. doi: 10.1016/j.neuroimage.2004.12.036. [DOI] [PubMed] [Google Scholar]
- Davatzikos C, Acharyya M, Ruparel K, Shen DG, Loughhead J, Gur RC, Langleben D. Classifying spatial patterns of brain activity for lie-detection. Neuroimage. 2005;28:663–668. doi: 10.1016/j.neuroimage.2005.08.009. [DOI] [PubMed] [Google Scholar]
- Davatzikos C, Fan Y, Wu X, Shen D, Resnick SM. Complex Patterns of Structural Brain Abnormality Identified in MCI via High-Dimensional Pattern Classification of MR Images May Be Early Markers of Alzheimer’s Disease. The 10th International Conference on Alzheimer’s Disease and Related Disorders; Madrid, Spain. 2006. [Google Scholar]
- Davatzikos C, Fan Y, Wu X, Shen D, Resnick SM. Detection of Prodromal Alzheimer’s Disease via Pattern Classification of MRI. Neurobiology of Aging. 2006 doi: 10.1016/j.neurobiolaging.2006.11.010. in press. [DOI] [PMC free article] [PubMed] [Google Scholar]
- Davatzikos C, Genc A, Xu D, Resnick SM. Voxel-Based Morphometry Using the RAVENS Maps: Methods and Validation Using Simulated Longitudinal Atrophy. NeuroImage. 2001;14:1361–1369. doi: 10.1006/nimg.2001.0937. [DOI] [PubMed] [Google Scholar]
- Davatzikos C, Shen DG, Wu X, Lao Z, Hughett P, Turetsky BI, Gur RC, Gur RE. Whole-brain morphometric study of schizophrenia reveals a spatially complex set of focal abnormalities. JAMA Archives of General Psychiatry. 2005;62:1218–1227. doi: 10.1001/archpsyc.62.11.1218. [DOI] [PubMed] [Google Scholar]
- De Leon M, DeSanti S, Zinkowski R, Mehta P, Pratico D, Segal S, Rusinek H, Li J, Tsui W, Louis LS. Longitudinal CSF and MRI biomarkers improve the diagnosis of mild cognitive impairment. Neurobiology of Aging. 2006;27:394–401. doi: 10.1016/j.neurobiolaging.2005.07.003. [DOI] [PubMed] [Google Scholar]
- De Santi S, de Leon MJ, Rusinek H, Convit A, Tarshish CY, Roche A, Tsui WH, Kandil E, Boppana M, Daisley K, Wang GJ, Schlyer D, Fowler J. Hippocampal formation glucose metabolism and volume losses in MCI and AD. Neurobiol Aging. 2001;22:529–539. doi: 10.1016/s0197-4580(01)00230-5. [DOI] [PubMed] [Google Scholar]
- Dickerson BC, Goncharova I, Sullivan MP, Forchetti C, Wilson RS, Bennett DA, Beckett LA, deToledo-Morrell L. MRI-derived entorhinal and hippocampal atrophy in incipient and very mild Alzheimer’s disease. Neurobiol Aging. 2001;22:747–754. doi: 10.1016/s0197-4580(01)00271-8. [DOI] [PubMed] [Google Scholar]
- Driscoll I, Davatzikos C, An Y, Wu X, Shen D, Kraut M, Resnick SM. Society of neuroscience. San Diego, CA: 2007. Longitudinal brain changes in cognitively impaired and unimpaired older adults. [Google Scholar]
- Du AT, Schuff N, Amend D, Laakso MP, Hsu YY, Jagust WJ, Yaffe K, Kramer JH, Reed B, Norman D, Chui HC, Weiner MW. Magnetic resonance imaging of the entorhinal cortex and hippocampus in mild cognitive impairment and Alzheimer’s disease. Journal of Neurology Neurosurgery and Psychiatry. 2001;71:441–447. doi: 10.1136/jnnp.71.4.441. [DOI] [PMC free article] [PubMed] [Google Scholar]
- Fan Y, Gur R, Gur R, Wu X, Shen D, Calkins M, Davatzikos C. Unaffected Family Members and Schizophrenia Patients Share Brain Structure Patterns: A High-Dimensional Pattern Classification Study. Biological psychiatry. 2007 doi: 10.1016/j.biopsych.2007.03.015. in press. [DOI] [PMC free article] [PubMed] [Google Scholar]
- Fan Y, Shen D, Davatzikos C. Classification of Structural Images via High-Dimensional Image Warping, Robust Feature Extraction, and SVM. In: Duncan JS, Gerig G, editors. MICCAI. Palm Springs, California, USA: Springer-Verlag GmbH; 2005. pp. 1–8. [DOI] [PubMed] [Google Scholar]
- Fan Y, Shen D, Gur RC, Gur RE, Davatzikos C. COMPARE: Classification Of Morphological Patterns using Adaptive Regional Elements. IEEE Transactions on Medical Imaging. 2007;26:93–105. doi: 10.1109/TMI.2006.886812. [DOI] [PubMed] [Google Scholar]
- Fellgiebel A, Dellani PR, Greverus D, Scheurich A, Stoeter P, Muller MJ. Predicting conversion to dementia in mild cognitive impairment by volumetric and diffusivity measurements of the hippocampus. Psychiatry Research. 2006;146:283–287. doi: 10.1016/j.pscychresns.2006.01.006. [DOI] [PubMed] [Google Scholar]
- Fellgiebel A, Muller MJ, Wille P, Dellani PR, Scheurich A, Schmidt LG, Stoeter P. Color-coded diffusion-tensor-imaging of posterior cingulate fiber tracts in mild cognitive impairment. Neurobiology of Aging. 2005;26:1193–1198. doi: 10.1016/j.neurobiolaging.2004.11.006. [DOI] [PubMed] [Google Scholar]
- Fellgiebel A, Wille P, Muller MJ, Winterer G, Scheurich A, Vucurevic G, Schmidt LG, Stoeter P. Ultrastructural hippocampal and white matter alterations in mild cognitive impairment: a diffusion tensor imaging study. Dementia and Geriatric Cognitive Disorders. 2004;18:101–108. doi: 10.1159/000077817. [DOI] [PubMed] [Google Scholar]
- Goldszal AF, Davatzikos C, Pham D, Yan M, Bryan RN, Resnick SM. An image processing protocol for the analysis of MR images from an elderly population. Journal of Computer Assisted Tomography. 1998;22:827–837. doi: 10.1097/00004728-199809000-00030. [DOI] [PubMed] [Google Scholar]
- Good CD, Scahill RI, Fox NC, Ashburner J, Friston KJ, Chan D, Crum WR, Rossor MN, Frackowiak RSJ. Automatic differentiation of anatomical patterns in the human brain: Validation with studies of degenerative dementias. Neuroimage. 2002;17:29–46. doi: 10.1006/nimg.2002.1202. [DOI] [PubMed] [Google Scholar]
- Grundman M, Sencakova D, Jack CJ, Petersen R, Kim H, Schultz A, Weiner M, DeCarli C, DeKosky S, van Dyck C, Thomas R, Thal L. Brain MRI hippocampal volume and prediction of clinical status in a mild cognitive impairment trial. Journal of Molecular Neuroscience. 2002;19:23–27. doi: 10.1007/s12031-002-0006-6. [DOI] [PubMed] [Google Scholar]
- Gur R, Davatzikos C, Shen D, Wu X, Fan Y, Hughett P, Turetsky B, Gur R. Whole-brain deformation based morphometry MRI study of schizophrenia. SCHIZOPHRENIA BULLETIN. 2006;31:408–408. [Google Scholar]
- Huang J, Auchus AP. Diffusion Tensor Imaging of Normal Appearing White Matter and Its Correlation with Cognitive Functioning in Mild Cognitive Impairment and Alzheimer’s Disease. Annals of New York Academy of Sciences. 2007;1097:259–264. doi: 10.1196/annals.1379.021. [DOI] [PubMed] [Google Scholar]
- Jack CJ, Petersen R, Xu Y, O’Brien P, Smith G, Ivnik R, Boeve B, Tangalos E, Kokmen E. Rates of hippocampal atrophy correlate with change in clinical status in aging and AD. Neurology. 2000;55:484–489. doi: 10.1212/wnl.55.4.484. [DOI] [PMC free article] [PubMed] [Google Scholar]
- Jack CR, Petersen RC YCX, O’Brien PC, Smith GE, Ivnik RJ, Boeve BF, Waring SC, Tangalos E, Kokmen E. Prediction of AD with MRI-based hippocampal volume in mild cognitive impairment. Neurology. 1999;52:1397–1403. doi: 10.1212/wnl.52.7.1397. [DOI] [PMC free article] [PubMed] [Google Scholar]
- Kabani N, MacDonald D, Holmes CJ, Evans A. A 3D atlas of the human brain. Neuroimage. 1998:7–S717. [Google Scholar]
- Karas GB, Scheltens P, Rombouts SARB, Visser PJ, Schijndel RAv, Fox NC, Barkhof F. Global and local gray matter loss in mild cognitive impairment and Alzheimer’s disease. Neuroimage. 2004;23:708–716. doi: 10.1016/j.neuroimage.2004.07.006. [DOI] [PubMed] [Google Scholar]
- Kaye J, Swihart T, Howieson D, Dame A, Moore M, Karnos T, Camicioli R, Ball M, Oken B, Sexton G. Volume loss of the hippocampus and temporal lobe in healthy elderly persons destined to develop dementia. Neurology. 1997;48:1297–1304. doi: 10.1212/wnl.48.5.1297. [DOI] [PubMed] [Google Scholar]
- Kemppainen N, Aalto S, Wilson I, Någren K, Helin S, Brück A, Oikonen V, Kailajärvi M, Scheinin M, Viitanen M, Parkkola R, Rinne J. PET amyloid ligand [11C]PIB uptake is increased in mild cognitive impairment. Neurology. 2007;68:1603–1606. doi: 10.1212/01.wnl.0000260969.94695.56. [DOI] [PubMed] [Google Scholar]
- Khurd P, Verma R, Davatzikos C. IEEE Computer Society Workshop on Mathematical Methods in Biomedical Image Analysis. Ney York, NY: 2006. On Characterizing and Analyzing Diffusion Tensor Images by Learning their Underlying Manifold Structure. [Google Scholar]
- Killiany RJ, Gomez-Isla T, Moss M, Kikinis R, Sandor T, Jolesz F, Tanzi R, Jones K, Hyman BT, Albert MS. Use of structural magnetic resonance imaging to predict who will get Alzheimer’s disease. Ann Neurol. 2000;47:430–439. [PubMed] [Google Scholar]
- Kim HS, Lee SH, Kim SS, Kim YK, Jeong SJ, Ma J, Han DH, Cho BK, Suh YH. Post-ischemic changes in the expression of Alzheimer’s APP isoforms in rat cerebral cortex. Neuroreport. 1998;9:533–537. [PubMed] [Google Scholar]
- Kim J-S, Kanaan R, Kaufmann W, Ross C, Calhoun V, Xu D, Shen D, Davatzikos C, Godfrey Pearlson GD. ISMRM. Toronto, Canada: 2003. Abnormal White Matter Organization in Huntington’s Disease Evaluated With Diffusion Tensor MRI. [Google Scholar]
- LaConte S, Strother S, Cherkassky V, Anderson J, Hu X. Support vector machines for temporal classification of block design fMRI data. NeuroImage. 2005;26:317–329. doi: 10.1016/j.neuroimage.2005.01.048. [DOI] [PubMed] [Google Scholar]
- Lao Z, Shen D, Resnick S, Davatzikos C. Human Brain Mapping. New York City, USA: 2003. Morphological classification of brains via high-dimensional shape transformations and machine learning methods. [DOI] [PubMed] [Google Scholar]
- Lao Z, Shen D, Xue Z, Karacali B, Resnick SM, Davatzikos C. Morphological classification of brains via high-dimensional shape transformations and machine learning methods. Neuroimage. 2004;21:46–57. doi: 10.1016/j.neuroimage.2003.09.027. [DOI] [PubMed] [Google Scholar]
- Li S, Shi F, Pu F, Li X, Jiang T, Xie S, Wang Y. Hippocampal shape analysis of Alzheimer disease based on machine learning methods. American Journal of Neuroradiology. 2007;28:1339–1345. doi: 10.3174/ajnr.A0620. [DOI] [PMC free article] [PubMed] [Google Scholar]
- Lin B, Schmidt-Kastner R, Busto R, Ginsberg MD. Progressive parenchymal deposition of beta-amyloid precursor protein in rat brain following global cerebral ischemia. Acta Neuropathology. 1999;97:359–368. doi: 10.1007/s004010050999. [DOI] [PubMed] [Google Scholar]
- Lin BW, Schmidt-Kastner R, Busto R, Ginsberg Progressive parenchymal deposition of beta-amyloid precursor protein immunoreactivity in rat brain following global cerebral ischemia. Stroke. 1999:30–274. doi: 10.1007/s004010050999. [DOI] [PubMed] [Google Scholar]
- Liu Y, Teverovskiy L, Carmichael O, Kikinis R, Shenton M, Carter CS, Stenger VA, Davis S, Aizenstein H, Becker J, Lopez O, Meltzer C. Discriminative MR Image Feature Analysis for Automatic Schizophrenia and Alzheimer’s Disease Classification. In: Barillot C, Haynor DR, Hellier P, editors. Medical Image Computing and Computer-Assisted Intervention – MICCAI 2004: 7th International Conference; Saint-Malo, France. Springer-Verlag GmbH; 2004. pp. 393–401. [Google Scholar]
- Medina D, deToledo-Morrell L, Urresta F, Gabrieli JDE, Moseley M, Fleischman D, Bennett DA, Leurgans S, Turner DA, Stebbins GT. White matter changes in mild cognitive impairment and AD: A diffusion tensor imaging study. Neurobiology of Aging. 2006;27:663–672. doi: 10.1016/j.neurobiolaging.2005.03.026. [DOI] [PubMed] [Google Scholar]
- Moseley M. Diffusion tensor imaging and aging - a review. NMR in Biomedicine. 2002;15:553–560. doi: 10.1002/nbm.785. [DOI] [PubMed] [Google Scholar]
- Mourao-Miranda J, Bokde ALW, Born C, Hampel H, Stetter M. Classifying brain states and determining the discriminating activation patterns: Support Vector Machine on functional MRI data. Neuroimage. 2005;28:980–995. doi: 10.1016/j.neuroimage.2005.06.070. [DOI] [PubMed] [Google Scholar]
- Naggara O, Oppenheim C, Rieu D, Raoux N, Rodrigo S, Dalla Barba G, Meder J-F. Diffusion tensor imaging in early Alzheimer’s disease. Psychiatry Research: Neuroimaging. 2006;146:243–249. doi: 10.1016/j.pscychresns.2006.01.005. [DOI] [PubMed] [Google Scholar]
- Nihashi T, Inao S, Kajita Y, Kawai T, Sugimoto T, Niwa M, Kabeya R, Hata N, Hayashi S, Yoshida J. Expression and Distribution of Beta Amyloid Precursor Protein and Beta Amyloid Peptide in Reactive Astrocytes After Transient Middle Cerebral Artery Occlusion. Acta Neurochirurgica. 2001;143:287–295. doi: 10.1007/s007010170109. [DOI] [PubMed] [Google Scholar]
- Pennanen C, Testa C, Laakso MP, Hallikainen M, Helkala E-L, Hänninen T, Kivipelto M, Könönen M, Nissinen A, Tervo S, Vanhanen M, Vanninen R, Frisoni GB, Soininen H. A voxel based morphometry study on mild cognitive impairment. Journal of Neurology Neurosurgery and Psychiatry. 2005;76:11–14. doi: 10.1136/jnnp.2004.035600. [DOI] [PMC free article] [PubMed] [Google Scholar]
- Pham DL, Prince JL. Adaptive fuzzy segmentation of magnetic resonance images. IEEE Transactions in Medical Imaging. 1999;18:737–752. doi: 10.1109/42.802752. [DOI] [PubMed] [Google Scholar]
- Prins ND, Dijk EJv, Heijer Td, Vermeer SE, Koudstaal PJ, Oudkerk M, Hofman A, Breteler MMB. Cerebral White Matter Lesions and the Risk of Dementia. Archives of Neurology. 2004;61:1531–1534. doi: 10.1001/archneur.61.10.1531. [DOI] [PubMed] [Google Scholar]
- Ray KM, Wang H, Chu Y, Chen Y-F, Bert A, Hasso AN, Su M-Y. Mild Cognitive Impairment: Apparent Diffusion Coefficient in Regional Gray Matter and White Matter Structures. Radiology. 2006;241:197–205. doi: 10.1148/radiol.2411051051. [DOI] [PubMed] [Google Scholar]
- Resnick S, Davatzikos C, Kraut M, Zonderman A. Longitudinal changes in MRI volumes in older adults. Neurobiology of Aging. 2001:22–5. [Google Scholar]
- Resnick S, Pham D, Davatzikos C, Kraut M. Sex differences in regional cerebral blood flow: Clinical implications for Alzheimer’s disease. Neurobiology of Aging. 2004:25–263. [Google Scholar]
- Resnick SM, Goldszal A, Davatzikos C, Golski S, Kraut MA, Metter EJ, Bryan RN, Zonderman AB. One-year age changes in MRI brain volumes in older adults. Cerebral Cortex. 2000;10:464–472. doi: 10.1093/cercor/10.5.464. [DOI] [PubMed] [Google Scholar]
- Resnick SM, Pham DL, Kraut MA, Zonderman AB, Davatzikos C. Longitudinal Magnetic Resonance Imaging Studies of Older Adults: A Shrinking Brain. The Journal of Neuroscience. 2003;23:3295–3301. doi: 10.1523/JNEUROSCI.23-08-03295.2003. [DOI] [PMC free article] [PubMed] [Google Scholar]
- Saykin AJ, Wishart HA, Rabin LA, Santulli RB, Flashman LA, West JD, McHugh TL, Mamourian AC. Older adults with cognitive complaints show brain atrophy similar to that of amnestic MCI. NEUROLOGY. 2006;67:834–842. doi: 10.1212/01.wnl.0000234032.77541.a2. [DOI] [PMC free article] [PubMed] [Google Scholar]
- Schneider JA, Wilson RS, Bienias JL, Evans DA, Bennett DA. Cerebral infarctions and the likelihood of dementia from Alzheimer disease pathology. Neurology. 2004;62:1148–1155. doi: 10.1212/01.wnl.0000118211.78503.f5. [DOI] [PubMed] [Google Scholar]
- Schneider JA, Wilson RS, Cochran EJ, Bienias JL, Arnold SE, Evans DA, Bennett DA. Relation of cerebral infarctions to dementia and cognitive function in older persons. Neurology. 2003;60:1082–1088. doi: 10.1212/01.wnl.0000055863.87435.b2. [DOI] [PubMed] [Google Scholar]
- Shen D, Davatzikos C. HAMMER: Hierarchical attribute matching mechanism for elastic registration. IEEE Transactions on Medical Imaging. 2002;21:1421–1439. doi: 10.1109/TMI.2002.803111. [DOI] [PubMed] [Google Scholar]
- Shen D, Moffat S, Resnick SM, Davatzikos C. Measuring Size and Shape of the Hippocampus in MR Images Using a Deformable Shape Model. Neuroimage. 2002;15:422–434. doi: 10.1006/nimg.2001.0987. [DOI] [PubMed] [Google Scholar]
- Shen DG, Davatzikos C. Very high resolution morphometry using mass-preserving deformations and HAMMER elastic registration. NeuroImage. 2003;18:28–41. doi: 10.1006/nimg.2002.1301. [DOI] [PubMed] [Google Scholar]
- Shi J, Yang SH, Stubley L, Day AL, Simpkins JW. Hypoperfusion induces overexpression of beta-amyloid precursor protein mRNA in a focal ischemic rodent model. Brain Research. 2000;853:1–4. doi: 10.1016/s0006-8993(99)02113-7. [DOI] [PubMed] [Google Scholar]
- Snowdon DA, Greiner LH, Mortimer JA, Riley KP, Greiner PA, Markesbery WR. Brain infarction and the clinical expression of Alzheimer’s disease. The Nun study. JAMA. 1997;277:813–817. [PubMed] [Google Scholar]
- Stewart WF, Schwartz BS, Davatzikos C, Shen D, Liu D, Wu X, Todd AC, Shi W, Bassett S, Youssem D. Past Adult Lead Exposure is Linked to Neurodegeneration Measured by Brain MRI. Neurology. 2006;66:1476–1484. doi: 10.1212/01.wnl.0000216138.69777.15. [DOI] [PubMed] [Google Scholar]
- Stoub TR, Bulgakova M, Leurgans S, Bennett DA, Fleischman D, Turner DA, deToledo-Morrell L. MRI predictors of risk of incident Alzheimer disease: A longitudinal study. Neurology. 2005;64:1520–1524. doi: 10.1212/01.WNL.0000160089.43264.1A. [DOI] [PubMed] [Google Scholar]
- Tandon R, Adak S, Kaye J. Neural networks for longitudinal studies in Alzheimer’s disease. Artificial Intelligence in Medicine. 2006;36:245–255. doi: 10.1016/j.artmed.2005.10.007. [DOI] [PubMed] [Google Scholar]
- Thompson PM, Mega MS, Woods RP, Zoumalan CI, Lindshield CJ, Blanton RE, Moussai J, Holmes CJ, Cummings JL, Toga AW. Cortical Change in Alzheimer’s Disease Detected with a Disease-specific Population-based Brain Atlas. Cerebral Cortex. 2001;11:1–16. doi: 10.1093/cercor/11.1.1. [DOI] [PubMed] [Google Scholar]
- Van der Flier WMM, Van den Heuvel DMJM, Weverling-Rijnsburger AWEM, Spilt AM, Bollen ELEM, Westendorp RGJ, Middelkoop HAM, Van Buchem MA. Cognitive decline in AD and mild cognitive impairment is associated with global brain damage. Neurology. 2002;59:874–879. doi: 10.1212/wnl.59.6.874. [DOI] [PubMed] [Google Scholar]
- Verma R, Davatzikos C. ISBI. Arlington, VA: 2006. Manifold Based Analysis of Diffusion Tensor Images Using Isomaps. [Google Scholar]
- Visser PJ, Verhey FRJ, Hofman PA, Scheltens P, Jolles J. Medial temporal lobe atrophy predicts Alzheimer’s disease in patients with minor cognitive impairment. Journal of Neurology, Neurosurgery, and Psychiatry. 2002;72:491–497. doi: 10.1136/jnnp.72.4.491. [DOI] [PMC free article] [PubMed] [Google Scholar]
- Whitwell JL, Przybelski SA, Weigand SD, Knopman DS, Boeve BF, Petersen RC, Jack CR. 3D maps from multiple MRI illustrate changing atrophy patterns as subjects progress from mild cognitive impairment to Alzheimer’s disease. Brain. 2007;130:1777–1786. doi: 10.1093/brain/awm112. [DOI] [PMC free article] [PubMed] [Google Scholar]
- Xie S, Xiao JX, Gong GL, Zang YF, Wang YH, Wu HK, Jiang XX. Voxel-based detection of white matter abnormalities in mild Alzheimer disease. Neurology. 2006;66:1845–1849. doi: 10.1212/01.wnl.0000219625.77625.aa. [DOI] [PubMed] [Google Scholar]
- Xu Y, Jack CR, Jr, O’Brien PC, Kokmen E, Smith GE, Ivnik RJ, Boeve BF, Tangalos RG, Petersen RC. Usefulness of MRI measures of entorhinal cortex versus hippocampus in AD. Neurology. 2000;54:1760–1767. doi: 10.1212/wnl.54.9.1760. [DOI] [PubMed] [Google Scholar]
- Yekutieli D, Benjamini Y. Resampling-based false discovery rate controlling multiple test procedures for correlated test statistics. Journal of Statistical Planning and Inference. 1999;82:171–196. [Google Scholar]
- Zhang J, Liu Y, Zhao T. SVM Based Feature Screening Applied to Hierarchical Cervical Cancer Detection. International Conference on Diagnostic Imaging and Analysis (ICDIA 2002) 2002 [Google Scholar]