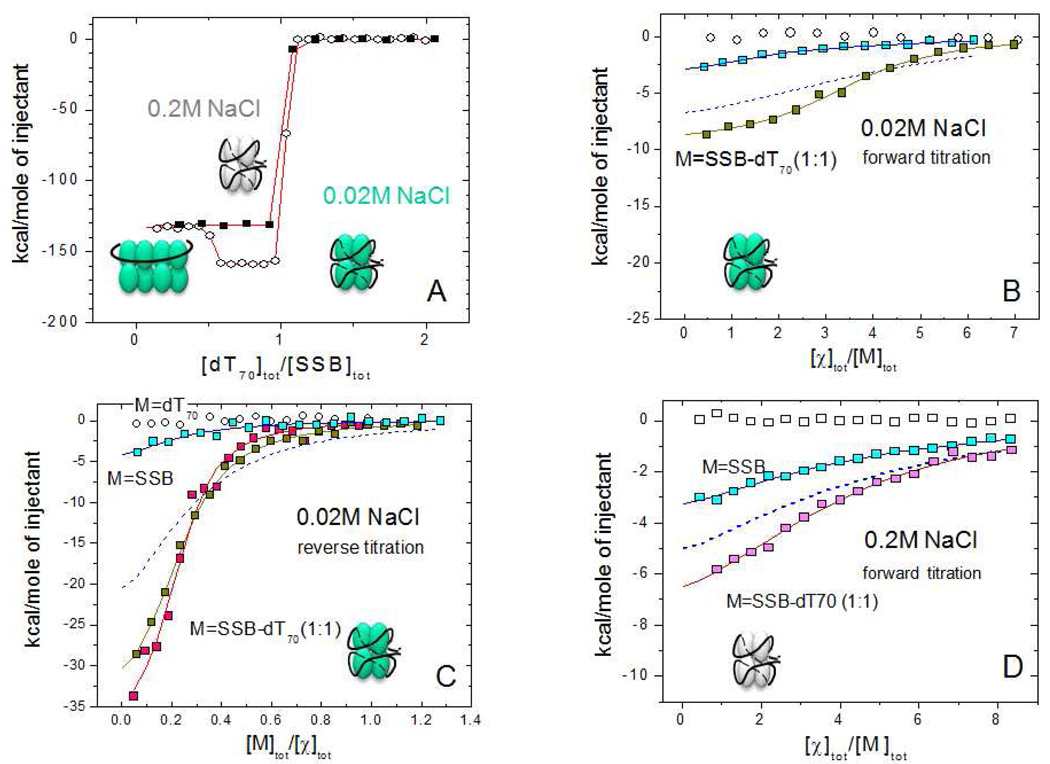
Figure 6.
Results of ITC experiments for the binding of χ to SSB and SSB-dT70 at low (0.02M) and moderate (0.2M) NaCl concentrations.
(A) – ITC titration of SSB (1 µM) with (dT)70 at 0.2 M NaCl (!) and 0.02 M NaCl (−) in buffer C, 25°C (concentrations of dT70 are 10 and 14 µM, respectively). At low salt the formation of a stoichiometric (SSB)35 complex (with two SSB tetramers bound per (dT)70 ) occurs at [dT70]tot/[SSB]tot ≤ 0.5, which then rearranges to a 1:1 (SSB)65 complex when [dT70]tot/[SSB]tot=1.0.
(B) – Forward titrations of SSB (0.6 µM) and an SSB-dT70 (1:1) complex (0.53 µM ) with χ protein (17 µM) (blue and yellow squares, respectively) in buffer H, low salt (0.02M NaCl). The smooth curve through SSB-dT70 data points represents the best fit to an n - independent and identical sites model (eq. 1 in Materials and Methods) with n=3.5±0.1, Kobs=(5.5±0.8)×106 M−1, ΔH= −9.5±0.7 kcal/mol. The isotherm shown with a blue dashed curve was simulated using n=4, Kobs=1.2×10⁶ M−1, ΔH= −8.3 kcal/mol (based on the χ-SSB-Ct binding parameters).
(C) - Reverse titrations of χ protein (0.9–1.1 µM) with (dT)70 (open squares), SSB (6.4 µM , blue squares) and SSB-(dT)70 (1:1) complex in buffer H (5.4 µM complex, yellow squares) and buffer C (4 µM complex, magenta squares) at low salt ( 0.02M NaCl). The smooth curves through SSB-(dT)70 data points represent the best fits to an n -independent and identical sites model with n=4.3±0.2, Kobs=(3.8±0.4)×106 M−1, ΔH= −8.9±0.2 kcal/mol (buffer H) and n=4.5±0.2, Kobs=(7.6±1.6)×106 M−1, ΔH= −8.7±0.3 kcal/mol (buffer C). The isotherm shown as a blue dashed curve was simulated using n=4, Kobs=1.2×10⁶ M−1, ΔH= −8.3 kcal/mol (based on the χ-SSB-Ct binding parameters)
(D) – Forward titration of SSB (1µM) (blue squares) and SSB-(dT)70 (1:1) complex (1.1 µM) (magenta squares) with χ protein ( 40 µM ) in buffer C (0.2M NaCl). The smooth lines represent the best fit of the data to an n - independent and identical sites model with n=3.9±0.4, Kobs=(3.0±0.7)×105 M−1, ΔH= −6.1±1.1 kcal/mol (SSB) and n=3.9±0.3, Kobs=(5.4±1.0)×105 M−1, ΔH= −9.5±1.0 kcal/mol (SSB-dT70 complex). The isotherm shown as a blue dashed curve is a simulation using n=4, Kobs=3×10⁵ M−1, ΔH= −9.2 kcal/mol (based on the χ-SSB-Ct binding parameters)

