Abstract
Background
The pathological effects of high alcohol (ethanol) consumption on gastrointestinal and hepatic systems are well recognized. However, the effects of ethanol intake on gastric and intestinal absorption and transport systems remain unclear. The present study investigates the effects of ethanol on the human peptide transporter 1 (hPepT1) which mediates the transport of di-and tripeptides as well as several orally administered peptidomimetic drugs such as β-lactam antibiotics (e.g., penicillin), angiotensin-converting enzyme inhibitors, the anti-neoplastic agent bestatin, and prodrugs of acyclovir.
Methods
Xenopus oocytes were injected with hPepT1 cRNA and incubated for 3 to 10 days. Currents induced by glycyl-sarcosine (Gly-Sar), Ala-Ala (dipeptides), penicillin and enalapril measured in the presence or absence of ethanol were determined using an 8-channel 2-electrode voltage clamp system, with a membrane potential of –70 mV and 11 voltage steps of 100 milliseconds (from +50 mV to –150 mV in –20 mV increments).
Results
Ethanol (200 mM) inhibited Gly-Sar and Ala-Ala currents by 42 and 30%, respectively, with IC50s of 184 and 371 mM, respectively. Ethanol reduced maximal transport capacity (Imax) of hPepT1 for Gly-Sar without affecting Gly-Sar binding affinity (K0.5 and Hill coefficient). Penicillin- and enalapril-induced currents were significantly less than those induced by dipeptides and were not inhibited by ethanol.
Conclusion
Ethanol significantly reduced transport of dipeptides via a reduction in transport capacity, rather than competing for binding sites in hPepT1. Ethanol inhibition or alteration of transport function may be a primary causative factor contributing to both the nutritional deficits as well as the immunological deficiencies that many alcoholics experience including alcohol liver disease and brain damage.
Keywords: hPepT1 Transporter, Ethanol Inhibition, Dipeptides, Penicillin, Enalapril
ALCOHOL (ETHANOL) ABUSE is a growing problem worldwide, with a per capita consumption of approximately 10 l pure ethanol per year in the United States and even higher levels in some Eastern European countries (Rehm et al., 2003). Ethanol abuse causes extensive pathological changes in the gastrointestinal (GI) tract and hepatic pancreatic system, and has been linked to more than 60 diseases (Gutjahr et al., 2001; Rehm et al., 2003). Ethanol directly damages the mucosal layer of the GI tract, causing erosive lesions and hemorrhages, and increases bacterial growth and toxin release in the GI tract. Increased permeability due to GI tract damage allows more of these bacterial toxins to enter the portal blood from the GI lumen, leading to endotoxemia and damage of other organs, including the liver, pancreas, and immune system (Bode and Bode, 2003; Halsted, 2004; Preedy et al., 1993).
The small intestine is the major site of nutrient absorption in the body, but to date, the effect of ethanol on this process has not been addressed. Ingested and digested nutrients such as peptides, vitamins and metal ions require endogenous solute carrier proteins (transporters) to facilitate their transport from the intestinal lumen to the portal blood for general utilization within the body (Dean et al., 2001; Fei et al., 1994; Terada et al., 2005). There are a variety of transporters expressed at the apical surface of epithelial cells lining the GI tract for transport of these species. One of these transporter systems is the human dipeptide transporter, hPepT1 (SLC15A1) (Hediger et al., 2004). The hPepT1 is a 708-amino acid protein with 12 α-helical transmembrane spanning domains (Liang et al., 1995). hPepT1 is expressed primarily in the intestine, and is also expressed to a lesser degree in the proximal tubules of the kidney and in cells of the liver and pancreas (Bockman et al., 1997; Liang et al., 1995; Thamotharan et al., 1997). The substrate specificity of hPepT1 is broad, permitting transport of many kinds of di- and tripeptides and several orally administered drugs, including β-lactam antibiotics (penicillin and amoxicillin) (Tamai et al., 1997), angiotensin-converting enzyme (ACE) inhibitors (enalapril and captopril) (Zhu et al., 2000), an anti-neoplastic agent (bestatin) and L-dopa (Tamai et al., 1998), as well as prodrugs such as valacyclovir and ganciclovir (Balimane et al., 1998; Ganapathy et al., 1998).
The present study represents the first study that specifically investigates potential ethanol-induced alterations of transport function in the human intestinal dipeptide transporter (hPepT1). We hypothesize that inhibition of the activity of this transporter could significantly reduce the absorption of nutrients, leading to the dietary and/or immunological deficiencies experienced by many alcoholics.
In the mammalian intestine, the transport of dipeptide is coupled with positively charged protons through hPepT1 inducing inward electrical current (Ganapathy and Leibach, 1991; Meredith and Boyd, 1995). Therefore, using an electrophysiological approach, we investigated the effects of ethanol on the absorption of dipeptides glycyl-sarcosine (Gly-Sar) and Ala-Ala by hPepT1, as well as an antibiotic (penicillin) and an ACE inhibitor (enalapril). The results demonstrate that ethanol inhibits hPepT1 absorption of dipeptides in a concentration-dependent manner, but does not inhibit the absorption of penicillin and enalapril.
MATERIALS AND METHODS
cDNA Construction and cRNA Synthesis
hPepT1 cDNA was subcloned into the eukaryotic expression vector pcDNA3 (Invitrogen, Carlsbad, CA) as previously described (Kulkarni et al., 2003a), and used as a template for cRNA synthesis. The hPepT1 plasmid was linearized with the restriction enzyme Bam-HI (New England BioLabs, Ipswich, MA). Transcription of the hPepT1 insert was performed using the mMESSAGE mMACHINE High Yield Capped RNA T7 Transcription Kit (Ambion Inc., Austin, TX).
Preparation of Oocytes and Expression of hPepT1
Oocytes were prepared as reported previously (Davies et al., 2005). Briefly, oocytes were excised from Xenopus laevis (Nasco, Ft, Atkinson, WI), enzymatically digested with 0.2% collagenase type 1A. Stage V and VI oocytes were selected and stored in incubation medium (in mM): NaCl 96, KCl 2, CaCl2 1, MgCl2 1, HEPES 5, theophilline 0.6, pyruvic acid 2.5 with 1% horse serum, and 0.05 mg/ml gentamycin, pH 7.5. The following day, oocytes were injected with approximately 50 ng cRNA encoding the hPepT1 transporter and stored in incubation medium at 18°C. Electrophysiological recordings were conducted between 3 and 10 days after cRNA injection. Noninjected oocytes were used as a control.
Electrophysiological Recordings
An 8-channel high throughput 2-electrode voltage clamp (TEVC) system (OpusXpress 6000; Molecular Devices, Union City, CA), which automates the impalement of oocytes, fluid delivery and current recording from 8 oocytes in parallel, was used to carry out all electrophysiological recordings. Oocytes were placed in 8 recording chambers (volume ~200 μl), super-perfused with modified Barth’s solution (in mM) (MBS, NaCl 88, KCl 1, CaCl2 0.91, Ca(NO3)2 0.33, NaHCO3 2.4, MgSO4 0.8, HEPES 10, pH 7.5) at a speed of 2 ml/min and impaled with 2 glass electrodes filled with 3 M KCl (1 to 2 mega ohms). To increase the inward current carried by protons the pH of MBS solution in the bath was reduced from 7.5 to 5.5 (Mackenzie et al., 1996) during the voltage application. The membrane potential was held at −70 mV, and currents were sampled at 10 KHz and filtered at 1 KHz while 11 voltage steps of 100 milliseconds (from +50 mV to −150 mV in −20 mV increments) were applied. The following protocol was utilized: first, currents at pH 7.5 (IMBS) were acquired; second, test solution 1 (pH 5.5 MBS) was delivered and currents were acquired (IpH5.5); third, test solution 2 (pH5.5 MBS plus substrate) was delivered and currents were acquired (IpH5.5+sub) and forth a 15-minute application of pH7.5 perfusion was applied to ensure that the substrate was completely washed out before further testing. Oocytes were exposed to test solutions for 90 seconds. For ethanol studies, ethanol was co-applied with pH 5.5 MBS in the absence of substrate to ensure that the reported concentration of ethanol in the oocyte bath was achieved. Next, the same concentration of ethanol was added to test solution 2 and applied to oocytes as described above. The maximum ethanol concentration utilized in the current study was 200 mM. We found that higher concentrations of ethanol in the presence of a pH of 5.5 resulted in the deterioration of the oocytes. The currents acquired in the presence or absence of substrates and with or without ethanol were stored on the computer for off-line analysis.
Data Analysis
The OpusXpress records currents from 8 oocytes in parallel. The currents between 70 and 90 millisecond were averaged and individually measured. The difference of the steady-state currents in the presence of substrates, with or without ethanol or at different pHs was used for analysis. The difference of the IpH5.5 + sub and IpH5.5 represents the substrate-induced current. To calculate the K0.5, Imax and IC50 we incorporated a custom written computer program that linked pClamp 9.0 software, MS Excel (Microsoft, Richmond, WA), and Prism (GraphPAD Software, San Diego, CA). Steady-state data were fitted to the following equation: I = ImaxSn/((K0.5)n + Sn), where I is the substrates evoked current, Imax is the derived current maximum, S is the concentration of substrates, n is the Hill coefficient, and K0.5 is the concentration of substrates which induced half maximal response. Data were compared using Student’s t-test, and a p-value of less than 0.05 was considered statistically significant.
Determination of Ethanol Concentrations in Rat Small Intestine
This protocol was obtained from the Research Center for Liver and Pancreatic Diseases at the University of Southern California. Ethanol (35% w/v, 3 g/kg body weight) was directly injected into rat stomach through a gavage needle. Under anesthesia with 5:1 mixture of ketamine (100 mg/ml, Warner-Lambert, Morris Plains, NJ) and xylazine (20 mg/ml, 1 ml/100 g body weight, Spectrum Chemical, Gardena, CA), the abdomen was completely opened and whole small intestine exposed. A #20 gauge plastic tubing was inserted into the jejunum and ileum separately at 60 minutes after ethanol injection to obtain liquids. The collected liquids were centrifuged at 1100 × g for 10 minutes, and supernatants were collected. The ethanol concentrations in the supernatants were measured using an alcohol analyzer (Model: Analyser GM, Analox Instruments, London, England).
Chemicals and Reagents
All chemicals and ethanol were USP grade or purer and were purchased from Sigma (St Louis, MO), unless otherwise indicated.
RESULTS
Effect of Ethanol on Gly-Sar-Induced Currents
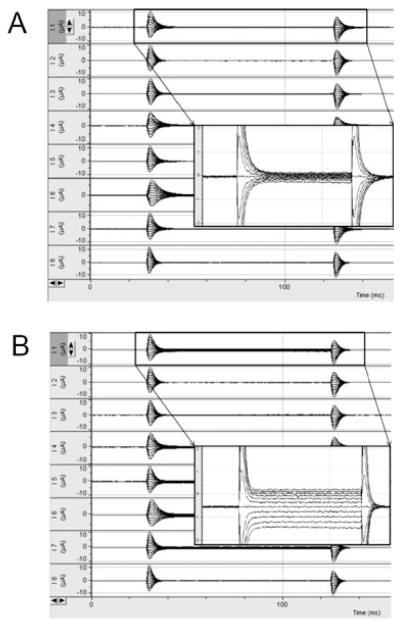
In a previous study using TEVC for evaluating the functional activity of hPepT1, we showed that the current induced by the model hPepT1 substrate, Gly-Sar, is voltage- and pH-dependent (Kulkarni et al., 2003a). Here, we used a similar approach to examine the effects of ethanol on hPepT1 activity. Figure 1 illustrates a representative 8-channel recording. Steady state currents were achieved within 30 milliseconds. In control experiments, 3 mM Gly-Sar induced a minimal, nonsignificant current (2.5 pA, n = 3) in uninjected oocytes.
Fig. 1.
Representative current traces obtained from 8 channel TEVC OpusXpress system. Inset shows a larger image of current traces. (A) current traces without Gly-Sar; (B) current traces with 3 mM Gly-Sar. Note that Ih at −70 mV decreases after the addition of Gly-Sar.
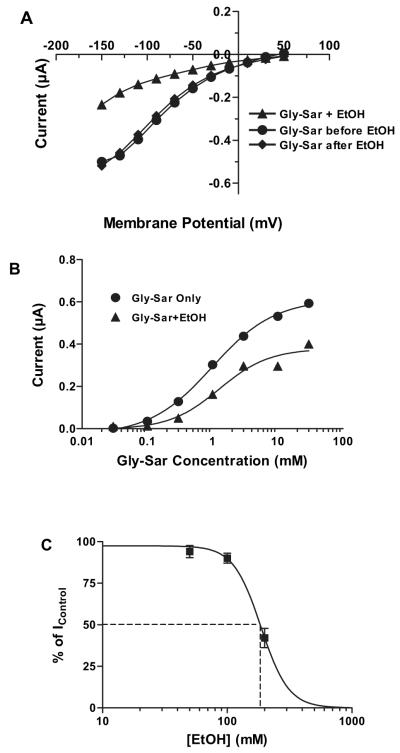
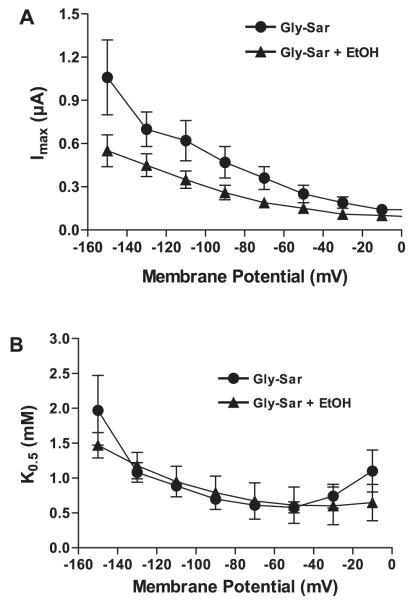
As illustrated in Fig. 2, Gly-Sar (3 mM) induced an inward current in a voltage-dependnt manner, and ethanol (200 mM) significantly inhibited the hPepT1 transport activity. After a 15-minute washout period to remove ethanol, Gly-Sar induced current completely recovered to the level of control (Fig. 2A). To investigate if ethanol affects the apparent affinity of Gly-Sar for hPepT1, 7 concentrations of Gly-Sar (0.03, 0.1, 0.3, 1, 3, 10, and 30 mM) were used to generate a concentration–response relationship in the absence and presence of ethanol (200 mM, which is IC50). The induced current increased with increasing concentrations of Gly-Sar. Ethanol (200 mM) inhibited the current with a more prominent inhibitory effect at higher Gly-Sar concentrations (Fig. 2B). The inhibitory effect was ethanol concentration dependent, with the current induced by Gly-Sar (3 mM) in the presence of 3 concentrations of ethanol (50, 100, and 200 mM) indicating an ethanol concentration for half-maximal inhibition (IC50) of 184 ± 5 mM at −110 mV (Fig. 2C). From these experiments, K0.5, Imax, and Hill coefficient values at −110 mV were calculated (Table 1). Ethanol significantly reduced the maximal transport capacity (Imax), but did not significantly affect the apparent affinity (K0.5 and Hill coefficient). Imax for Gly-Sar in the presence or absence of ethanol is voltage-dependent with a maximal value at more hyperpolarizing potentials (−150 mV) and a decreased value at lower membrane potentials (Fig. 3A). K0.5 for Gly-Sar reached a maximum at −150 mV and minimum at −50 mV, and ethanol had no significant effect on K0.5 at any membrane potential (Fig. 3B). Ethanol (200 mM) inhibition of Gly-Sar transport was not affected by concentrations of Gly-Sar from 0.2 to 20 mM or by changes in membrane potentials from −110 mV to −30 mV (Table 2).
Fig. 2.
Ethanol inhibits Gly-Sar-induced currents. (A) Representative traces showing the current-voltage relationship for inhibition of 3 mM Gly-Sar-induced currents by 200 mM ethanol at pH 5.5. (B) Gly-Sar concentration-response curves in the absence and presence of 200 mM ethanol. (C) Ethanol inhibition curve of 3 mM Gly-Sar-induced currents (n = 6 to 10).
Table 1.
Effect of Ethanol on the Imax, K0.5 and Hill Coefficient for Gly-Sar Transport by hPepT1
| Imax (μA)* | K0.5 (mM) | Hill coefficient | |
|---|---|---|---|
| No ethanol | 0.69 ± 0.18 | 1.0 ± 0.3 | 1.3 ± 0.1 |
| 200 mM ethanol | 0.40 ± 0.12 | 0.9 ± 0.1 | 1.3 ± 0.1 |
Imax, K0.5, and Hill coefficient were calculated in the presence of 3 mM Gly-Sar and with and without 200 mM ethanol. Membrane potential was −110 mV and pH 5.5; n = 4 to 9.
p < 0.01 for no ethanol versus 200 mM ethanol.
Fig. 3.
Ethanol reduces maximum current (Imax) but not K0.5.(A)Maximum current-voltage and (B) K0.5/voltage relationships (n = 4 to 9).
Table 2.
Effect of Gly-Sar Concentrations and Membrane Potential on % Ethanol (200mM) Inhibition of Gly-Sar Uptake by hPepT1 (n = 3 to 7)
| Membrane potential |
Gly-Sar concentration |
|||
|---|---|---|---|---|
| 0.2 mM | 1 mM | 5 mM | 20 mM | |
| −30 mV | 68 ± 13 | 68 ± 5 | 66 ± 4 | 70 ± 4 |
| −50 mV | 66 ± 12 | 63 ± 4 | 58 ± 4 | 63 ± 4 |
| −110 mV | 74 ± 13 | 63 ± 4 | 60 ± 3 | 64 ± 2 |
Gly-Sar-induced currents were obtained at different concentrations of Gly-Sar and membrane potentials in the presence of 200 mM ethanol (n = 3 to 7).
Effect of Ethanol on Ala-Ala-Induced Currents
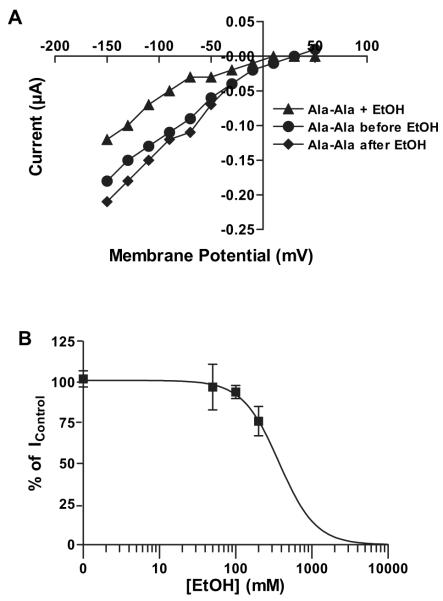
Gly-Sar is a nonnatural dipeptide that is widely used as a model substrate for hPepT1 as it is nonhydrolyzable. To determine if ethanol exerted similar inhibitory effects on transport of a natural dipeptide, we examined hPepT1 uptake of Ala-Ala. As there are no reported electrophysiological data for Ala-Ala transport by hPepT1, we first investigated the concentration–response relationship of Ala-Ala-induced currents. As shown in Fig. 4, Ala-Ala-induced currents are also voltage- and concentration-dependent. The apparent affinity of Ala-Ala was smaller (K0.5 = 101 ± 35 μM) and the Imax was larger (1.0 ± 0.1 μA) compared with those of Gly-Sar, and the Hill coefficient was 2.1 ± 0.4 (n = 4). Ethanol (200 mM) caused a reversible inhibitory effect on Ala-Ala-induced currents (Fig. 5A), similar to that for Gly-Sar. The inhibitory effect of ethanol was concentration-dependent, with an ethanol IC50 of 371 mM for uptake of 100 μM Ala-Ala (Fig. 5B).
Fig. 4.
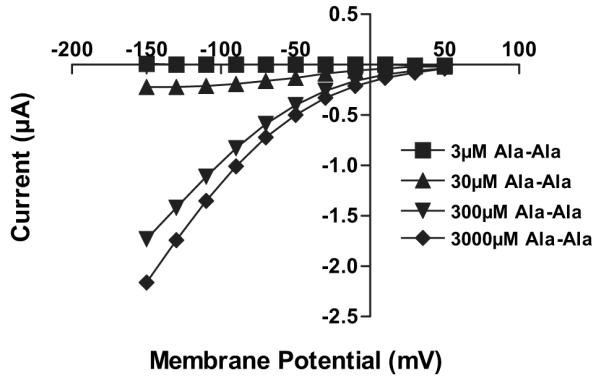
Current-voltage relationships of Ala-Ala-induced currents.
Fig. 5.
Ethanol inhibits Ala-Ala-induced currents. (A) Current-voltage relationship for inhibition of 100 μM Ala-Ala-induced currents by 200 mM ethanol. (B) Ethanol inhibition curve of 100 μM Ala-Ala-induced currents (n = 3 to 7).
Effect of Ethanol on Drug-Induced Currents
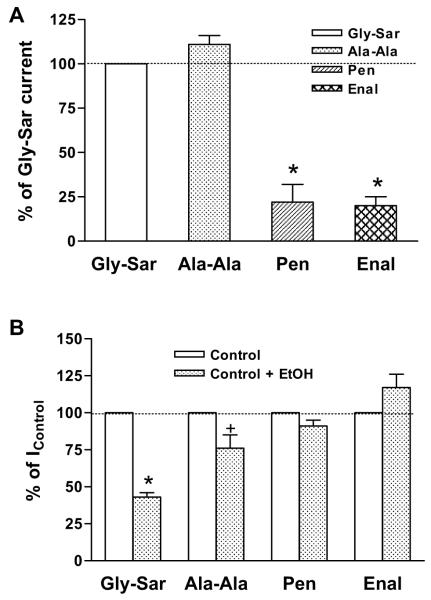
The experiments were repeated using penicillin and enalapril. Each drug induced a significantly smaller current than those induced by Gly-Sar and Ala-Ala at the same concentration (3 mM) (Fig. 6A). In contrast to the dipeptides, ethanol (200 mM) did not inhibit either penicillin- or enalaprilinduced currents (Fig. 6B).
Fig. 6.
Comparison of currents induced by dipeptides and drugs. (A) Gly-Sar-, Ala-Ala-, penicillin (Pen)- and enalapril (Enal)-induced currents. Concentration of all substrates was 3 mM and Gly-Sar-induced current was normalized as 100%. Data represent mean ± SEM, *p < 0.05 compared with Gly-Sar (n = 5 to 7). (B) Gly-Sar-, Ala-Ala-, penicillin- and enalapril-induced currents in the absence and presence of 200 mM ethanol. Currents obtained in the absence of ethanol were normalized as 100%. Data represent mean ± SEM, *p < 0.05, +p = 0.08 compared with Gly-Sar-induced current (n = 3 to 7).
Determination of the Ethanol Concentration in the Small Intestine of Rat
To determine if the ethanol IC50 shown in our oocyte experiments were physiologically relevant, we measured the concentrations of ethanol in liquid collected from the intestinal lumen and blood in vivo from 2 rats after ethanol (35% w/v, 3 g/kg body weight) was directly injected into the stomach through a gavage needle. The concentrations of ethanol were 384 mM in the jejunum and 36 mM in the ileum in one rat, and 36 mM in the jejunum and 34 mM in the ileum in the other rat at 60-minute postinjection. The ethanol concentrations in blood were 30 mM in both rats. The difference in ethanol concentration between the 2 rats in the jejunum is most likely due to the result of the sampling method. The fluid obtained from the small intestine for the ethanol concentration test was a mixture of ethanol, gastric, and intestinal fluids. Nonetheless, the high ethanol concentration found in one of the rats illustrates the potential for high ethanol concentration within the intestinal region that expresses the highest level of hPepT1.
DISCUSSION
The main findings of the present study are that ethanol reversibly inhibits hPepT1 transport of dipeptides, but does not affect the transport of 2 nondipeptide drugs. Transport mediated by PepT1 obeys the Michaelis–Menten equation, which is characterized by 2 parameters Imax and K0.5. Ethanol inhibition of Gly-Sar transport was characterized by a decrease in Imax by 36% with no change in the apparent affinity K0.5, and the extent of ethanol inhibition did not change for Gly-Sar concentrations from 0.2 to 20 mM. These results indicate that ethanol does not compete with the substrate for binding sites on the transporter. The reduced Imax could be due to a change in the number of the functional transporters available, or ethanol may have an allosteric effect on hPepT1 that decreases the transport efficiency.
The level of the hPepT1 transporter is influenced by hormonal regulation (Adibi, 2003; Sun et al., 2003; Thamotharan et al., 1999), diet (Erickson et al., 1995; Shiraga et al., 1999), and disease (Sundaram et al., 2005; Ziegler et al., 2002). Three mechanisms have been proposed for regulation of hPepT1 expression. First, induction of secondary messengers can alter hPepT1 expression as demonstrated by incubation with PMA (a PKC activator) and cAMP. In this work, over a timescale of minutes, PMA reduced Vmax but did not change Km(Brandsch et al., 1994; Muller et al., 1996). Second, alteration of translocation can alter hPepT1 expression. This work demonstrated that incubation with insulin for 60 minute increases Vmax without affecting Km, probably due to an insulin-mediated increase in trafficking of the transporter from intra-cellular pools to the apical membrane (Thamotharan et al., 1999). Finally, changes in expression of DNA and mRNA can alter hPepT1 expression. In this work, it was shown that incubation with thyroid hormone triiodothyronine (T3) or epidermal growth factor for 4 to 28 days decreases Vmax without any significant change in Km (Ashida et al., 2002; Nielsen et al., 2001).
In our current experiments, oocytes were exposed to ethanol for only 3 minutes; therefore, it is very unlikely that reduced DNA or mRNA expression could account for the ethanol-induced change in Vmax. Reduction of the number of functional transporters available in the apical membrane through reduced trafficking of hPepT1 from intracellular pools and/or by increasing the internalization of the transporter is also possible, but the timescale of the experiments suggests that this is also an unlikely explanation (Lee, 2000; Thamotharan et al., 1999). Moreover, the ethanol reduction in dipeptide transport versus the lack of the effect on penicillin and enalapril transport also argues against changes in the number of functional transporters on the cell membrane as a plausible reason for ethanol-induced changes in Vmax.
In a recent investigation of the ethanol effects on ligandgated ion channels expressed in oocytes, we found that a 1-minute exposure to ethanol potentiated the ATP-induced current in the purinergic P2X3 receptor and inhibited the ATP-induced current in the purinergic P2X4 receptor (Davies et al., 2005). The underlying mechanisms for both the positive and negative effects appear to be allosteric modulation by ethanol, and there may be a similar basis for the effect of ethanol on hPepT1.
The X-ray structure of the proton-coupled 12-membrane Escherichia coli-lac permease transporter (Abramson et al., 2007), which may be structurally related to hPepT1, has indicated that a large conformational shift may occur upon substrate transport. Partial computer models from several laboratories (Irie et al., 2005; Kulkarni et al., 2007; Mackenzie et al., 1996) have proposed that PepT1 undergoes a series of conformational changes upon binding of H+ and substrate. These changes result in a “flip-flop” of the protein, such that the substrate is exposed to and released into the cytosol (with concurrent translocation of the proton). The transporter then undergoes a reverse conformational change back to a pretransport case (Kulkarni et al., 2003b, 2007; Sala-Rabanal et al., 2006). The ethanol reduction of Vmax could be due to an effect of ethanol on any of these steps.
Ethanol is linked to several diseases, and alcoholism is a leading cause of malnutrition in developed countries. The severity of the negative effects of ethanol depends on the ethanol concentration and length of exposure. Ethanol concentrations in the intestine exceeding 2% will interfere with the active transport of nutrients, and concentrations exceeding 12.5% (which is the concentration in wine) will induce more extensive damage such as hemorrhage, structural changes and increased mucosal permeability (Bode and Bode, 1992; Preedy et al., 1993; Siegmund et al., 2005). Here, we have shown that the IC50 for ethanol inhibition of hPePT1 is 184 mM (~0.9%) for Gly-Sar and 371 mM (~1.7%) for Ala-Ala. Furthermore, these concentrations of ethanol are achievable in the intestine in rat, since 60 minute after the application of a single dose of ethanol (35% w/v, 3 g/kg body weight), which is about the concentration of spirits, the concentration reached 384 mM in the jejunum and 36 mM in the ileum. Note, in humans, the upper small intestine is a major organ of absorption for ethanol (see reviews, Baselt and Danhof, 1987; Rajendram and Preedy, 2005). It is conceivable that the concentration of ethanol in the jejunum can reach a value of 500 to 630 mM (~2.5 to 3%, w/v) after drinking 40 g of ethanol. This would be equivalent to consuming approximately 3 or 4 alcoholic beverages (Israel et al., 1969). Moreover, concentrations of ethanol could reach 1000 mM or higher (6.5 to 9.4%) after drinking 0.8 g/kg body weight of ethanol (see review, Rajendram and Preedy, 2005). Therefore, concentrations of ethanol in excess of the IC50 for inhibition of hPePT1 can reasonably occur physiologically, and such concentrations could affect the activity of the hPepT1 transporter and significantly reduce uptake of dipeptides, thereby causing nutrient deficiency.
We found that the nondipeptide substrates, penicillin and enalapril, induced much smaller currents than those induced by Gly-Sar and Ala-Ala did, and that ethanol did not affect the induced current for the nondipeptide drugs. The penicillin- and enalapril-induced currents were only about 20% of the dipeptide-induced currents at the same concentration (3 mM), consistent with their higher K0.5 (about 10 mM) of the nondipeptides (Poschet et al., 1999; Zhu et al., 2000); we determined that the natural dipeptide Ala-Ala has a K0.5 0.1 mM, and the K0.5 of Gly-Sar is 1 mM. At this time, we do not know if the differences in ethanol inhibition of Gly-Sar versus the penicillin or enalapril differ. The lack of an effect of ethanol on the transport of penicillin and enalapril could be because the nondipeptides have a different transport mechanism, compared to dipeptides, with this mechanism unaffected by ethanol. However, the growing body of knowledge regarding hPepT1-mediated transport argues for a single (albeit flexible) substrate binding site in the transporter, and so it is likely that all transported substrates have the same or similar basic mechanism. Hence, the lack of effect of ethanol on nondipeptide substrates most likely reflects a relative lack of sensitivity of the transporter for such substrates (as indicated by the reduced transport of such substrates, compared to dipeptides). That is, allosteric modulation of hPepT1 by ethanol is too subtle an effect to influence the transport of nondipeptide substrates, as the transport of these substrates already occurs through suboptimal conformational changes. Nonetheless, the observation that ethanol can influence dipeptide uptake is of importance from a pharmacological perspective, as the goal of transport-mediated oral delivery of drugs and prodrugs is to optimize the interaction and transport of designed substrates targeting hPepT1, and with increased transport efficiency, the allosteric effects of ethanol may become important.
The present study represents one of only a few studies that have begun to address the issue of ethanol/transport interactions, at the molecular level, for any of the nutritional uptake transporters. We found that ethanol reduces transport of dipeptides by reducing transport capacity, rather than competing for binding sites in human peptide transport, whereas, ethanol does not affect nondipeptide transport. The findings suggest difference in the manner of transport for nondipeptide substrates. Ethanol inhibition or alteration of transport function may be a primary causative factor contributing to both the nutritional deficits as well as the immunological deficiencies that many alcoholics experience including alcohol liver disease and brain damage. An increased understanding of the mechanism by which ethanol alters transport function can provide additional therapeutic strategies/targets for offsetting the effects of ethanol on nutrient transport.
ACKNOWLEDGMENTS
The authors thank Dr. Matthias A. Hediger for providing the hPepT1 cDNA, Miriam Fine and Mike Losorto for technical assistance. This work was supported by grants from the NIAAA/NIH AA013890 and AA013922, Research Center for Alcoholic Liver and Pancreatic Diseases (P50 AA 11999) and the University of Southern California School of Pharmacy.
REFERENCES
- Abramson J, Smirnova I, Kasho V, Verner G, Kaback HR, Iwata S. Structure and mechanism of the lactose permease of Escherichia coli. Science. 2007;301:610–615. doi: 10.1126/science.1088196. [DOI] [PubMed] [Google Scholar]
- Adibi SA. Regulation of expression of the intestinal oligopeptide transporter (Pept-1) in health and disease. Am J Physiol Gastrointest Liver Physiol. 2003;285:G779–G788. doi: 10.1152/ajpgi.00056.2003. [DOI] [PubMed] [Google Scholar]
- Ashida K, Katsura T, Motohashi H, Saito H, Inui K. Thyroid hormone regulates the activity and expression of the peptide transporter PEPT1 in Caco-2 cells. Am J Physiol Gastrointest Liver Physiol. 2002;282:G617–G623. doi: 10.1152/ajpgi.00344.2001. [DOI] [PubMed] [Google Scholar]
- Balimane PV, Tamai I, Guo A, Nakanishi T, Kitada H, Leibach FH, Tsuji A, Sinko PJ. Direct evidence for peptide transporter (PepT1)-mediated uptake of a nonpeptide prodrug, valacyclovir. Biochem Biophys Res Commun. 1998;250:246–251. doi: 10.1006/bbrc.1998.9298. [DOI] [PubMed] [Google Scholar]
- Baselt RC, Danhof IE. Disposition of alcohol in man. In: Garriott JC, editor. Medicolegal Aspects of Alcohol Determination in Biological Specimens. PGS Publishing Company; Littleton, Massachusetts: 1987. pp. 55–73. [Google Scholar]
- Bockman DE, Ganapathy V, Oblak TG, Leibach FH. Localization of peptide transporter in nuclei and lysosomes of the pancreas. Int J Pancreatol. 1997;22:221–225. doi: 10.1007/BF02788388. [DOI] [PubMed] [Google Scholar]
- Bode JC, Bode C. Alcohol malnutrition and the gastrointestinal tract. In: Watson RR, Watzl B, editors. Nutrition and Alcohol. CRC press; Boca Raton, FL: 1992. pp. 403–428. [Google Scholar]
- Bode C, Bode JC. Effect of alcohol consumption on the gut. Best Pract Res Clin Gastroenteral. 2003;17:575–592. doi: 10.1016/s1521-6918(03)00034-9. [DOI] [PubMed] [Google Scholar]
- Brandsch M, Miyamoto Y, Ganapathy V, Leibach FH. Expression and protein kinase C-dependent regulation of peptide/H+ co-transport system in the Caco-2 human colon carcinoma cell line. Biochem J. 1994;299:253–260. doi: 10.1042/bj2990253. [DOI] [PMC free article] [PubMed] [Google Scholar]
- Davies DL, Kochegarov AA, Kuo ST, Kulkarni AA, Woodward JJ, King BF, Alkana RL. Ethanol differentially affects ATP-gated P2X(3) and P2X(4) receptor subtypes expressed in Xenopus oocytes. Neuropharmacology. 2005;49:243–253. doi: 10.1016/j.neuropharm.2005.03.015. [DOI] [PubMed] [Google Scholar]
- Dean M, Hamon Y, Chimini G. The human ATP-binding cassette (ABC) transporter superfamily. J Lipid Res. 2001;42:1007–1017. [PubMed] [Google Scholar]
- Erickson RH, Gum JRJ, Lindstrom MM, McKean D, Kim YS. Regional expression and dietary regulation of rat small intestinal peptide and amino acid transporter mRNAs. Biochem Biophys Res Commun. 1995;216:249–257. doi: 10.1006/bbrc.1995.2617. [DOI] [PubMed] [Google Scholar]
- Fei Y, Kanai Y, Nussberger S, Ganapathy V, Leibach FH, Romero MF, Singh S, Boron WF, Hediger MA. Expression cloning of a mammalian proton-coupled oligopeptide transporter. Nature. 1994;368:563–566. doi: 10.1038/368563a0. [DOI] [PubMed] [Google Scholar]
- Ganapathy ME, Huang W, Wang H, Ganapathy V, Leibach FH. Vala-cyclovir: a substrate for the intestinal and renal peptide transporters PEPT1 and PEPT2. Biochem Biophys Res Commun. 1998;246:470–475. doi: 10.1006/bbrc.1998.8628. [DOI] [PubMed] [Google Scholar]
- Ganapathy V, Leibach FH. Proton-coupled solute transport in the animal cell plasma membrane. Curr Opin Cell Biol. 1991;3:695–701. doi: 10.1016/0955-0674(91)90043-x. [DOI] [PubMed] [Google Scholar]
- Gutjahr E, Gmel G, Rehm J. Relation between average alcohol consumption and disease: an overview. Eur Addict Res. 2001;7:117–127. doi: 10.1159/000050729. [DOI] [PubMed] [Google Scholar]
- Halsted CH. Nutrition and alcoholic liver disease. Semin Liver Dis. 2004;24:289–304. doi: 10.1055/s-2004-832941. [DOI] [PubMed] [Google Scholar]
- Hediger MA, Romero MF, Peng JB, Rolfs A, Takanaga H, Bruford DA. The ABCs of solute carriers: physiological, pathological and therapeutic implications of human membrane transport proteins introduction. Pflugers Arch Eur J Physiol. 2004;447:465–468. doi: 10.1007/s00424-003-1192-y. [DOI] [PubMed] [Google Scholar]
- Irie M, Terada T, Katsura T, Matsuoka S, Inui Ki. Computational modelling of H+−coupled peptide transport via human PEPT1. J Physiol. 2005;565:429–439. doi: 10.1113/jphysiol.2005.084582. [DOI] [PMC free article] [PubMed] [Google Scholar]
- Israel Y, Valenzuela JE, Salazar I, Ugarte G. Alcohol and amino acid transport in the human small intestine. J Nutr. 1969;98:222–224. doi: 10.1093/jn/98.2.222. [DOI] [PubMed] [Google Scholar]
- Kulkarni AA, Davies DL, Links JS, Patel LN, Lee VHL, Haworth IS. A charge pair interaction between Arg282 in transmembrane segment 7 and Asp341 in transmembrane segment 8 of hPepT1. Pharm Res. 2007;24:66–72. doi: 10.1007/s11095-006-9119-x. [DOI] [PubMed] [Google Scholar]
- Kulkarni AA, Haworth IS, Lee VHL. Transmembrane segment 5 of the dipeptide transporter hPepT1 forms a part of the substrate translocation pathway. Biochem Biophys Res Commun. 2003a;306:177–185. doi: 10.1016/s0006-291x(03)00926-4. [DOI] [PubMed] [Google Scholar]
- Kulkarni AA, Haworth IS, Uchiyama T, Lee VHL. Analysis of transmembrane segment 7 of the dipeptide transporter hPepT1 by cysteine-scanning mutagenesis. J Biol Chem. 2003b;278:51833–51840. doi: 10.1074/jbc.M308356200. [DOI] [PubMed] [Google Scholar]
- Lee VHL. Membrane transporters. Eur J Pharm Sci. 2000;11:S41–S50. doi: 10.1016/s0928-0987(00)00163-9. [DOI] [PubMed] [Google Scholar]
- Liang R, Fei YJ, Prasad PD, Ramamoorthy S, Han H, Yang-Feng TL, Hediger MA, Ganapathy V, Leibach FH. Human intestinal H+/peptide cotransporter cloning, Functional expression and chromosomal localization. J Biol Chem. 1995;270:6456–6463. doi: 10.1074/jbc.270.12.6456. [DOI] [PubMed] [Google Scholar]
- Mackenzie B, Loo DD, Fei Y, Liu WJ, Ganapathy V, Leibach FH, Wright EM. Mechanisms of the human intestinal H+ −coupled oligopeptide transporter hPEPT1. J Biol Chem. 1996;271:5430–5437. doi: 10.1074/jbc.271.10.5430. [DOI] [PubMed] [Google Scholar]
- Meredith D, Boyd CA. Oligopeptide transport by epithelial cells. J Membr Biol. 1995;145:1–12. doi: 10.1007/BF00233302. [DOI] [PubMed] [Google Scholar]
- Muller U, Brandsch M, Prasad PD, Fei YJ, Ganapathy V, Leibach FH. Inhibition of the H+/peptide cotransporter in the human intestinal cell line Caco-2 by cyclic AMP. Biochem Biophys Res Commun. 1996;218:461–465. doi: 10.1006/bbrc.1996.0082. [DOI] [PubMed] [Google Scholar]
- Nielsen CU, Amstrup J, Steffansen B, Frokjaer S, Brodin B. Epidermal growth factor inhibits glycylsarcosine transport and hPepT1 expression in a human intestinal cell line. Am J Physiol Gastrointest Liver Physiol. 2001;281:G191–G199. doi: 10.1152/ajpgi.2001.281.1.G191. [DOI] [PubMed] [Google Scholar]
- Poschet JF, Hammond SM, Fairclough PD. Characterisation of penicillin G uptake in human small intestinal brush border membrane vesicles. Gut. 1999;44:620–624. doi: 10.1136/gut.44.5.620. [DOI] [PMC free article] [PubMed] [Google Scholar]
- Preedy VR, Marway JS, Siddiq T, Ansari FA, Hashinm IA, Peters TJ. Gastrointestinal protein turnover and alcohol misuse. Drug Alcohol Depend. 1993;34:1–10. doi: 10.1016/0376-8716(93)90040-w. [DOI] [PubMed] [Google Scholar]
- Rajendram R, Preedy VR. Effect of alcohol consumption on the gut. Dig Dis. 2005;23:214–221. doi: 10.1159/000090168. [DOI] [PubMed] [Google Scholar]
- Rehm J, Rehn N, Room R, Monteiro M, Gmel G, Jernigan D, Frick U. The global distribution of average volume of alcohol consumption and patterns of drinking. Eur Addict Res. 2003;9:147–156. doi: 10.1159/000072221. [DOI] [PubMed] [Google Scholar]
- Sala-Rabanal M, Loo DDF, Hirayama BA, Turk E, Wright EM. Molecular interactions between dipeptides, drugs and the human intestinal H+ −oligopeptide cotransporter hPEPT1. J Physiol. 2006;574:149–166. doi: 10.1113/jphysiol.2006.107904. [DOI] [PMC free article] [PubMed] [Google Scholar]
- Shiraga T, Miyamoto KI, Tanaka H, Yamamoto H, Taketani Y, Morita K, Tamai I, Tsuji A, Takeda E. Cellular and molecular mechanisms of dietary regulation on rat intestinal H+/peptide transporter PepT1. Gastroenterology. 1999;116:354–362. doi: 10.1016/s0016-5085(99)70132-0. [DOI] [PubMed] [Google Scholar]
- Siegmund SV, Haas S, Singer MV. Animal models and their results in gastrointestinal alcohol research. Dig Dis. 2005;23:181–194. doi: 10.1159/000090165. [DOI] [PubMed] [Google Scholar]
- Sun B, Zhao X, Wang G, Li N, Li J. Changes of biological functions of dipeptide transporter (PepT1) and hormonal regulation in severe scald rats. World J Gastroenterol. 2003;9:2782–2785. doi: 10.3748/wjg.v9.i12.2782. [DOI] [PMC free article] [PubMed] [Google Scholar]
- Sundaram U, Wisel S, Coon S. Mechanism of inhibition of proton: dipeptide co-transport during chronic enteritis in the mammalian small intestine. Biochim Biophys Acta. 2005;1714:134–140. doi: 10.1016/j.bbamem.2005.06.007. [DOI] [PubMed] [Google Scholar]
- Tamai I, Nakanishi T, Hayashi K, Terano T, Sai Y, Shiraga T, Miyamoto K, Takenda E, Higashida H, Tsuji A. The predominant contribution of oligopeptide tranporter PepT1 to intestinal absorption of beta-lactam antibiotics in the rat small intestine. J Pharm Pharmacol. 1997;49:796–801. doi: 10.1111/j.2042-7158.1997.tb06115.x. [DOI] [PubMed] [Google Scholar]
- Tamai I, Nakanishi T, Nakahara H, Sai Y, Ganapathy V, Leibach FH, Tsuji A. Improvement of L-dopa absorption by dipeptidyl derivation, utilizing peptide transporter PepT1. J Pharm Sci. 1998;87:1542–1546. doi: 10.1021/js980186o. [DOI] [PubMed] [Google Scholar]
- Terada T, Shimada Y, Pan X, Kishimoto K, Sakurai T, Doi R, Onodera H, Katsura T, Imamura M, Inui Ki. Expression profiles of various transporters for oligopeptides, amino acids and organic ions along the human digestive tract. Biochem Pharmacol. 2005;70:1756–1763. doi: 10.1016/j.bcp.2005.09.027. [DOI] [PubMed] [Google Scholar]
- Thamotharan M, Bawani SZ, Zhou X, Adibi SA. Hormonal regulation of oligopeptide transporter Pept-1 in a human intestinal cell line. Am J Physiol Cell Physiol. 1999;276:C821–C826. doi: 10.1152/ajpcell.1999.276.4.C821. [DOI] [PubMed] [Google Scholar]
- Thamotharan M, Lombardo YB, Bawani SZ, Adibi SA. An active mechanism for completion of the final stage of protein degradation in the liver, lysosomal transport of dipeptides. J Biol Chem. 1997;272:11786–11790. doi: 10.1074/jbc.272.18.11786. [DOI] [PubMed] [Google Scholar]
- Zhu T, Chen X, Steel A, Hediger MA, Smith DE. Differential recognition of ACE inhibitors in Xenopus laevis oocytes expressing rat PEPT1 and PEPT2. Pharm Res. 2000;17:526–532. doi: 10.1023/a:1007556630189. [DOI] [PubMed] [Google Scholar]
- Ziegler TR, Fernandez-Estivariz C, Gu LH, Bazargan N, Umeakunne K, Wallace TM, Diaz EE, Rosado KE, Pascal RR, Galloway JR, Wilcox JN, Leader LM. Distribution of the H+/peptide transporter PepT1 in human intestine: up-regulated expression in the colonic mucosa of patients with short-bowel syndrome. Am J Clin Nutr. 2002;75:922–930. doi: 10.1093/ajcn/75.5.922. [DOI] [PubMed] [Google Scholar]


