Abstract
Purpose
The human dipeptide transporter (hPEPT1) facilitates transport of dipeptides and drugs from the intestine into the circulation. The role of transmembrane domain 10 (TMD10) of hPEPT1 in substrate translocation was investigated using cysteine-scanning mutagenesis with 2-Trimethylammonioethyl methanethiosulfonate (MTSET).
Methods
Each amino acid in TMD10 was mutated individually to cysteine, and transport of [3H]Gly-Sar was evaluated with and without MTSET following transfection of each mutant in HEK293 cells. Similar localization and expression levels of wild type (WT) hPEPT1 and all mutants were confirmed by immunostaining and biotinylation followed by western blot analysis.
Results
E595C- and G594C-hPEPT1 showed negligible Gly-Sar uptake. E595D-hPEPT1 showed similar uptake to WT-hPEPT1, but E595K- and E595R-hPEPT1 did not transport Gly-Sar. Double mutations E595K/R282E and E595R/R282E did not restore uptake. G594A-hPEPT1 showed similar uptake to WT-hPEPT1, but G594V-hPEPT1 eliminated uptake. Y588C-hPEPT1 showed uptake of 20% that of WT-hPEPT1. MTSET modification supported a model of TMD10 with an amphipathic helix from I585 to V600 and increased solvent accessibility from T601 to F605.
Conclusions
Our results suggest that G594 and E595 in TMD10 of hPEPT1 have key roles in substrate transport and that Y588 may have an important secondary mechanistic role.
Keywords: cysteine-scanning, human dipeptide transporter, protein structure-function, site-directed mutagenesis, transmembrane domain
INTRODUCTION
The human intestinal dipeptide transporter hPEPT1 (SLC15A1) is primarily expressed on the apical membrane of intestinal epithelial cells (1) and is responsible for the absorption of di- and tripeptides from the intestinal tract after enzymatic breakdown of dietary or endogenous proteins (2, 3). hPEPT1 also facilitates oral delivery of many drugs, including β-lactam antibiotics, angiotensin-converting enzyme (ACE) inhibitors, and antiviral and anticancer agents (4). The broad substrate specificity and high capacity makes hPEPT1 a target for delivery of drugs (5-7), but lack of knowledge of the tertiary structure has limited the rational design of drugs and prodrugs as substrates.
Human PepT1 (hPEPT1) is a 708-amino acid protein. Membrane topology (8) and hydropathy analysis (9) indicate that hPEPT1 contains 12 α-helical transmembrane domains (TMDs) linked by loops of varying sizes and with the N- and C-termini both located intracellularly (8,10). In the absence of an X-ray structure, computer-based approaches have been used to model the layout and orientation of TMDs of hPEPT1. A 3-D structure was proposed by Meredith et al. (11) utilizing homology modeling of rabbit PepT1 based on the X-ray structures of two bacterial transporters, and Pedretti et al.(12) have also built a model using a fragment-based homology approach. The alternative computational approach is to develop models for the substrate. For example, Biegel et al. (13) produced a 3D-QSAR model based on binding affinity constants of 10 dipeptides, 32 tripeptides and 6 β-lactam antibiotics, and Ekins et al.(14) have developed a pharmacophore for hPEPT1 inhibitors. The distinction between binding and transport has also been addressed by development of a pharmacophore capable of distinguishing these two properties of substrates (15).
Site-directed mutagenesis has been used to determine TMD orientations and key residues that play a role in hPEPT1 function (11,16-18). We have used mutagenesis in combination with the substituted cysteine accessibility method (SCAM) to show that TMDs 3, 5 and 7 form part of the substrate translocation pathway (19-21). Mutagenesis data has led to the proposal of substrate interactions with amino acids in TMD3 (Y91) (19) and TMD5 (Y167, N171 and S174) (21), and of a salt bridge between R282 in TMD7 and D341 in TMD8 that may be important in stabilizing the pre-transport state of the protein (22). Substitution of R282 with glutamate uncouples the co-transport of protons and substrates, and also generates a peptide-gated cation channel in rabbit PepT1 (23), with a model for substrate binding and translocation proposed based on this result (17).
Compared to other TMDs, there is relatively little information on TMD10 of hPEPT1. TMD10 is highly conserved among many species (24), and computer models (9,12) suggest that it may form part of the substrate channel. Mutagenesis of E595, which is located in the center of TMD10, to alanine abolishes hPEPT1 activity in HEK293 cells (9). In the current study, we investigated the role of TMD10 in the function of hPEPT1 using mutagenesis and SCAM analysis. The SCAM data support a model for TMD10 in which the helix is amphipathic over most of its length (from residue I585, the extracellular N terminus, to V600) with enhanced solvent accessibility for the five intracellular residues. Mutagenesis data suggest a primary role for E595 and a possible secondary role for Y588 in substrate transport, with a requirement for a small side chain at position 594.
MATERIALS AND METHODS
Materials
[3H]Glycyl-sarcosine (Gly-Sar) (250 mCi/mmol) was purchased from Moravek Biochemicals (Brea, CA). Cell culture media and supplies were obtained from Invitrogen. 2-Aminoethyl methanethiosulfonate hydrobromide (MTSEA) and [2-(trimethylammonium) ethyl]methanethiosulfonate bromide (MTSET) were purchased from Toronto Research Chemicals (Toronto, Ontario, Canada). Sulfo-NHS-LC-Biotin and streptavidin agarose resin were purchased from Pierce Biotech (Rockford, IL). All other reagents and chemicals were of the highest purity available commercially.
Site-Directed Mutagenesis
The pcDNA3-hPEPT1 plasmid (kindly provided by Dr. Matthias A. Hediger) was used as a template for all the mutagenesis reactions. It was made by ligating the 2,306 KpnI/BamHI fragment of hPEPT1 cDNA into the multiple cloning sites of pcDNA3 (Invitrogen, Carlsbad, CA). The Gene Editor site-directed mutagenesis kit (Promega Corp., Madison, WI) was used to generate all mutations according to the manufacturer’s protocol. The mutated cDNA was transformed into an E. coli strain, XL10-Glod ultracompetent cells, which is incapable of correcting mismatches. The transformed cells were then plated onto ampicillin Luria Broth plates and incubated overnight. Individual colonies obtained on the plates were amplified further. The plasmids were extracted using a QIAprep Spin Miniprep Kit (Qiagen) and were then subjected to DNA sequencing analysis to verify the mutations (Core Facilities of Norris Cancer Center, USC). The mutagenic primers are shown in Table I.
Table I.
Cysteine Scanning Mutants of TMD10 of hPEPT1
| Mutation | Codon change |
|---|---|
| Wild Type | NA |
| I585C | CCG to TGC |
| P586C | CAG to TGC |
| Q587C | GAG to TGC |
| Y588C | TAT to TGT |
| F589C | TTT to TGT |
| L590C | CTT to TGT |
| L591C | CTC to TGC |
| T592C | ACC to TGC |
| G594C | GGC to TGC |
| E595C | GAA to TGC |
| V596C | GTC to TGC |
| V597C | GTC to TGC |
| F598C | TTG to TGC |
| S599C | TCT to TGT |
| V600C | GTC to TGC |
| T601C | ACG to TGC |
| G602C | GGA to TGC |
| L603C | TTG to TGC |
| E604C | GAA to TGC |
| F605C | TTC to TGC |
A series of 20 cysteine-scanning mutant cDNAs was created by oligonucleotide-mediated site-directed mutagenesis of WT-hPEPT1 cDNA. Each of the 20 amino acid residues within TMD10 was individually mutated to a cysteine.
Cell Culture and Transient Transfection and Uptake Studies
The human embryonic kidney cell line, HEK293 cells (ATCC CRL-1573), was obtained from American Type Culture Collection. Cells were grown and maintained in Dulbecco’s modified Eagle’s medium (DMEM) supplemented with 10% fetal bovine serum (FBS), with penicillin and streptomycin (Invitrogen) at 37°C in a humidified atmosphere with 5% CO2. HEK293 cells were transfected with plasmid as described previously (9). The HEK293 cells were split into 24-well plates and grown overnight (>20 h) at 50–75% confluence. The medium was then removed and 500 μL of transfection solution was added to each well. The transfection solution was previously prepared with 400 μL of DMEM, 10% FBS, 50 μL of lipofectamine (Invitrogen, CA) and 50 μL of DNA (0.8 μg), and the mixture was incubated at 37°C for 30 min. The cells were grown overnight, and then the transfection solution was replaced with 500 μL of DMEM, 10% FBS and 10% antibiotics. After 72 h, cells were processed for [3H]-Gly-Sar uptake, Western blot analysis, and cell-surface biotinylation.
Immunolocalization
The procedure for immunofluorescence microscopy staining has been described in detail previously (25). Transfected or MOCK cells were plated onto coverslips and cultured for 48 h. The coverslips were then incubated with 3.7% formaldehyde in phosphate-buffered saline (PBS) at room temperature for 20 min. After washing 3 times with PBS, the coverslips were permeabilized with 0.5% Triton X-100 for 15 min, washed once, then blocked with 1% bovine serum in PBS at room temperature for 30 min. After washing once with 0.05% Tween 20 in PBS (PBST), the coverslips were incubated with primary antibodies for 2 h. After washing 3 times with PBST, they were incubated with FITC-conjugated secondary antibodies for 1 h. The coverslips were washed again with PBST (twice) and PBS (once). Finally, the coverslips were mounted onto slides with anti-fade medium and examined by fluorescence microscopy.
Cell Surface Biotinylation and Western Blotting
Surface proteins in HEK293 cells that were transfected with pcDNA3-hPEPT1 were biotinylated with EZ-Link Sulfo-NHS-LC-Biotin (1.5 mg/ml) in PBS for 30 min at 4°C. Cell lysates then were incubated with Streptavidin Agarose Resin to precipitate biotinylated proteins. The bound proteins were eluted with SDS sample buffer and were fractionated by electrophoresis on an 8% polyacrylamide electrophoresis gels, blotted onto Trans-Blot transfer medium pure nitro-cellulose membranes (Bio-Rad Laboratories, Hercules, CA), probed with affinity purified and anti-hPEPT1 primary antibody (Santa Cruz, CA) and visualized with secondary antibody and chemiluminescence. Mouse monoclonal anti-α1-integrin antibody was used as the positive control (Santa Cruz, CA).
Uptake Assay and Inhibition Studies with Sulfhydryl Reagents
Cell transfected with WT-hPEPT1 and mutant plasmids were used 72 h post-transfection to determine the uptake activity. Prior to the uptake measurements, the transfected HEK293 cells that adhered to the wells were washed with the transport medium (MTS-Tris, pH 6 buffer). Each well was then incubated for 10 min at 37°C with a solution containing [3H] Gly-Sar (0.5 μCi/mL) after pre-incubation with 1 mM MTSEA or 1 mM MTSET (Toronto Research Chemicals Inc., ON, Canada) for 10 min. After washing thrice in ice-cold MES-Tris (pH 6.0) buffer, the cells were lyzed in 1 mL lysis buffer (1%SDS). BCA protein assay reagents were used to determine the protein content of each well, and the cell-associated radioactivity was measured in a Beckman Liquid Scintillation Counter and Wallac MicroBeta Trilux microplate liquid scintillation counter from PerkinElmer Company. Mock-transfected and WT-hPEPT1 transfected HEK293 cells were used as negative and positive controls, respectively.
Molecular Modeling
Models of TMD10 were generated using in-house software (TMD). The structure was generated as a linear α-helix with standard bond lengths and angles and torsional angles of −57.0°, −47.0°, 180.0° and −168.0° for phi, psi, omega and chi1, respectively. The structure was visualized using WebLab ViewerPro (Accelrys Inc., San Diego, CA).
Data Analysis
Data for each experiment were obtained from cultured cells from at least two different batches. The n refers to the number of batches of cell cultures tested. Results are expressed as means ± SEM. Prism (GraphPAD Software, San Diego, CA) was used to perform curve fitting and statistical analyses. Data were assessed using t-tests, and one- or two-way ANOVA with Dunnett’s multiple comparison and a Bonferroni correction when warranted. Statistical significance was defined as p<0.05.
RESULTS
Mutagenesis and Cell Surface Expression
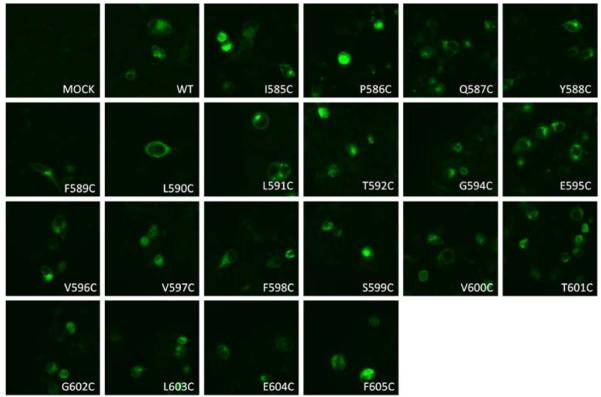
Excluding the endogenous cysteine 593 in TMD10, each of the other 20 residues in TMD10 of WT-hPEPT1 was individually mutated into a cysteine (Table I). Each mutated transporter was transiently transfected into HEK293 cells, and their membrane expression level was evaluated with immunofluorescence microscopy (Fig. 1). All the mutated transporter proteins exhibited similar plasma membrane expression compared with WT-hPEPT1.
Fig. 1.
Membrane localization of the wild type (WT) and mutated hPEPT1 transporters in transiently transfected HEK293 cells. 72 h post-transfection, the transfected HEK293 cells were subjected to immunofluorescence microscopy using affinity-purified rabbit anti-hPEPT1 primary antibody and FITC-conjugated secondary antibody, both at a dilution of 1:500.
Uptake Activity of Mutated Transporters
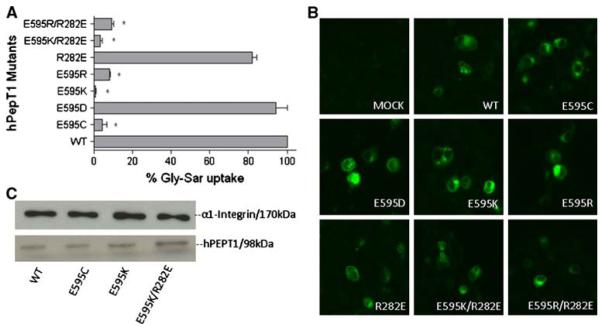
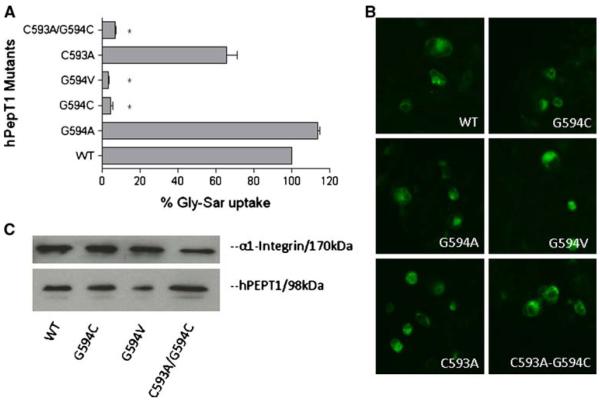
Gly-Sar uptake for each of the 20 mutated transporters is presented relative to that of WT-hPEPT1 in Fig. 2. Two of the 20 transporters (E595C- and G594C-hPEPT1) showed negligible uptake activity; one (Y588C-hPEPT1) showed about 20% activity; six (L591C-, T592C-, F598C-, S599C-, G602C- and F605C-hPEPT1) showed 25–35% activity; and the remaining transporters exhibited more than 50% Gly-Sar uptake compared with WT-hPEPT1. One obvious explanation for the significant differences in Gly-Sar uptake could be that the mutations caused incorrect synthesis or misfolding of the mutated proteins resulting in a reduction in hPEPT1 expression on the cell surface. To test for this possibility we utilized two different methods to measure the level of hPEPT1 expression on the cell surface. As shown in Figs. 3 and 4, the mutated transporters that did not show Gly-Sar uptake (E595C- and G594C-hPEPT1) and WT hPEPT1 had comparable cytosolic and surface membrane protein expression levels when measured in the transiently transfected HEK293 cells (Fig. 1). The immunofluorescence results were strengthened by a cell-surface biotinylation method and western blot analysis that also confirmed that E595C- and G594C-hPEPT1 (and transporters with several other mutations at these positions; see following sections) showed similar levels of surface expression of hPEPT1 (Figs. 3 and 4). Taken together, these results indicate that the single cysteine mutations at these two positions did not cause incorrect synthesis or misfolding of the mutated proteins. Therefore, the negligible Gly-Sar uptake of E595C- and G594C-hPEPT1 indicates a functional role of these residues in substrate transport.
Fig. 2.
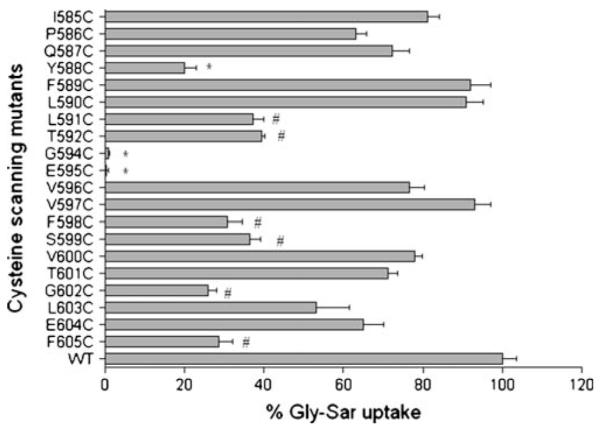
Percentage of Gly-Sar uptake activities of the cysteine-scanning mutants of TMD10 of hPEPT1. [3H]Gly-Sar uptake (0.5 μCi/ml, 10 min at 37°C) was measured 72 h post-transfection in HEK293 cells, individually transfected with cysteine-scanning mutants of TMD10 of hPEPT1. Results represent the % Gly-Sar uptake of each mutated transporter compared with WT-hPEPT1 (n=4–7). The background uptake values of mock-transfected HEK293 cells were subtracted. *, ≤ 20% specificactivity. #, 25–35% specificactivity.
Fig. 3.
Percentage Gly-Sar uptake and membrane expression of mutants at E595 of hPEPT1 in transiently transfected HEK293 cells after 72 h post-transfection. A [3H]Gly-Sar uptake (0.5 μCi/ml, 10 min at 37°C) was measured in HEK293 cells transfected with each mutated transporter.*, p<0.05 compared to WT-hPEPT1 uptake. B The membrane localization was visualized with affinity-purified rabbit anti-hPEPT1 primary antibody (1:200) and FTIC-conjugated secondary antibody (1:200). C The HEK293 cells with transfected proteins were biotinylated with sulfo-NHS-LC biotin for 30 min at room temperature. Immunoprecipitation was carried out followed by Western blot analysis using affinity-purified rabbit anti-hPEPT1 primary antibody (1:500) and was visualized using goat-anti-rabbit HRP conjugated secondary antibody (1:10,000) and chemiluminescence. α1-integrin (1:10,000) was used as the positive control.
Fig. 4.
Percentage Gly-Sar uptake and membrane expression of mutants at G594 of hPEPT1 in transiently transfected HEK293 cells after 72 h post-transfection. A [3H]Gly-Sar uptake (0.5 μCi/ml, 10 min at 37°C) was measured in HEK293 cells transfected with each mutated transporter.*, p<0.05 compared to WT-hPEPT1 uptake. B The membrane localization was visualized with affinity-purified rabbit anti-hPEPT1 primary antibody (1:200) and FTIC-conjugated secondary antibody (1:200). C The HEK293 cells with transfected proteins were biotinylated with sulfo-NHS-LC biotin for 30 min at room temperature. Immunoprecipitation was carried out followed by Western blot analysis using affinity-purified rabbit anti-hPEPT1 primary antibody (1:500) and was visualized using goat-anti-rabbit HRP conjugated secondary antibody (1:10,000) and chemiluminescence.
Mutations at E595
To probe the function of the glutamic acid at position 595, we generated mutations at this position using the primers shown in Table II. The results obtained for transporters carrying mutations at E595 are shown in Fig. 4.The mutated transporter in which negatively charged E595 is replaced with a neutral amino acid (E595C-hPEPT1) showed negligible Gly-Sar uptake. Substitution of the glutamic acid by another negatively charged amino acid (E595D-hPEPT1) resulted in uptake that did not significantly differ from that of WT-hPEPT1, but substitutions with a positively charged amino acid (E595K- and E595R-hPEPT1) eliminated Gly-Sar uptake. These results indicate the importance of a negative charge at position 595. We note that E595 is located in the center of TMD10 and may be spatially proximal to R282 in TMD7, which makes it possible that these two amino acids could form a charge pair. To examine this issue, charge-reversed double mutations E595X/R282E (X=K or R) were made using the primers shown in Table II. Neither E595K/R282E- nor E595R/R282E-hPEPT1 showed recovery of Gly-Sar uptake activity, suggesting that E595 and R282 do not form a salt bridge in the WT transporter. The lack of uptake for the double mutants is mainly due to the E595 mutation, since the R282E mutation only caused a small change in uptake compared to WT-hPEPT1 (Fig. 3).
Table II.
Site-Directed Amino Acid Mutations at E595 and G594 in TMD 10 of hPEPT1 and R282 in TMD7
| Mutation | Codon change |
|---|---|
| E595D | GAA to GAT |
| E595K | GAA to AAG |
| E595R | GAA to CGC |
| R282E | AGG to GAG |
| E595K/R282E | GAG-AAG to AGG-GAA |
| E595R/R282E | GAG-GGC to AGG-GAA |
| G594A | GGC to GCC |
| G594V | GGC to GTC |
| C593A | TGT to GCT |
| C593A/G594C | TGTGGC to GCTTGC |
Mutations at G594
The results obtained for transporters carrying mutations of G594 are shown in Fig. 4. As shown above, the G594C mutation resulted in negligible Gly-Sar uptake. This could be due to the additional volume of the cysteine side chain, or perhaps due to the establishment of a S-S bridge with the endogenous cysteine at position 593. Gly-Sar uptake was maintained at WT level by G594A-hPEPT1, but abolished by G594V-hPEPT1, which indicates that the size of the side chain at position 594 is functionally important. To examine the effect of the endogenous cysteine, Gly-Sar uptake by C593A-hPEPT1 and the doubly mutated C593A/G594C-hPEPT1 was tested. C593A-hPEPT1 showed slightly reduced uptake compared to WT-hPEPT1, but uptake by C593A/G594C-hPEPT1 was eliminated, indicating that the loss of uptake by G594C-hPEPT1 is not due to the influence of the endogenous C593.
Cysteine Modification by MTS Reagents
Previous work has shown that Gly-Sar uptake of WT-hPEPT1 in HEK293 cells is not changed significantly by pre-incubation with MTSET, despite the presence of 11 endogenous cysteines (21). Therefore, WT-hPEPT1 was used as a positive control in the current study. The 20 positions in TMD10 (excluding C593) were individually mutated to cysteine, and the solvent accessibilities of these cysteine residues were assessed to determine the position of the residues with respect to a putative aqueous substrate translocation pathway in the protein. This was achieved by measuring the specific uptake activities of these proteins after pre-incubation with MTSET (1 mM), which is a positively charged and membrane-impermeable sulfhydryl-specific reagent. The uptake activities of the 20 mutated transporters were compared in the presence and absence of MTSET (Fig. 5). Of the 11 mutated transporters that maintained Gly-Sar uptake of >50% of WT-hPEPT1, four (V596C-, T601C-, L603C- and E604C-hPEPT1) showed a significant reduction in transport of Gly-Sar after modification with MTSET (Fig. 5). Of the nine transporters in which mutations reduced Gly-Sar uptake to < 50%, two (L591C- and T592C- hPEPT1) showed a further significant reduction in uptake and one (G602C-hPEPT1) showed a significant increase in uptake following incubation with MTSET (Fig. 5).
Fig. 5.
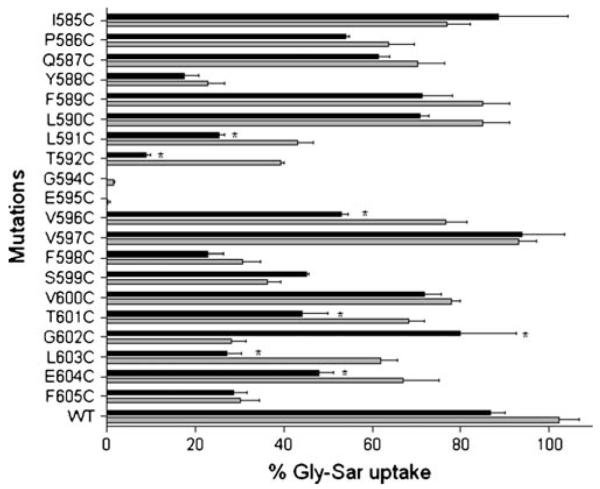
Effect of 1 mM MTSET on [3H]Gly-Sar uptake activities of the cysteine-scanning mutants of TMD10 of hPEPT1. At 72 h post-transfection, the transfected cells adhered to the wells were incubated for 10 min at 37°C with a solution containing [3H]Gly-Sar (0.5 μCi/ml) after pre-incubation with 1 mM MTSET for 10 min. After washing three times in ice-cold MES-Tris, pH 6.0 buffer, the cells were lysed in 1 ml of lysis buffer. BCA protein assay reagents were used to determine the protein content of each well, and the cell-associated radioactivity was measured in a Beckman liquid scintillation counter. Results represent the % Gly-Sar uptake of each mutated transporter compared with wild type hPEPT1 (n=4–7). The background uptake values of mock-transfected HEK293 cells were subtracted. The grey bars represent uptake activity in the absence of 1 mM MTSET, and the black bars represent uptake activities in the presence of 1 mM MTSET. *, highly significant inhibition of uptake activity by 1 mM MTSET.
Gly-Sar uptake by the 20 mutated transporters was also examined in the presence of MTSEA (1 mM), which is a membrane-permeable reagent that has a molecular volume about 60% that of MTSET. Pre-incubation with MTSEA caused a significant reduction in Gly-Sar uptake for the six transporters that showed decreased uptake with MTSET (L591C-, T592C-, V596C-, T601C-, L603C-, and E604C-hPEPT1) (Fig. 6). Furthermore, the significant increase in transport by G602C-hPEPT1 observed in the presence of MTSET was also seen with MTSEA (Fig. 6). Incubation with MTSEA also inhibited Gly-Sar uptake for four transporters (I585C-, P586C-, V597C- and V600C- hPEPT1) that were unaffected by MTSET. In addition, MTSEA had a significant effect on uptake of two transporters (F588C- and F605C- hPEPT1) with relatively low uptake in the absence of MTSEA. However, since we found a significant reduction in the uptake of WT-hPEPT1 with MTSEA (Fig. 6), interpretation of the MTSEA data requires caution, and these data were not used for development of a model of TMD10.
Fig. 6.
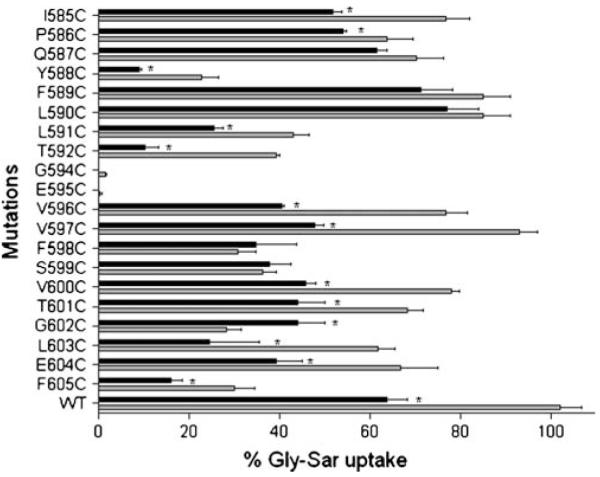
Effect of 1 mM MTSEA on [3H]Gly-Sar uptake activities of the cysteine-scanning mutants of TMD10 of hPEPT1. At 72 h post-transfection, the transfected cells adhered to the wells were washed with the transport medium (MES-Tris, pH 6 buffer). Each well was then incubated for 10 min at 37°C with a solution containing [3H]Gly-Sar (0.5 μCi/ml) after pre-incubation with 1 mM MTESA for 10 min. After washing three times in ice-cold HEPES-Tris, pH 7.4 buffer, the cells were lysed in 500 μl of lysis buffer. BCA protein assay reagents were used to determine the protein content of each well, and the cell-associated radioactivity was measured in a Beckman liquid scintillation counter. Results represent the % Gly-Sar uptake of each mutated transporter compared with wild type hPEPT1 (n=4–7). The background uptake values of mock-transfected HEK293 cells were subtracted. The grey bars represent uptake activity in the absence of 1 mM MTSEA, and the black bars represent uptake activities in the presence of 1 mM MTSEA. *, highly significant inhibition of uptake activity by 1 mM MTSEA.
Molecular Modeling
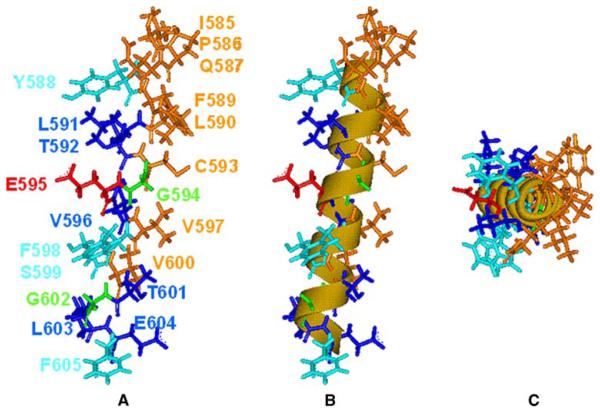
To provide a structural interpretation of the mutagenesis and cysteine modification data, we built a linear alpha-helix (phi=−57°, psi=−47°) to visualize the results (Fig. 7). This structure was built based on the MTSET modification results (Fig. 5) with the normal assumption in SCAM analysis that a reduction in substrate uptake in the presence of MTSET indicates solvent accessibility of the side chain carrying the cysteine mutation. Conversely, residues that are insensitive to MTSET (but still show substantial substrate uptake) are not solvent accessible. Application of these simple rules suggests that TMD10 is amphipathic for at least two-thirds of its length, starting from the extracellular N-terminus (Fig. 7). Exposure of MTSET to transporters with mutations at the eight residues colored brown in Fig. 7 (including C593; i.e. WT-hPEPT1) had no significant effect on Gly-Sar uptake, and these residues are all located on one side of TMD10. Four of these residues were modified by MTSEA (Fig. 6), which is lipid permeable. This indicates that the MTSEA data are consistent with the model, but we emphasize that these data were not used for development of the model. Three residues for which MTSET exposure influenced uptake (L591, T592, V596) are on the opposite (solvent-exposed) face of the helix (Fig. 7). We note that two of these residues are hydrophobic, but they are apparently located in a sufficiently solvent-exposed position to undergo MTSET modification.
Fig. 7.
A model for TMD10 based on mutagenesis and cysteine modification data. A A linear alpha-helix with the N terminus (extracellular) at the top of the figure, colored based on MTSET-modification and mutagenesis data: eight residues (brown) (including endogenous C593) for which Gly-Sar uptake was unaffected by MTSET; six residues (blue) for which uptake was significantly reduced by MTSET; four residues (light blue) for which uptake was significantly reduced by mutation to cysteine; glycine residues (green); and E595 (red). B The same model showing that the data fit to a linear alpha-helix. C The model viewed down the helical axis. In all three images, the putative substrate translocation pathway is on the left.
Construction of a linear helix based on the SCAM data places Y588, F598 and S599 (mutations of which had a significant influence on Gly-Sar uptake) on the solvent-exposed face and E595 (mutation of which abolished Gly-Sar uptake) in a position that is fully solvent exposed. The linearity of the helix is shown by the image in Fig. 7B, and the general amphipathicity is evident in Fig. 7C. The C-terminal region (T601-F605) of TMD10 seems to be fully exposed to solvent, which suggests tipping of the TMD with respect to the putative substrate pathway (Fig. 7). It is of note that G602 (which showed increased Gly-Sar uptake upon mutation to cysteine and exposure to MTSET) is oriented directly into this pathway in the model. We return to this structure below.
DISCUSSION
We have proposed a rudimentary computer model of hPEPT1 based on site-directed mutagenesis (9,26), in which transmembrane domains 1, 3, 5, 7 and 10 are proposed to form an aqueous substrate channel. Some elements of this model are consistent with the detailed homology model recently proposed by Pedretti et al. (2008) (12), including the location of TMDs 5, 7 and 10 adjacent to the translocation pathway. In attempts to validate our model, we have used SCAM data to propose that TMDs 3, 5 and 7 are tilted with respect to the substrate pathway (19-21). This conclusion was based on SCAM data showing that the extracellular parts of these TMDs are amphipathic and the intracellular regions are more solvent- (and substrate-) accessible. A similar conclusion can be drawn for TMD10 based on the data reported in the current study. In fact, the results for TMD10 are more conclusive than those for the three previously studied domains, with clear amphipathicity extending for at least two-thirds of TMD10 on the extracellular side and full solvent exposure for the intracellular amino acids. These results indicate that TMD10 has a tilted orientation in hPEPT1.
The SCAM approach (review, (27)), has been widely used to identify amino acid side chains that line the pore of membrane integrated channels and transporters. The principle behind this approach is that a covalent modification of a solvent-accessible cysteine side chain by a water-soluble reagent (MTSET in the current study) will cause a change that is detectable in a functional assay. This approach has been used for the human bile acid transporter (hASBT) (28-30), human glucose transporter (Glut) (31), and the TRP channel (32,33), as well as for hPEPT1 (19-21). An important caveat in the SCAM approach is that a cysteine side chain at a specific site could be modified by MTSET without causing a functional change, and that such a modification will be incorrectly interpreted as a lack of solvent accessibility at this site. For this reason, it is important to interpret SCAM data based on the overall pattern for a protein domain, and this is the approach that we took in assessing the probable orientation of TMD10 within hPEPT1.
The SCAM-based mapping of eight MTSET-inaccessible residues and three MTSET-accessible residues in the extracellular two-thirds of TMD10 allowed placement of other residues that could not be evaluated by the SCAM method due to the decreased or abolished Gly-Sar uptake upon mutation to cysteine. One such residue is E595, which is of interest since it is highly conserved between species (34-36) and is one of the few charged residues in the transmembrane region. From the topology model (8) E595 is predicted to be located in the center of TMD10, and the SCAM-based model of TMD10 places E595 oriented directly into the substrate pathway. We (9) and others (17,23) have suggested that E595 might be involved in binding of the substrate, possibly with the positively charged tail of the peptide (36), but evidence for the location of E595 has not been obtained. Previous studies have shown that transport function is abolished by mutation of E595 to alanine (9,11), and the current study showed that mutations of E595 to an oppositely charged amino acid abolished function. These results show that the presence of a negative charge at position 595 is important for the normal function of hPEPT1.
We have previously suggested that R282 in the intracellular half of TMD7 of hPEPT1 forms a salt bridge with D341 in TMD8 and that this salt bridge may be of importance in stabilizing the pre-transport state of the protein (22). Meredith et al. have shown that a positively charged residue at position 282 plays a role in PepT1 function by maintaining the stimulation of transport with an inwardly directed proton electrochemical gradient (17). Given these results, we wanted to determine if E595 might be involved in a salt bridge with R282. If such a salt bridge had a functional role, one might expect that the double mutant E595K(or R)/R282E would recover the loss of function caused by the E595K(or R) single mutation. However, the double mutant did not show an increase in uptake compared with the E595K and E595R mutants, which indicates that E595 and R282 are functionally independent of each other in the wild-type protein.
Mutation of G594 to cysteine also resulted in complete abolition of Gly-Sar uptake by hPEPT1. Glycine is a small and flexible amino acid that often has a specialized structural role in protein architecture and function. The flexibility of G594 may play a role in hPEPT1 function or there may be a size requirement for a small side chain at this position to allow full substrate access to E595. The results for G594A-, G594V- and G594C-hPEPT1 indicated that alanine is tolerated at this position, but mutation to cysteine and valine abolished function, which suggests that there may be a size requirement at position 594. It is unclear if this size requirement reflects direct blocking of the putative substrate interaction with E595 or a limitation on protein conformational change that hinders the translocation mechanism.
Mutation to cysteine at several positions caused a significant loss of Gly-Sar uptake without causing complete abolition of uptake. In particular, Y588C-hPEPT1 showed about 20% uptake activity compared to WT-hPEPT1. Y588 is located close to the extracellular side of TMD10 and has been suggested to participate in initial substrate binding (9,17). Pedretti et al.(12) have proposed a key substrate binding site involving the Y588 side chain based on homology modeling and substrate docking. The location of Y588 in our model of TMD10 is consistent with this proposal, but we suggest that Y588 may be an early substrate binding site (perhaps a gate for initial substrate selection or rejection), from which the substrate then moves through the channel and may contact E595, which our results show is directly oriented into the substrate translocation pathway. Collectively, these data may provide an initial glimpse into the motion of a substrate as it moves through the hPEPT1 transporter.
ACKNOWLEDGMENTS
We thank Miriam Fine for technical assistance. This work was supported in part by research grants NIAAA/NIH AA013890 (DLD), AA013922 (DLD), and the USC School of Pharmacy.
ABBREVIATIONS
- Gly-Sar
glycyl-sarcosine
- hPEPT1
human dipeptide transporter
- MTSEA
2-Aminoethyl Methanethiosulfonate
- MTSET
2-Trimethylammonioethyl Methanethiosulfonate
- TMD
transmembrane domain
REFERENCES
- 1.Liang R, Fei YJ, Prasad PD, Ramamoorthy S, Han H, Yang-Feng TL, et al. Human intestinal H+/peptide cotransporter. Cloning, functional expression, and chromosomal localization. J Biol Chem. 1995;270:6456–63. doi: 10.1074/jbc.270.12.6456. [DOI] [PubMed] [Google Scholar]
- 2.Ganapathy V, Burckhardt G, Leibach FH. Characteristics of glycylsarcosine transport in rabbit intestinal brush-border membrane vesicles. J Biol Chem. 1984;259:8954–9. [PubMed] [Google Scholar]
- 3.Thwaites DT, Hirst BH, Simmons NL. Substrate specificity of the di/tripeptide transporter in human intestinal epithelia (Caco-2): identification of substrates that undergo H(+)-coupled absorption. Br J Pharmacol. 1994;113:1050–6. doi: 10.1111/j.1476-5381.1994.tb17099.x. [DOI] [PMC free article] [PubMed] [Google Scholar]
- 4.Terada T, Inui K. (Section A: molecular, structural, and cellular biology of drug transporters) Peptide transporters: structure, function, regulation and application for drug delivery. Curr Drug Metab. 2004;5:85–94. doi: 10.2174/1389200043489153. [DOI] [PubMed] [Google Scholar]
- 5.Zhang EY, Phelps MA, Cheng C, Ekins S, Swaan PW. Modeling of active transport systems. Adv Drug Deliv Rev. 2002;54:329–54. doi: 10.1016/s0169-409x(02)00007-8. [DOI] [PubMed] [Google Scholar]
- 6.Zhang EY, Knipp GT, Ekins S, Swaan PW. Structural biology and function of solute transporters: implications for identifying and designing substrates. Drug Metab Rev. 2002;34:709–50. doi: 10.1081/dmr-120015692. [DOI] [PubMed] [Google Scholar]
- 7.Martinez MN, Amidon GL. A mechanistic approach to understanding the factors affecting drug absorption: a review of fundamentals. J Clin Pharmacol. 2002;42:620–43. doi: 10.1177/00970002042006005. [DOI] [PubMed] [Google Scholar]
- 8.Covitz KM, Amidon GL, Sadee W. Membrane topology of the human dipeptide transporter, hPEPT1, determined by epitope insertions. Biochemistry. 1998;37:15214–21. doi: 10.1021/bi981128k. [DOI] [PubMed] [Google Scholar]
- 9.Bolger MB, Haworth IS, Yeung AK, Ann D, von Grafenstein H, Hamm-Alvarez S, et al. Structure, function, and molecular modeling approaches to the study of the intestinal dipeptide transporter PepT1. J Pharm Sci. 1998;87:1286–1291. doi: 10.1021/js980090u. [DOI] [PubMed] [Google Scholar]
- 10.Hagting A, vd Velde J, Poolman B, Konings WN. Membrane topology of the di- and tripeptide transport protein of Lactococcus lactis. Biochemistry. 1997;36:6777–85. doi: 10.1021/bi963068t. [DOI] [PubMed] [Google Scholar]
- 11.Meredith D, Price RA. Molecular modeling of pept1—towards a structure. J Membr Biol. 2006;213:79–88. doi: 10.1007/s00232-006-0876-6. [DOI] [PubMed] [Google Scholar]
- 12.Pedretti A, De Luca L, Marconi C, Negrisoli G, Aldini G, Vistoli G. Modeling of the intestinal peptide transporter hPepT1 and analysis of its transport capacities by docking and pharmacophore mapping. ChemMedChem. 2008;3:1913–21. doi: 10.1002/cmdc.200800184. [DOI] [PubMed] [Google Scholar]
- 13.Biegel A, Gebauer S, Hartrodt B, Brandsch M, Neubert K, Thondorf I. Three-dimensional quantitative structure-activity relationship analyses of β-lactam antibiotics and tripeptides as substrates of the mammalian H+/peptide cotransporter PEPT1. J Med Chem. 2005;48:4410–9. doi: 10.1021/jm048982w. [DOI] [PubMed] [Google Scholar]
- 14.Ekins S, Johnston JS, Bahadduri P, D’Souza VM, Ray A, Chang C, et al. In vitro and pharmacophore-based discovery of novel hPEPT1 inhibitors. Pharm Res. 2005;22:512–7. doi: 10.1007/s11095-005-2505-y. [DOI] [PubMed] [Google Scholar]
- 15.Vig BS, Stouch TR, Timoszyk JK, Quan Y, Wall DA, Smith RL, et al. Human PEPT1 pharmacophore distinguishes between dipeptide transport and binding. J Med Chem. 2006;49:3636–44. doi: 10.1021/jm0511029. [DOI] [PubMed] [Google Scholar]
- 16.Daniel H. Molecular and integrative physiology of intestinal peptide transport. Annu Rev Physiol. 2004;66:361–84. doi: 10.1146/annurev.physiol.66.032102.144149. [DOI] [PubMed] [Google Scholar]
- 17.Pieri M, Hall D, Price R, Bailey P, Meredith D. Site-directed mutagenesis of Arginine 282 suggests how protons and peptides are co-transported by rabbit PepT1. Int J Biochem Cell Biol. 2008;40:721–30. doi: 10.1016/j.biocel.2007.10.010. [DOI] [PMC free article] [PubMed] [Google Scholar]
- 18.Rubio-Aliaga I, Daniel H. Peptide transporters and their roles in physiological processes and drug disposition. Xenobiotica. 2008;38:1022–42. doi: 10.1080/00498250701875254. [DOI] [PubMed] [Google Scholar]
- 19.Links JL, Kulkarni AA, Davies DL, Lee VH, Haworth IS. Cysteine scanning of transmembrane domain three of the human dipeptide transporter: implications for substrate transport. J Drug Target. 2007;15:218–25. doi: 10.1080/10611860701267491. [DOI] [PubMed] [Google Scholar]
- 20.Kulkarni AA, Haworth IS, Uchiyama T, Lee VH. Analysis of transmembrane segment 7 of the dipeptide transporter hPepT1 by cysteine-scanning mutagenesis. J Biol Chem. 2003;278:51833–40. doi: 10.1074/jbc.M308356200. [DOI] [PubMed] [Google Scholar]
- 21.Kulkarni AA, Haworth IS, Lee VH. Transmembrane segment 5 of the dipeptide transporter hPepT1 forms a part of the substrate translocation pathway. Biochem Biophys Res Commun. 2003;306:177–85. doi: 10.1016/s0006-291x(03)00926-4. [DOI] [PubMed] [Google Scholar]
- 22.Kulkarni AA, Davies DL, Links JS, Patel LN, Lee VH, Haworth IS. A charge pair interaction between Arg282 in transmembrane segment 7 and Asp341 in transmembrane segment 8 of hPepT1. Pharm Res. 2007;24:66–72. doi: 10.1007/s11095-006-9119-x. [DOI] [PubMed] [Google Scholar]
- 23.Meredith D. Site-directed mutation of arginine 282 to glutamate uncouples the movement of peptides and protons by the rabbit proton-peptide cotransporter PepT1. J Biol Chem. 2004;279:15795–8. doi: 10.1074/jbc.M313922200. [DOI] [PubMed] [Google Scholar]
- 24.Rønnestad I, Gavaia PJ, Viegas CS, Verri T, Romano A, Nilsen TO, et al. Oligopeptide transporter PepT1 in Atlantic cod (Gadus morhua L.): cloning, tissue expression and comparative aspects. J Exp Biol. 2007;210:3883–96. doi: 10.1242/jeb.007898. [DOI] [PubMed] [Google Scholar]
- 25.Yeung AK, Basu SK, Wu SK, Chu C, Okamoto CT, Hamm-Alvarez SF, et al. Molecular identification of a role for tyrosine 167 in the function of the human Intestinal proton-coupled dipeptide transporter (hPepT1) Biochem Biophys Res Commun. 1998;250:103–7. doi: 10.1006/bbrc.1998.9283. [DOI] [PubMed] [Google Scholar]
- 26.Lee VH, Chu C, Mahlin ED, Basu SK, Ann DK, Bolger MB, et al. Biopharmaceutics of transmucosal peptide and protein drug administration: role of transport mechanismswitha focusonthe involvement of PepT1. J Control Rel. 1999;62:129–40. doi: 10.1016/s0168-3659(99)00030-9. [DOI] [PubMed] [Google Scholar]
- 27.Karlin A, Akabas MH. Substituted-cysteine accessibility method. Methods Enzymol. 1998;293:123–45. doi: 10.1016/s0076-6879(98)93011-7. [DOI] [PubMed] [Google Scholar]
- 28.Zhang EY, Phelps MA, Banerjee A, Khantwal CM, Chang C, Helsper F, et al. Topology scanning and putative three-dimensional structure of the extracellular binding domains of the apical sodium-dependent bile acid transporter (SLC10A2) Biochemistry. 2004;43:11380–92. doi: 10.1021/bi049270a. [DOI] [PubMed] [Google Scholar]
- 29.Hussainzada N, Banerjee A, Swaan PW. Transmembrane domain VII of the human apical sodium-dependent bile acid transporter ASBT (SLC10A2) lines the substrate translocation pathway. Mol Pharmacol. 2006;70:1565–74. doi: 10.1124/mol.106.028647. [DOI] [PubMed] [Google Scholar]
- 30.Khantwal CM, Swaan PW. Cytosolic half of transmembrane domain IV of the human bile acid transporter hASBT (SLC10A2) forms part of the substrate translocation pathway. Biochemistry. 2008;47:3606–14. doi: 10.1021/bi702498w. [DOI] [PubMed] [Google Scholar]
- 31.Mueckler M, Makepeace C. Model of the exofacial substrate-binding site and helical folding of the human Glut1 glucose transporter based on scanning mutagenesis. Biochemistry. 2009 doi: 10.1021/bi900521n. [Epub ahead of print] [DOI] [PMC free article] [PubMed] [Google Scholar]
- 32.Dodier Y, Banderali U, Klein H, Topalak O, Dafi O, Simoes M, et al. Outer pore topology of the ECaC-TRPV5 channel by cysteine scan mutagenesis. J Biol Chem. 2004;279:6853–62. doi: 10.1074/jbc.M310534200. [DOI] [PubMed] [Google Scholar]
- 33.Voets T, Janssens A, Droogmans G, Nilius B. Outer pore architecture of a Ca2+-selective TRP channel. J Biol Chem. 2004;279:15223–30. doi: 10.1074/jbc.M312076200. [DOI] [PubMed] [Google Scholar]
- 34.Saito H, Okuda M, Terada T, Sasaki S, Inui K. Cloning and characterization of a rat H+/peptide cotransporter mediating absorption of beta-lactam antibiotics in the intestine and kidney. J Pharmacol Exp Ther. 1995;275:1631–7. [PubMed] [Google Scholar]
- 35.Zhang EY, Emerick RM, Pak YA, Wrighton SA, Hillgren KM. Comparison of human and monkey peptide transporters: PEPT1 and PEPT2. Mol Pharm. 2004;1:201–10. doi: 10.1021/mp0499712. [DOI] [PubMed] [Google Scholar]
- 36.Bailey PD, Boyd CA, Bronk JR, Collier ID, Meredith D, Morgan KM, et al. How to make drugs orally active: a substrate template for peptide transporter PepT1. Angew Chem Int Ed Engl. 2000;39:505–8. doi: 10.1002/(sici)1521-3773(20000204)39:3<505::aid-anie505>3.0.co;2-b. [DOI] [PubMed] [Google Scholar]


