

This work describes a novel method for imaging cell anatomy and cell wall features by scanning electron microscopy. The method was used to image sieve plates and sieve element geometry at high resolution to correlate sieve tube–specific conductivity with phloem flow measurements.
Abstract
Sieve elements are one of the least understood cell types in plants. Translocation velocities and volume flow to supply sinks with photoassimilates greatly depend on the geometry of the microfluidic sieve tube system and especially on the anatomy of sieve plates and sieve plate pores. Several models for phloem translocation have been developed, but appropriate data on the geometry of pores, plates, sieve elements, and flow parameters are lacking. We developed a method to clear cells from cytoplasmic constituents to image cell walls by scanning electron microscopy. This method allows high-resolution measurements of sieve element and sieve plate geometries. Sieve tube–specific conductivity and its reduction by callose deposition after injury was calculated for green bean (Phaseolus vulgaris), bamboo (Phyllostachys nuda), squash (Cucurbita maxima), castor bean (Ricinus communis), and tomato (Solanum lycopersicum). Phloem sap velocity measurements by magnetic resonance imaging velocimetry indicate that higher conductivity is not accompanied by a higher velocity. Studies on the temporal development of callose show that small sieve plate pores might be occluded by callose within minutes, but plants containing sieve tubes with large pores need additional mechanisms.
INTRODUCTION
The phloem of higher plants has multiple functions in plant development, reproduction, signaling, and growth. Münch (1930) proposed that the distribution of photoassimilates throughout the plant body is driven by an osmotically generated pressure difference between sources and sinks. Provided sieve tubes are symplasmically continuous (Kallarackal and Milburn, 1983; Sjolund et al., 1983; Knoblauch and van Bel, 1998; Fisher, 2000; Eckardt, 2001), the spatial separation in solute loading and unloading results in an osmotically generated pressure flow (Fisher, 2000; Minchin et al., 2002; Hafke et al., 2005).
Sieve tube structure has a direct effect on phloem translocation due to the frictional interactions that develop between flowing sap and stationary walls. Although a number of studies have modeled phloem translocation and flow rates through sieve tubes (Thompson and Holbrook, 2003b; Minchin and Lacointe, 2005; Pickard and Abraham-Shrauner, 2009), limited anatomical resolution makes these estimates uncertain at best. In particular, sieve plates are estimated to decrease the axial conductivity of the phloem by as much as 85% (Thompson and Holbrook, 2003a). More precise quantitative characterizations of sieve plate structure are widely recognized as essential for evaluating phloem function (Thompson, 2005, 2006; Windt et al., 2006).
Thompson and Holbrook (2003b) derived an equation based on fluid mechanical principles for stationary, laminar, and low Reynolds number flow. The equation generates a rough estimate of the conductivity of sieve tubes, called sieve tube–specific conductivity or k (μm2):
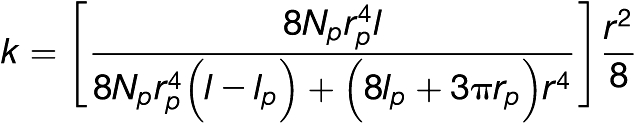 |
where Np is the number of sieve pores per sieve plate, r (μm) is sieve element radius, l (μm) is sieve element length, rp (μm) is sieve pore radius, and lp is sieve plate thickness. The accuracy of measurements by light microscopy (including confocal microscopy) in previous studies was sufficient to determine l and r. However, due to their small size, lp, Np, and rp have only been estimated, for example, based on fluorescence micrographs after aniline blue staining (e.g., Thompson and Wolniak, 2008).
Previous investigations have used either transmission electron microscopy (TEM) or light (mainly fluorescence) microscopy. Although TEM produces excellent resolution, the images are two dimensional. Serial sectioning and analysis of numerous individual micrographs would be necessary to reconstruct the three-dimensional structure of an individual sieve plate. Accurate measurements by bright-field or fluorescence microscopy are prevented by the small size of sieve plates, of sieve pores, and especially of the callose depositions, which are almost always below the resolution of light microscopy.
Scanning electron microscopy allows for rapid, three-dimensional imaging of surfaces and seems to be the method of choice to image sieve plates. However, to date, there is no preparation method available for satisfying high-resolution imaging of sieve plates by scanning electron microscopy.
Because of the high sugar concentration in sieve tubes, the evolution of occlusion mechanisms to prevent excessive assimilate loss in case of injury is of fundamental importance. Since sieve plates contain the smallest constrictions in the fluidic channel, occlusion mechanisms that target plate conductivity will be most efficient. Callose, a β-1,3 glucan, has been found deposited in the apoplast around sieve plate pores after sieve element injury. Callose deposition may decrease the sieve pore diameter to the point of full occlusion. In 1885, Fischer reported that sieve plates in excised tissue that had been killed and fixed by boiling showed less callose deposition than sieve plates that had not been boiled before examination (Fischer, 1885). Subsequent investigations supported the notion that callose is formed in response to mechanical injury (Esau and Cheadle, 1961; Evert and Derr, 1964; Eschrich, 1975) and that the process can occur within seconds (Currier, 1957; Eschrich, 1965). Reductions of phloem conductivity after heat treatment (McNairn and Currier, 1968; McNairn, 1972) or localized chilling (Giaquinta and Geiger, 1973; Peuke et al., 2006) were also traced back to sieve plate pore constriction by callose formation. Investigations of callose formation by fluorescence intensity measurements suggested that burning leaf tips leads to distant callose formation (Furch et al., 2007). However, distant callose formation was not detected when leaves were mechanically injured.
Recently, there has been increasing evidence that callose deposition on sieve plates is an important mechanism for host resistance against phloem-feeding pests (Ton and Mauch-Mani, 2004; Hao et al., 2008). Because of these and numerous earlier investigations, it appears that the size of sieve plate pores and their constriction by callose to reduce flux rates has a major impact on whole-plant performance. However, to date, there are no quantitative data available on the rate of callose deposition and its impact on phloem flux rate reduction.
Our aim in this study was (1) to develop a method to gently remove the cytoplasm of living cells to expose their cell walls for high-resolution scanning electron microscopy imaging, (2) to acquire accurate anatomical parameters to calculate sieve tube–specific conductivity in uninjured sieve elements, (3) to measure flow velocities by noninvasive magnetic resonance imaging (MRI; Van As, 2007; Van As et al., 2009) to compare conductivity with actual flow, and (4) to determine time courses of callose deposition on sieve plates following injury to compute changes of k over time.
RESULTS
Enzymatic Digest of the Cytoplasm to Expose the Cell Wall
Most published investigations into three-dimensional cell wall structure conducted by scanning electron microscopy and recently by atomic force microscopy focused on dead, woody tissue. In this case, the plant itself, sometimes assisted by microorganisms, clears the cell walls of cytoplasmic constituents once the cells undergo programmed cell death. However, investigations of wall structure in the living state of the tissue require removal of the cytoplasm to expose the cell wall. Sugimoto et al. (2000) compared several procedures in fixed and cryosectioned Arabidopsis thaliana root epidermis cells and found that 0.1% sodium hypochlorite removed cytoplasmic material efficiently, allowing investigations of cell wall structures by field emission scanning electron microscopy (FESEM). In another study, details of flange-type cell wall ingrowths in transfer cells were visualized by FESEM after cleaning freeze-fractured plant tissue in 1% Triton X-100 prior to fixation (Talbot et al., 2007).
We tested both methods on sieve plates. We were able to find a few sieve plates in stem cross sections after application of 0.1% sodium hypochlorite for 20 min (Figure 1A). Sieve plate pores were visible in some cases but were covered by cytoplasmic precipitates. We applied 0.1% sodium hypochlorite for increasing periods to achieve maximum cytoplasmic clearance. However, before the cytoplasm was properly removed, the entire phloem in the section collapsed, most likely due to the action of free radicals on the cell walls (Figure 1B).
Figure 1.

Scanning Electron Microscopy Images of Cell Wall Structures after Different Treatments.
Sieve plates of P. vulgaris 20 min (A) and 120 min (arrowhead in [B]) after treatment with 0.1% hypochlorite. Short-term treatment (A) does not remove all cytoplasmic constituents, whereas longer treatment leads to a collapse of the entire phloem and cambium layer (between white lines in [B]) located between the xylem and a prominent sclerenchyma (asterisk) layer. Triton X-100 does not remove all cytoplasmic constituents even after 24 h (C). Sieve plates (arrowheads in [B] and [C]) are covered with cytoplasmic components. Cytoplasmic clearance by progressive enzymatic digest leads to complete clearance of all cytoplasmic components ([D] to [G]). The overall structure of 1-mm-thick stem sections of Phaseolus (D) is well preserved. Cell layers are not collapsed and even epidermal trichomes are well preserved. Higher magnification of Cucurbita cell walls provides a clear view of plasmodesmata and cellulose fibrils (E). Developing vessel elements (F) and xylem parenchyma cell walls (G) are also well preserved. Freeze-dried tissue can be resectioned (H), and internal cell layers can be observed (I) without obstructions by cytoplasmic components. Bars = 5 μm in (A), 20 μm in (B) and (C), 1 mm in (D), 650 nm in (E), 100 μm in (F), 40 μm in (G), 1 mm in (H), and 50 μm in (I).
The phloem did not collapse when incubated in 1% Triton X-100, and tissue preservation generally seemed superior compared with hypochlorite treatment. However, sieve plates were difficult to locate and were generally covered with cytoplasmic residues even after incubation periods of 24 h (Figure 1C) or longer. In principle, it seemed that hypochlorite or Triton X-100 was able to remove cytoplasm from some cell types in the upper, sectioned layer of the tissue, but not from deeper cell layers. Therefore, we developed a method employing a progressive and selective digestion to remove the cytoplasm and expose the cell wall.
To prevent wound reactions and potential formation of cell wall components (e.g., callose depositions), hypocotyls were excised directly above the soil, plunge-frozen in liquid nitrogen, and freeze-substituted in 100% ethanol at −20°C. The stems were then sliced into 1-mm-thick sections, washed in water, and subjected to selective digestion. Four major cytoplasmic components were targeted for removal (lipids/membranes, nucleic acids, proteins, and carbohydrates) without affecting the integrity of the cell wall. First, we aimed to remove membranes and proteins from the cells. Proteins are abundant in cell walls, where they have important functions. However, shape and structural integrity are primarily maintained by carbohydrates and ions. Therefore, we employed 0.1% of the broadband proteinase, proteinase K, and 8% Triton X-100 in Tris buffer. Complete digestion of cytoplasmic constituents was a slow process. In general, it took up to 14 d to completely remove cytoplasmic proteins and membranes. Due to their size and solubility, the treatment also removed most of the soluble cytoplasmic carbohydrates, but starch grains were frequently found attached to the walls in high numbers. Consequently, the tissue was further digested in 0.1% amylase (after inactivation of proteinase K) to selectively remove starch. Figures 1D to 1G show FESEM images of freeze-dried plant tissue after this enzymatic digest of cytoplasmic contents. The entire section is well preserved; parenchyma, phloem, and xylem cells exhibit shapes typical of hydrated, fresh sections. Secondary cell wall depositions, pit fields on young developing and mature tracheary elements, and ray parenchyma cells are also well preserved. Epidermal trichomes are still visible, demonstrating the gentle nature of this method. The freeze-dried tissue samples were resectioned with a razor blade (Figure 1H). Higher-resolution images of resectioned tissue (Figure 1I) showed that the cytoplasm of cells in deeper tissue layers had also been removed.
Sieve Plate Ultrastructure
One of our aims was to determine the specific conductivity (k) of sieve tubes. Tomato (Solanum lycopersicum), castor bean (Ricinus communis), squash (Cucurbita maxima), bamboo (Phyllostachys nuda), and green bean (Phaseolus vulgaris) were chosen for investigations on sieve plate ultrastructure. For Solanum and Ricinus, precise noninvasive MRI measurements on phloem flow velocities are available (Windt et al., 2006) that can be correlated with the specific conductivity of sieve tubes. Cucurbita, Phaseolus, and Phyllostachys were selected because they are known to differ in cytoplasmic constituents, plate size, pore size, and stem diameter.
A scanning electron microscopy image of a stem cross section of Cucurbita after enzymatic digest shows the xylem with mature (Figure 2A, asterisk) and young (white arrowhead) vessel elements. The xylem is separated from the phloem by a prominent fascicular cambium layer (black arrowhead). Sieve plates are readily visible (Figure 2B). Sieve elements formed during primary growth (white arrowheads in Figure 2B), and secondary growth can be distinguished by size. In direct proximity to the cambium, young developing sieve elements, in which sieve plate pores have not yet opened, can frequently be seen (Figure 2A, inset).
Figure 2.

Scanning Electron Microscopy Images of Phloem and Sieve Plates after Progressive Enzymatic Digest of the Cytoplasm.
(A) Mature (asterisk) and young, developing vessel elements (white arrowhead) are visible in a C. maxima stem cross section. The cambium consists of several layers of rectangular cells (black arrowhead). The kidney-shaped phloem layer contains numerous primary and secondary sieve elements. Bar = 500 μm.
(B) Higher magnification of the phloem layer in (A). Several small sieve plates from the primary phloem (white arrowheads) as well as large sieve plates from the secondary phloem are visible. Bar = 100 μm.
(C) to (F) Sieve plate anatomy of P. vulgaris (C), C. maxima (D), R. communis (E), and S. lycopersicum (F). Size and shape of plates and pores differ considerably.
(G) to (J) The same sieve plates as in (C) to (F), respectively, but at the same magnification, giving a visual impression of anatomy and conductance.
Bars = 5 μm in (C) and (F) and 20 μm in (D), (E), and (G) to (J).
Sieve plate anatomy varies considerably between species (Figures 2C to 2F). Cucurbita stands out due to their large plates with relatively few but big pores (Figure 2D). The average pore is ∼5 μm in diameter. Phaseolus and Solanum have similar pore and plate sizes, in the range of 1.5 to 20 μm in diameter, respectively. Ricinus contains the smallest but most numerous pores (Table 1) in a relatively large sieve plate, which may be simple or compound (Figure 2E, simple sieve plate). Figures 2G to 2J show a comparison of the size of sieve plates of the four species at the same magnification.
Table 1.
Calculations of Sieve Tube–Specific Conductivity
| Species | Pore Radius rp (μm) for Average Calculations | Number of Pores per Plate Np | Length of Sieve Element l (μm) | Length of Sieve Plate lp (μm) | Radius of Sieve Plate r (μm) | k (μm2) Based on Average Pore Size | k (μm2) Based on Individual Pore Sizes |
| Cucurbita | 2.54 ± 0.86 | 54.8 ± 11.9 | 341 ± 77 | 1.27 ± 0.29 | 25.65 ± 2.97 | 24.42 | 53.00 |
| Phaseolus | 0.73 ± 0.24 | 95.4 ± 31.7 | 140 ± 38 | 0.43 ± 0.11 | 10.13 ± 1.13 | 2.77 | 6.33 |
| Solanum | 0.61 ± 0.15 | 121.3 ± 30.3 | 130 ± 90 | 0.52 ± 0.12 | 10.70 ± 1.4 | 1.71 | 3.82 |
| Ricinus | 0.52 ± 0.14 | 371.9 ± 79 | 255 ± 122 | 0.24 ± 0.05 | 16.22 ± 1.6 | 3.52 | 10.57 |
| Phyllostachys | 0.61 ± 0.13 | 104.0 ± 12.7 | 1052 ± 244 | 0.39 ± 0.1 | 11.60 ± 1.0 | 8.25 | 12.44 |
| Nicotianaa | 0.35 | 108 | 122 | 1.2 | 5.5 | 0.45 | |
| Arabidopsisa | 0.26 | 52 | 107 | 1.0 | 2.0 | 0.28 |
Values were measured based on scanning electron microscopy images with the exception of l in Phyllostachys, which was measured by fluorescence microscopy. Calculations based on average pore sizes were in all cases significantly lower compared with calculations based on individual pores (error indicates se).
Values and calculations for Nicotiana and Arabidopsis were taken from Thompson and Wolniak (2008).
Sieve Tube–Specific Conductivity
Based on the clear visibility of the sieve plate, we intended to calculate the impact of plate anatomy on sieve tube–specific conductivity. As outlined above, the number of sieve pores (Np) per sieve plate, sieve element radius (r), sieve element length (l), sieve pore radius (rp), and sieve plate thickness (lp) determine the specific conductivity (Thompson and Holbrook, 2003b). The formula accounts for circular tubes and circular pores. Our images, however, show that neither sieve plate pores nor the plate itself are usually circular. Therefore, r and rp were calculated 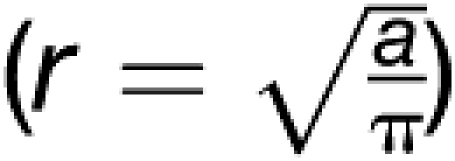 from the pore area (ap) and sieve plate area (as; Figure 3A), a kind of mathematical rounding to receive an accurate average radius. Plate thickness and length of sieve elements (l and lp) were taken from longitudinal sections (e.g., Figures 1H and 1I). Due to overhanging sieve element sidewalls, lateral portions of the total sieve plate surface area (as) were not always visible (Figure 3A). Therefore, the borderline of as sometimes had to be estimated (av). To correct the total number of pores, Np was calculated by (as/av)Np. Table 1 shows k estimates based on average values of the different parameters.
Figure 3.

Example of Measurement Sampling and k Value Distributions of Sieve Plates and Secondary Phloem Areas.
(A) Overview of parameters measured for calculations on sieve tube–specific conductivity. The pore area (ap) was measured to calculate pore radius. Marginal portions of the sieve plate were sometimes covered by overhanging sidewalls. Therefore, the sieve plate area (as) had to be estimated to some extent to calculate plate radius and correct conductivity of the visible area (av). Increase in interporal wall thickness (wp) was measured for calculations on callose deposition rates.
(B) Pore number, size, and shape of sieve plates may vary considerably even in adjacent tubes.
(C) Color-coded overview of the percentage of contribution of individual pores to the total sieve plate conductivity in Cucurbita. The larger central pores provide the majority of conductivity. The pattern seems to account for laminar flow.
(D) Color-coded sieve plate of Phaseolus. A similar but less pronounced pattern as in Cucurbita can be found in Phaseolus.
(E) Color-coded overview of specific conductivity of individual tubes in a vascular bundle of Cucurbita. Red, >60 μm2; salmon, 40 to 60 μm2; ocher, 20 to 40 μm2; yellow, <20 μm2.
(F) Color-coded overview of specific conductivity of individual tubes in the vasculature of Phaseolus. Red, >8 μm2; salmon, 4 to 8 μm2; ocher, 2 to 4 μm2; yellow, <2 μm2.
Bars = 10 μm in (A) and (D), 30 μm in (B) and (C), 500 μm in (E), and 200 μm in (F).
The formula derived by Thompson and Holbrook (2003b) is based on several assumptions, including that all pores are the same size. However, the number and size of pores in sieve plates within the same bundle or even in adjacent sieve elements may vary substantially (Figure 3B). Therefore, we calculated k of the tube by calculating the sum of k of all pores within a plate instead of average pore sizes. Since sieve element and sieve plate conductivities are arranged in parallel, this is given by:
 |
In all cases, k was significantly higher when calculated in the latter way (Table 1). Calculations based on fluorescence micrographs give significantly lower values (Thompson and Wolniak, 2008). Figure 3C shows a color-coded image of a Cucurbita sieve plate. The numbers indicate the percentage a specific pore contributes to total k of the plate. In Cucurbita, pore size and, therefore, k significantly increase toward the center of the plate. The small pores at the margins hardly contribute at all to the total k of the plate. A similar but less pronounced tendency is visible in Phaseolus (Figure 3D).
To investigate the potential developmental increase of k in young compared with old sieve tubes, we calculated k (on the basis of individual pores) for all visible sieve plates within a bundle of Cucurbita (Figure 3E). Sieve elements with the smallest k represent the primary phloem (which probably has become inactive in translocation already) and developing sieve elements (which are not active yet) that are in direct proximity to the cambium. In Phaseolus, tubes with variable k values are scattered throughout the entire phloem layer (Figure 3F).
MRI Studies
MRI velocimetry, also known as NMR flow imaging, has been shown to be an excellent tool to noninvasively measure xylem and phloem sap flow in the intact plant. It has been used to measure xylem and phloem transport in various subjects, such as the castor bean seedling (Kockenberger et al., 1997), the main stem of large, fully developed tomato, castor bean, tobacco (Nicotiana tabacum), and poplar (Populus spp) plants (Windt et al., 2006), and the tomato truss stalk (Windt et al., 2009). Furthermore, it has been employed to study topics such as the diurnal dynamics of long distance transport (Rokitta et al., 1999; Peuke et al., 2001; Windt et al., 2006) and the effects of cold girdling (Peuke et al., 2006).
To date, MRI velocimetric data on flow velocities in Cucurbita and Phaseolus are not available. We used mature (6-week-old) ∼5-m-long plants to conduct MRI measurements. After imaging, we subsequently cut, shock froze, and digested the stem tissue to calculate k values of sieve tubes at the same stem locations where flow imaging was performed.
Since anatomical changes have a major impact on k, we investigated the influence of enzymatic digest and freeze-drying on stem anatomy by comparing fully hydrated tissue imaged by MRI with dehydrated tissue processed for scanning electron microscopy. Significant shrinkage or swelling was not detected (Figures 4A to 4D). In Cucurbita, the transfer of deep frozen stem sections into chilled ethanol sometimes resulted in cracks in the tissue, most likely due to temperature-induced tensions or the expansion of liquid nitrogen trapped inside the central cavity. This sometimes led to minor displacements (Figure 4B). In general, however, the differences between whole-stem anatomical measurements of fresh and dried tissue were in the range of the pixel size of the MRI images (∼100 μm).
Figure 4.

MRI Velocimetry and Scanning Electron Microscopy.
The comparison between the in vivo stem dimensions of Cucurbita (A) and Phaseolus (C) as observed by MRI and after preparation for scanning electron microscopy ([B] and [D]) illustrates that the overall shape and dimensions of the tissue during scanning electron microscopy preparation were well preserved. Amplitude (i.e., water content) maps of Cucurbita (E) and Phaseolus (H) were acquired from a T1 inversion recovery measurement and serve as an anatomical reference for the phloem flow velocity maps of Cucurbita (F) and Phaseolus (I). Amplitude is expressed in arbitrary units (a.u.). The cumulative velocity profile (total propagator) for all phloem sap flow containing pixels was constructed for both species ([G] and [J]). Making use of the fact that the flow profile of stationary water is symmetrical around zero, the diffusing but stationary water in the flow mask (red) was separated from the flowing water (blue). Shown is the averaged flow profile of five subsequent measurements in a single plant; the error bars indicate the sd. Where no error bars are visible, sd is smaller than the graph's symbols. The average weighted phloem flow velocity in Phaseolus was 327 μm s−1, and in Cucurbita, 199 μm s−1. Bars = 4 mm in (A) and (B) and 2 mm in (C) and (D).
Phloem flow velocities (sap flux densities) were measured in three individual Phaseolus and Cucurbita plants (Figures 4E to 4J). Velocities in Phaseolus averaged 327 μm s−1 (286, 347, and 349 μm s−1) and 199 μm s−1 in Cucurbita (206, 200, and 191 μm s−1).
The total length of sieve tubes is currently not known. Both Phaseolus and Cucurbita have source leaves all along the stem that may provide photoassimilates to the closest sink tissues, thereby reducing the effective l significantly. To investigate if flow velocities would change in plants with leafless stem sections, we pruned the lower 3 m of a Phaseolus plant and repeated the velocity measurements. The average flow velocity turned out to be 304 μm s−1 and, thus, in the range of nonpruned Phaseolus plants.
A plot of phloem flow velocity versus sieve tube–specific conductivity shows a nonlinear correlation. Solanum and Ricinus for scanning electron microscopy investigations were raised under greenhouse conditions as close as possible to the descriptions in Windt et al. (2006). We cannot exclude that k values varied between this study and the studies conducted on flow velocity by Windt et al. (2006). However, viscosity of sieve tube contents, length of tubes, or pressure differentials between sources and sinks must be significantly different between these species (Figure 5).
Figure 5.

Phloem Flow Velocity versus Sieve Tube–Specific Conductivity.
The plot of four species indicates that flow velocity decreases with increasing conductivity. S.l., Solanum lycopersicum; P.v., P. vulgaris; R.c., R. communis; C.m., C. maxima.
Sieve Plate Callose Formation
The sieve plate is the target for flow blockage in case of injury of sieve tubes. The plate may be occluded by precipitating P proteins (Knoblauch and van Bel, 1998) or by de novo synthesis of callose that forms extracellularly to constrict pore area.
Cucurbita, Phaseolus, and Phyllostachys were chosen for investigations of callose formation. Phaseolus sieve elements contain forisomes, which rapidly occlude sieve plates in response to injury (Knoblauch et al., 2001; Peters et al., 2008). Cucurbita sieve tubes also contain P proteins, including the best-characterized P proteins, PP1 and PP2 (Bostwick et al., 1992; Golecki et al., 1999). The grass P. nuda was selected because Poaceae lack P proteins and therefore probably have to rely solely on callose formation to occlude sieve pores.
The distance of maximum callose deposition in sieve pores from the site of wounding was determined (Figures 6A and 6B) prior to measuring the rate of callose deposition (Figures 6C and 6D) on sieve plates. Hypocotyls of Phaseolus and Cucurbita were excised and placed into tap water to allow callose to be deposited on the sieve plates. Two minutes after injury for Phaseolus and 120 min for Cucurbita, the hypocotyls were shock-frozen, freeze-substituted, and sliced into 1-mm-thick, serial cross sections prior to the digestion of the cytoplasm.
Figure 6.

Injury-Dependent Temporal and Spatial Callose Deposition in Phaseolus, Cucurbita, and Phyllostachys.
(A) and (B) Wound-induced callose deposition is detectable at least within the first 10 mm from the wounding site. A maximum of callose deposition was found at 3 mm up stem in Cucurbita (A) and 4 mm up stem in Phaseolus (B). The amount of deposition on individual sieve plates may vary considerably but follows a clear trend (n = 600 for each point).
(C) The time course of callose deposition varies among species (Phaseolus, squares; Phyllostachys, circles; Cucurbita, triangles; n ≥ 100).
(D) Callose deposition rates (Phaseolus, circles; Phyllostachys, dashed lines with circles; Cucurbita, dashed lines) indicate that Phaseolus deposits with an initial rate of 60 nm min−1, more than double the rate of Cucurbita and Phyllostachys. Phyllostachys shows a constant deposition rate until full occlusion is reached, whereas deposition rates in Cucurbita and Phaseolus decrease over time (error bars indicate 95% confidence interval).
We intended to calculate the decrease of sieve tube–specific conductivity due to callose formation. In Phaseolus and Cucurbita, it turned out that sieve plate callose formation became increasingly variable with time. While some plates were already completely occluded, others showed just minor callose depositions (Figure 7). This is most likely due to variable amounts of cytoplasmic constituents drawn into the pores by surge after cutting, which may become increasingly compressed until further callose formation is circumvented. Therefore, we measured the deposition of callose by measuring the increase of the thickness of walls separating pores (interporal wall thickness wp; Figure 3A). Ideally, callose formation and flow reduction would be studied on a single plant accompanied by flow velocity measurements. Unfortunately, this is impractical, since a single plant cannot be excised for different measurement points in time, and the time resolution of MRI velocimetry currently does not allow for measuring quick alterations in the phloem.
Figure 7.

Time-Dependent Progression of Callose Formation in Phaseolus and Cucurbita.
The sieve plate wall in uninjured Phaseolus sieve tubes appears as a thin plate of even thickness (A). The pores may contain some material at the margins, which might be callose. Callose formation after injury (time after injury indicated on each panel) is initiated predominantly at the margins (B) and directed toward the center of the pore ([C] and [D]). Sixty minutes after injury, some sieve plates may be completely occluded, whereas others still show significant open pore areas (E). In Cucurbita ([F] to [I]), the sieve plate walls consist of thin interporal wall areas and large pores (F). Progression of callose formation is slow ([G] to [I]). Complete pore occlusion by callose alone was not observed even after 24 h. Bars = 1 μm in (A) to (D) and (F) to (I) and 10 μm in (E).
Ten wp measurements each in 15 different sieve plates were made in four different plants for each serial cross section to calculate mean wp (n = 600 for each distance point). In Cucurbita, greatest callose deposition was found on sieve plates 3 mm up stem from the excision cut, whereas the corresponding site was 4 mm up stem in Phaseolus (Figures 6A and 6B). Similar results were achieved down stem from the wound.
To see whether partial injury of the stem resulted in the same reaction, Phaseolus hypocotyls were cut with a razor blade to the center of the stem, leaving half of the stem intact. Callose was allowed to deposit for 60 min before shock freezing and processing. No significant difference was observed between completely excised or partially wounded hypocotyls. Maximum callose depositions were found between 4 and 5 mm from the wound in the partially injured portion of the hypocotyl. The rate of callose deposition was similar in the two treatments. Callose deposition was also noted in the uninjured portion of the partially wounded hypocotyl, although it seemed less pronounced than on the wounded side. The decision to proceed with fully excised stems was made because processing and orientation of the tissue was more convenient when compared with partially wounded hypocotyls.
Rates of callose deposition were determined at the point in the hypocotyl where maximum callose deposition occurred. Excised hypocotyls of Phaseolus and Cucurbita were placed in water for different periods to allow for callose deposition on the sieve plates. Phaseolus hypocotyls were shock frozen 0, 1, 3, 10, and 20 min after excision. Following freeze substitution in ethanol, sections were taken 4 mm up and down stem from the cut site. Cucurbita hypocotyls were shock frozen after 0, 1, 3, 10, 20, and 120 min, and sections were taken 3 mm from the original cut.
For each of the reaction times allowed, a minimum of 10 wp measurements each were made in 10 sieve plates in three different plants (n ≥ 300 per point). Callose deposition was clearly visible (Figure 7). Initially, callose was deposited in Phaseolus sieve pores at a rate of 60 nm min−1 but decreased significantly over time. For most sieve plates, this rate was sufficient to completely occlude or at least considerably reduce their pore diameters within 20 min (Figures 6C and 6D).
As shown above, Cucurbita possesses very large sieve pores. Therefore, one would expect that callose formation might be much quicker in order to occlude the pores within a short period of time. However, our results indicated that callose deposition on sieve plates actually was slower in Cucurbita than in Phaseolus. Initially, callose was deposited at ∼27 nm min−1, but again the deposition rate decreased quickly (Figure 6D)
Sieve Plate Pore Callose Formation in P. nuda
Sieve plate imaging in monocotyledons is, in most cases, labor intensive since all phloem tissue originates from primary growth. Unlike dicot species that often contain storied cambia, which generate numerous sieve plates in a single plane, monocot sieve plates are scattered within the tissue volume. In addition, individual bundles usually contain only a few sieve tubes, and the length of sieve elements may reach several millimeters in certain species. Imaging and proper measurement of sieve plate parameters requires the sieve plates to be located in the upper 10 μm of the section. Consequently, an average of 100 to 200 bundles had to be screened to find one sieve plate that was suitable for imaging and measuring, thus making investigations into the distance of maximum callose deposition from the site of injury impracticable. However, it was still possible to measure the rate of callose deposition on sieve plates. Two-centimeter-long stem segments were used for each time point (0, 3, 10, and 20 min). After freeze substitution, the stem was cut into 1-mm pieces and then subjected to cytoplasmic digestion. This approach provided sufficient material to find at least 10 sieve plates per time point.
Figure 8A shows a cross section through the phloem of Phyllostachys. A prominent sclerenchyma cap covers the bundle. Thick-walled parenchyma cells have numerous pits. The phloem consists of six to eight sieve tubes and parenchyma cells. Sieve tube geometry prior to wounding (Figure 8B) had an average l = 1052 μm, r = 11.6 μm, lp = 0.39 μm, rp = 0.61 μm, and Np = 108, generating a k value of 8.25 μm2. Calculations based on individual pores instead of on averages generated a k of 12.44 μm2 (Table 1).
Figure 8.

Sieve Plate Callose Formation in Phyllostachys nuda.
(A) Cross section through the phloem region of a bundle in the Phyllostachys stem. One sieve plate is exposed in the phloem region. The phloem is covered by a prominent sclerenchyma cap. Thick-walled parenchyma cells contain numerous pits (right).
(B) Uninjured Phyllostachys sieve plates have small pores. Callose formation after injury proceeds quickly.
(C) Callose collars become evident 3 min after injury.
(D) and (E) After 10 min (D), thick layers of callose, sometimes forming chimney-like structures (E), cover most of the sieve plate.
(F) A more or less smooth callose layer, occluding the entire plate and preventing translocation, is abundant on most plates after 20 min.
Bars = 50 μm in (A), 10 μm in (B) to (D), 5 μm in (E), and 7 μm in (F).
Similar to Phaseolus, initial pore callose deposition on Phyllostachys sieve plates appears to be directed toward the center of the pore (Figures 8C and 8D). Once a thin platelet is formed, callose deposition proceeds in all directions, leading to a chimney-like appearance of the pores after 10 min (Figure 8E). During this time, callose deposition proceeds at a constant rate until the plate is occluded (Figures 6D and 8F).
DISCUSSION
Enzymatic Digest of the Cytoplasm to Expose the Cell Wall
Imaging of cell wall structures has been successful using atomic force microscopy and FESEM after extraction, homogenization, or freeze-thaw cycles (Marga et al., 2005). Gentle preparation methods generally only expose the upper layer of sectioned tissue blocks (e.g., Marga et al., 2005; Talbot et al., 2007). Our investigations demonstrate that these gentle methods were not sufficient to visualize sieve plates due to cytoplasmic constituents composed of an array of substances that are not readily removable by application of a single substance, such as Triton X-100. Entire tissue blocks may be cleared by hypochlorite, but this may compromise cell wall integrity by the introduction of high concentrations of free radicals (Figure 1B).
Progressive enzymatic digestion allows for targeted removal of specific cytoplasmic constituents without affecting cell wall shape. After application of proteinase K, Triton X-100, and amylase, overall tissue structure and cell shapes (Figures 1 and 4A to 4D) were not significantly affected when compared with fresh-sectioned tissues or hydrated tissues imaged by MRI (Figures 4A to 4D). This method may remove cell wall proteins, preventing investigations of protein–cellulose interactions. However, it does enable high-resolution, three-dimensional imaging of secondary wall thickenings, plasmodesmata, sieve plates, etc. Furthermore, the tissue does not become brittle and can be resectioned to expose cell walls in deeper tissue layers for scanning electron microscopy investigations.
Sieve Plate Anatomy
The morphology of the sieve plate is most important because the sieve plate has a major impact on the resistance to flow in the sieve tube (Thompson, 2006; Thompson and Wolniak, 2008). Precise measurements of sieve plate morphological parameters have not been previously available because of the limited resolution of light microscopy and the restriction of TEM images to two dimensions. Our data demonstrate that pore number and size may vary considerably between sieve plates of the same bundle and that the pores of one plate are often not of similar size. In some species (e.g., Cucurbita and Phaseolus), the distribution of pore size seems to follow a pattern that accounts for laminar flow, with larger pores in the center, where maximum velocities occur and smaller pores at the margins.
Sieve Tube–Specific Conductivity
The most accurate formula currently available to calculate sieve tube–specific conductivity (k) is the one derived by Thompson and Holbrook (2003b). Earlier studies reported values of k = 0.28 μm2 in Arabidopsis and k = 0.45 μm2 in tobacco (Thompson and Wolniak, 2008). Those calculations were based on fluorescence images and a number of simplifying assumptions, especially with regard to sieve plate anatomy. In light of our results, those values might represent underestimations. We compared calculations of k based on an idealized sieve plate in a standardized sieve tube to a calculation on the basis of individual pores (Table 1). The k values were in all cases significantly higher when calculated on a pore basis. The k values indicate that tube conductivity is the highest in Cucurbita (53 μm2), followed by Phyllostachys (12.44 μm2), Ricinus (10.6 μm2), Phaseolus (6.3 μm2), and finally Solanum (3.8 μm2). Sieve element and sieve plate conductivities are arranged in parallel. Therefore, an increase in sieve element length is accompanied by an increased influence on sieve tube conductivity (see also Thompson and Wolniak, 2008). This is obvious in Phyllostachys, which has relatively small pores but exceptionally long sieve elements (>1 mm length on average), which generates a relatively high conductivity.
Our calculations may contain some imprecision. (1) We have removed the plasma membrane and other sieve tube constituents that may be located in the pores. Assuming a plasma membrane thickness of 8 nm, average conductivity would change from 6.3 to 6.1 μm2 in Phaseolus. (2) The amount of other constituents located in the pores is highly variable. TEM images, which supposedly represented the natural state as they exhibit open pores without major obstructions (Russin and Evert, 1985; Ehlers et al., 2000), still showed minor amounts of proteins and endoplasmic reticulum in the pores. (3) During preparation for scanning electron microscopy investigations, turgor pressure is released, which may cause a reduction in sieve tube diameter. The effects of turgor release on sieve tube–specific conductivity have been analyzed in detail (Thompson, 2005; Thompson and Wolniak, 2008) and would, even under the most unfavorable conditions (40% reduction in diameter), not exceed 10% in tobacco. Since sieve tubes prepared for scanning electron microscopy are embedded in a three-dimensional network of surrounding cells, and the entire stem section does not show significant shrinkage when compared with fully hydrated tissue (Figures 4A to 4D), a minor shrinkage can be expected whose effect would be negligible (Thompson and Wolniak, 2008). (4) In addition, calculations were done under the simplifying assumption that pores are circular and sufficiently far away from each other not to influence individual flow patterns. While the removal of the plasma membrane and other constituents in the pores, as well as the calculations using circular instead of noncircular pores lead to an overestimation of k, the abundance of thin interporal walls and loss of turgor cause an underestimation. We conclude that although our calculations are based on some simplifications, the impact of these factors would not cause a major change in the overall trend.
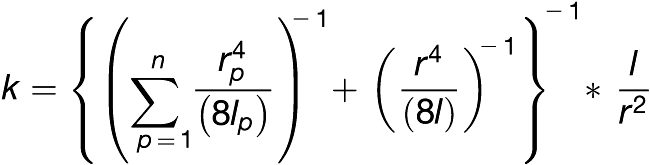
It is currently widely accepted that phloem translocation is driven by an osmotically generated pressure flow (Münch, 1930) in which the sieve elements act as more or less passive channels kept alive by their adjacent companion cells (van Bel and Knoblauch, 2000; van Bel, 2003). The applicability of the Hagen-Poiseuille relation to the study of local axial conductivity has been justified (Thompson and Holbrook, 2003b; appendix A and B and literature cited therein). In tubes free of obstructions, such as sieve plates, and assuming that lateral water exchange is minimal, volume flow rates follow the Hagen–Poiseuille relation:
 |
where V is volume, Δp is the (source-sink) pressure differential, η is the solute viscosity, l is the length of the tube, and r is the tube radius. Pressure is proportional, and viscosity and length of the tube are inversely proportional to volume flow. However, the radius of the tube is raised to the fourth power, meaning that increasing the diameter of the tube 10 times will result in 10,000 times higher volume flow rates, underlining the paramount importance of precise anatomical data. Estimates of flow within tubes containing obstructions, such as sieve plates, become more complicated, but the general principles still apply. If all other parameters, such as velocity, pressure differential, and length of the tube, are constant, a high number of thin tubes is necessary to allow the same flow rates. Therefore, plants generating large diameter sieve tubes and especially large pores could benefit from significant higher volume flow rates to feed fast-growing shoots and fruits through a relatively thin stem.
The anatomical consequences do not appear as dramatic when dealing with flow velocity as when dealing with volume flow, since r is only raised to the second power. However, given the size of tubes, plates and pores, it is not surprising that Cucurbita has a significantly higher k value than other plants.
It is astounding, however, that sieve tubes do not seem to follow these simple microfluidic principles. Despite the highest conductivity, Cucurbita shows the slowest flow velocities. A plot of k values versus phloem sap flow velocities (Figure 5) measured with noninvasive MRI velocimetry (Figure 4; Windt et al., 2006) in fact suggests that there is an inverse relationship between k and velocity (Figure 5).
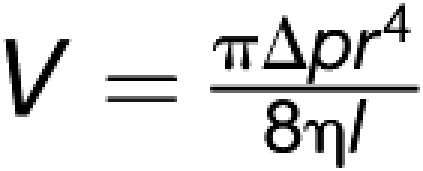
Axial flow velocity U (sap flux density) is a function of pressure gradient, viscosity, and sieve tube geometry (Thompson, 2006):
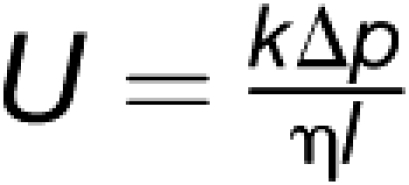 |
where k is the sieve tube–specific conductivity, Δp is the pressure differential, η is the sap viscosity, and l is the length of the sieve tube. Given the classical view that sieve tubes are more or less passive channels, plants would have to adjust Δp, η, or l to achieve the observed flow velocities.
Viscosity is mainly dependent on sucrose concentration in the sieve tube and changes only by a factor of two when sucrose concentration is increased from 0.5 to 1 M (Minchin and Lacointe, 2005) and thus cannot solely account for the observed discrepancies between species.
The length of the tube may be as long as the plant axis. The transit time of sucrose through the sieve tube is inversely proportional to the square of the sieve tube's length (Thompson and Holbrook, 2003b). Since Phaseolus contains source leaves all along the stem, which might reduce the effective l, we removed leaves to ensure that l is at least 3 m. Flow velocity measurements confirmed that U does not change significantly in pruned plants. Given our measurements for Cucurbita (k = 53 μm2), standard values for viscosity (η = 2 × 10⁻⁹ MPa s; overview in Thompson and Holbrook, 2003a, Table 4), and a stem length of 5 m, the measured average flow velocity (199 μm s−1) would be achieved at Δp = 0.038 MPa.
Phaseolus, however, requires significantly higher pressure differences. With k = 6.3 μm2, η = 2 × 10⁻⁹ MPa s, and l = 3 m, the required Δp is at least 0.31 MPa at a velocity of 327 μm s−1. Assuming sieve tubes are continuous throughout the plant, a pressure differential of ∼0.5 MPa would be required in a 5-m-long Phaseolus plant (about the length of axes in our experiments). The only direct measurements of sieve tube turgor pressures so far were performed by gluing pressure probes onto aphid stylets. The experiments yielded values of between 0.5 and 1.2 MPa in Salix babylonica and Salix exigua (Wright and Fisher, 1980, 1983) and between 0.7 and 1.0 MPa in Sonchus oleraceus (Gould et al., 2004). Increasing axial length might reach a point where pressure differentials required to drive flow exceed the turgor pressure that can be generated.
Because of this, it has been proposed that efficient flow would require, at least in some instances (e.g., large trees), that a plant's sieve tubes be shorter than a plant's axial length (Thompson and Holbrook, 2003b). Thompson (2006) has argued that cells in a decentralized body cannot measure and regulate pressure differentials and therefore cannot use it to control flow. He concluded that solute exchange is much easier to regulate if Δp is low or negligible. Twenty 1-m-long sieve tubes could transport sucrose 20 times faster than a single 20-m-long sieve tube at the same pressure differential (Thompson and Holbrook, 2003b). Therefore, it has been suggested that the transport phloem is organized in relays with apoplasmic loading and unloading between the sieve tubes (Lang, 1978, 1979; Thompson and Holbrook, 2003b; Thompson, 2006). Such an organization might solve the problem of excessive pressure differentials, but at the expense of creating others.
More recently, it became clear that the phloem is not just a tube system that translocates photoassimilates, but also serves as a long-distance communication system (for an overview, see Lough and Lucas, 2006). Loading and unloading would be required for hormones, proteins, RNAs, and other compounds. About 1500 different RNAs have been identified in the translocation stream (Lough and Lucas, 2006), which would have to be unloaded and reloaded to pass an apoplasmic barrier. P proteins have been shown to propagate from roots to scions in graft experiments (Golecki et al., 1999), and at least 140 soluble proteins have been identified in sieve tube exudates (Giavalisco et al., 2006). Electrical signals are transferred along sieve tubes (Furch et al., 2007). Those would require a kind of neurotransmitter to be propagated to the next relay. Besides the enormous amount of sugars, amino acids, etc., that would have to be unloaded and reloaded, apoplasmic barriers would require a very high density of transporters and transmitters to keep long-distance transport and signaling operational. The only study thus far investigating the potential abundance of relays in castor bean favored hydrostatic continuity (Murphy and Aikman, 1989).
In any case, it remains an unanswered question why plants seem to keep their translocation rate in a certain range and do not benefit from higher flow rates permitted in larger tubes. If flow through sieve tubes is indeed a pressure-driven flow generated by osmotic differentials, then the question arises as to how plants measure and regulate pressure and viscosity (Thompson, 2006) to maintain flow velocities.
Our method allows for the study of crucial anatomical parameters to finally test Münch's hypothesis. Precise measurements of pressure differentials, especially in large plants such as trees or vines in combination with anatomical data and flow velocity measurements will show if the pressure flow hypothesis can account for long-distance translocation in sieve tubes. Investigating the potential existence of relays is another important step toward a better understanding of phloem function.
Decrease in Sieve Tube–Specific Conductivity by Callose Formation
Since the diameter of sieve pores is of vital importance for flow velocity, they are the ideal target if flow needs to be stopped (e.g., to prevent nutrient loss in case of injury).
Our results indicate that mechanical injury leads to local callose formation with maximum deposition 3 to 4 mm from the site of injury, both up and down stem. The formation of callose toward the center of the pore proceeds with an initial speed of 60 nm per minute in Phaseolus and 27 nm per minute in Cucurbita and Phyllostachys.
Sieve plate occlusion is most likely due to interplay of callose with cytoplasmic constituents that are dragged into sieve pores due to pressure release during injury. Sieve tube content located inside sieve pores and compressed by callose has been shown earlier (e.g., Cronshaw and Esau, 1968). The time course of sealing by this two-component system is unknown.
Initially, the increase in resistance on the sieve plate is dependent on cytoplasmic constituents alone, since callose deposition rates are slow compared with drag-induced precipitation of cytoplasmic constituents. Filamentous P proteins especially seem to be dedicated to increasing plate resistance by covering it like spaghetti in a sink. But also, remnants of sieve element plastids and the endoplasmic reticulum may contribute to a plug that covers the sieve plate (Knoblauch and van Bel, 1998). The rate and efficiency of deposition is contingent on various parameters, such as particle size, particle number, pore size, and force of drag due to the amount of pressure release. The differences in sieve plate anatomy will lead to variable amounts of occlusion. Next, de novo synthesis of callose starts to compress the depositions located in the pores to form a tight seal. Dependent on the amount of depositions in the pores, this process may proceed for different time periods.
In Phyllostachys, which lacks P proteins, callose deposition occurs at a constant rate (Figure 6D). Here, the vast majority of plates show a complete occlusion by callose 20 min after injury (Figure 8F). Randomly, some pores remain partly open, most likely due to obstructions in the pores that have been digested during tissue preparation.
In Cucurbita and Phaseolus, which contain filamentous P protein, callose deposition rates decrease rapidly and sieve plate images show a huge variety of callose coverage after 60 min. While some plates are fully covered with callose, others show just minor depositions (Figure 7E), most likely reflecting the amount of cytoplasmic constituents compressed in the pores prior to tissue preparation. Therefore, we expect the decrease in deposition rate is due to maximum compression and not to a decrease in enzymatic activity. In conclusion, full sieve plate occlusion by callose and cytoplasmic constituents would be accomplished when callose deposition rates approach zero, which is the case after ∼20 min in Phaseolus and Cucurbita (Figure 5D). Unfortunately, the time resolution that can be reached with MRI velocimetry currently does not allow us to investigate the flow velocity reduction by callose formation in the phloem.
Recently, it has been reported that burning leaf tips results in distant (30 to 40 mm from the wound; Furch et al., 2007) callose formation in Vicia faba and S. lycopersicum. Although mechanical injury did not lead to the same phenomenon, it is interesting that maximum callose deposition occurred after a similar time period (20 min). The authors reported a subsequent removal of callose, which we did not observe. However, removal of callose has been reported in wounded tissue after regular sieve tubes connect to wound sieve tubes (Schulz, 1986).
The discovery of the rapid and reversible, injury-triggered reaction of the Fabaceae-specific P proteins called forisomes (Knoblauch et al., 2001) has shown that, at least in this family, an extremely rapid first line of defense exists. Forisome proteins are encoded by a gene family called Sieve Element Occlusion (Pelissier et al., 2008) with homologs in other genera, such as Arabidopsis, Vitis (Pelissier et al., 2008), and Cucumis (Huang et al., 2009). Injury leads to an increase of the intracellular calcium level, which causes forisomes to contract longitudinally and expand radially (Knoblauch et al., 2001). This reaction can be as fast as 150 ms and leads to a volume increase of up to 800% (Peters et al., 2008). The reaction is fully reversible, thus representing a much faster and more flexible occlusion mechanism compared with callose synthesis. Phaseolus occludes sieve plates with callose, although Phaseolus contains forisomes. This may indicate that forisomes function in rapid response. Callose might be important for long-term sealing due to its higher mechanic rigidity and resistance against pathogens (van Bel, 2003).
METHODS
Plant Material
Squash (Cucurbita maxima cv Burgess Buttercup; Irwin and Sons Ag Supply), tomato (Solanum lycopersicum), and green bean (Phaseolus vulgaris cv Kentucky Wonder Green; Stokes Seeds) were grown in pots in a greenhouse at 23°C, with 60 to 70% relative humidity, and a 14/10-h light/dark period (daylight plus additional lamp light; model #PL 90; PL Lighting Systems) with a minimum irradiance of 150 μmol m−2 s−1. Plants were used for experiments 30 to 46 d after germination, just prior to flower opening. Bamboo (Phyllostachys nuda) and castor bean (Ricinus communis) were collected from the greenhouse (Washington State University, Pullman, WA).
Protein and Cytoplasm Digestion
Hypocotyls were excised from the roots with a razor blade and either placed directly into liquid nitrogen (Nl) or placed in tap water for set periods of time to allow callose deposition, then shock frozen in Nl. The hypocotyls were placed into superchilled 100% ethanol (in Nl until gelled) and placed into a −20°C freezer for 24 h. The ethanol-submerged hypocotyls were allowed to warm to room temperature; the ethanol was replaced with distilled water, and the specimens were allowed to rest for at least 2 h. Ten 1-mm serial sections were made above and below the original wound with a new region of a double-edged razor blade for each slice. Using a wood burner to mark the backside of the sections allowed correct orientation.
The sections were washed again in distilled water and placed into individual 1.5-mL microcentrifuge tubes containing 0.1% proteinase K (fungal) (Invitrogen) dissolved in 50 mM Tris-HCl buffer, 1.5 mM Ca2+ acetate, and 8% Triton X-100, pH 8.0, and incubated at 55°C on a thermomixer (Eppendorf) set at 350 rpm for 7 d. The enzyme solution was exchanged and sections were incubated for another 7 d. Daily inversion of the tube is important to prevent Triton X-100 from settling. The sections were placed into 100% ethanol to inactivate proteinase K, washed in distilled water, placed into 0.1% Amylase in 10 mM Tris-HCl, pH 7.0, and incubated at 60°C for 24 h.
Scanning Electron Microscopy
The sections were lyophilized for 12 h using a Virtis Lyophilizer (The Virtis Co.) and were then mounted onto aluminum specimen mounts (TED Pella) with carbon Pelco tabs (TED Pella), and ∼200 Å of Au was applied using a Technics Hummer V (Anatech) sputter coater. Sieve plates were imaged with high vacuum mode at 30 kV accelerating voltage using a Quanta 200F environmental field emission gun scanning electron microscope (FEI Company; Field Emission Instruments). For high-resolution imaging (Figure 1E), samples were coated with 1 nm platinum/palladium.
Image Analysis
Images were measured for area fraction (percent open area) and interporal wall thickness using the public domain NIH ImageJ 1.31v program (http://rsb.info.nih.gov/ij). Sigmaplot 8.0 software (Jandel Scientific) was used to graph and analyze confidence intervals (P = 0.05) for the data sets.
MRI
All measurements were done on a purpose built spectrometer, based on a Bruker Avance console in combination with a 3 T vertical bore superconducting magnet, an open-action 7-cm inner diameter gradient insert, capable of delivering gradient strengths up to 1 T/m with a rise time of 240 μs, and a split-action birdcage-type radiofrequency coil with an inner diameter of 4 cm.
MRI velocimetry was done following the methodology as described by Windt et al. (2006). A pulsed field gradient–spin echo–turbo-spin-echo (PFG-SE-TSE) sequence (Scheenen et al., 2001) was used to measure the average linear displacement by stepping the amplitude (G) of the PFGs from –Gmax to +Gmax, sampling q-space completely and equidistantly. After Fourier transformation of the signal as a function of G, the complete distribution of displacements of water (called propagator) in the direction of G within the labeling time Δ was obtained for every pixel of an image. From these single pixel propagators, the following flow characteristics can be extracted: the total amount of water, the amount of stationary water, the amount of flowing water, the flow conducting surface, the average linear velocity (including the direction of flow), and the volume flow (Scheenen et al., 2001). In this study, only flow maps depicting the average linear velocity are shown. The total propagator of all phloem flow conducting pixels was obtained by summing all pixel propagators that contained downwards directed flow and discarding all others. Data processing and quantification of the PFG-SE-TSE flow measurements were done as described in (Windt et al., 2006).
For the flow measurements in Cucurbita, the following experimental parameters were used: field of view (FOV), 12 × 12 mm; slice thickness, 6 mm; matrix size, 128 × 128 pixels; repetition time (TR), 1250 ms, two averages; RARE factor, 8; echo time (TE), 5 ms; spectral width, 50 kHz; flow labeling time, Δ 150 ms; PFG duration, δ 3 ms; PFGmax, 0.204 T/m; 32 q steps; 37 180° refocusing pulses during Δ; and measurement time, 21 min. For Phaseolus, the same experimental parameters were used, but here the FOV was 8.0 × 8.0 mm, the RARE factor 16, the number of repetitions 16, and the total scan time 64 min. Amplitude (i.e., water content) maps were acquired with a TSE-based T1 saturation recovery sequence, employing the same FOV and slice thickness as mentioned before. Here, the further experimental parameters were TE, 5 ms; RARE factor, 8; and TR, 50, 100, 200, 400, 750, 1100, 1500, 2000, 2500, 3000, and 6000 ms.
Acknowledgments
We thank the staff of the Franchesci Microscopy and Imaging Center for equipment, training, and use. Thanks to Valerie Lynch-Holm for help during the initial development of the method, Mathew Thompson and Noel Michele Holbrook for helpful discussions, Winfried Peters for comments on the manuscript, Jan Knoblauch for data analysis, Jamie Watts for lab assistance, Johannes Kochs for transporting our plants, and Charles Cody and Beate Uhlig for maintaining plant material. This work was supported by National Science Foundation Integrated Organismal Systems Grant 0818182.
References
- Bostwick D.E., Dannenhoffer J.M., Skaggs M.I., Lister R.M., Larkins B.A., Thompson G.A. (1992). Pumpkin phloem lectin genes are specifically expressed in companion cells. Plant Cell 4: 1539–1548 [DOI] [PMC free article] [PubMed] [Google Scholar]
- Cronshaw J., Esau K. (1968). P-protein in the phloem of Cucurbita. II. The P-protein of mature sieve elements. J. Cell Biol. 38: 292–303 [DOI] [PMC free article] [PubMed] [Google Scholar]
- Currier H.B. (1957). Callose substance in plant cells. Am. J. Bot. 44: 478–488 [Google Scholar]
- Eckardt N.A. (2001). A calcium-regulated gatekeeper in phloem sieve tubes. Plant Cell 13: 989–992 [DOI] [PMC free article] [PubMed] [Google Scholar]
- Ehlers K., Knoblauch M., van Bel A.J.E. (2000). Ultrastructural features of well-preserved and injured sieve elements: Minute clamps keep the phloem transport conduits free for mass flow. Protoplasma 214: 80–92 [Google Scholar]
- Esau K., Cheadle V.I. (1961). An evaluation of studies on ultrastructure of sieve plates. Proc. Natl. Acad. Sci. USA 47: 1716–1726 [DOI] [PMC free article] [PubMed] [Google Scholar]
- Eschrich W. (1965). Physiologie der Siebröhrencallose. Planta 65: 280–300 [Google Scholar]
- Eschrich W. (1975). Sealing systems in phloem (callose and slime plugs). In Encyclopedia of Plant Physiology, Vol. 1, Zimmermann M.H., Milburn J.A., (Berlin: Springer; ), pp. 39–56 [Google Scholar]
- Evert R.F., Derr W.F. (1964). Callose substance in sieve elements. Am. J. Bot. 51: 552–559 [Google Scholar]
- Fischer A. (1885). Über den Inhalt der Siebröhren in der unverletzten Pflanze. Ber. Dtsch. Bot. Ges. 3: 230–239 [Google Scholar]
- Fisher D.B. (2000). Long-distance transport in biochemistry and molecular biology of plants. In Biochemistry and Molecular Biology of Plants, Buchanan B.B., Gruissem W., Jones R.L., (Rockville, MD: American Society of Plant Physiology; ), pp. 730–785 [Google Scholar]
- Furch A.C., Hafke J.B., Schulz A., van Bel A.J. (2007). Ca2+-mediated remote control of reversible sieve tube occlusion in Vicia faba. J. Exp. Bot. 58: 2827–2838 [DOI] [PubMed] [Google Scholar]
- Giaquinta R.T., Geiger D.R. (1973). Mechanism of inhibition of translocation by localized chilling. Plant Physiol. 51: 372–377 [DOI] [PMC free article] [PubMed] [Google Scholar]
- Giavalisco P., Kapitza K., Kolasa A., Buhtz A., Kehr J. (2006). Towards the proteome of Brassica napus phloem sap. Proteomics 6: 896–909 [DOI] [PubMed] [Google Scholar]
- Golecki B., Schulz A., Thompson G.A. (1999). Translocation of structural P proteins in the phloem. Plant Cell 11: 127–140 [DOI] [PMC free article] [PubMed] [Google Scholar]
- Gould N., Minchin P.E.H., Thorpe M.R. (2004). Direct measurements of sieve element hydrostatic pressure reveal strong regulation after pathway blockage. Funct. Plant Biol. 31: 987–993 [DOI] [PubMed] [Google Scholar]
- Hafke J.B., van Amerongen J.K., Kelling F., Furch A.C., Gaupels F., van Bel A.J. (2005). Thermodynamic battle for photosynthate acquisition between sieve tubes and adjoining parenchyma in transport phloem. Plant Physiol. 138: 1527–1537 [DOI] [PMC free article] [PubMed] [Google Scholar]
- Hao P., Liu C., Wang Y., Chen R., Tang M., Du B., Zhu L., He G. (2008). Herbivore-induced callose deposition on the sieve plates of rice: An important mechanism for host resistance. Plant Physiol. 146: 1810–1820 [DOI] [PMC free article] [PubMed] [Google Scholar]
- Huang S., et al. (2009). The genome of the cucumber, Cucumis sativus L. Nat. Genet. 41: 1275–1281 [DOI] [PubMed] [Google Scholar]
- Kallarackal J., Milburn J.A. (1983). Studies on the phloem sealing mechanism in Ricinus fruit stalks. Aust. J. Plant Physiol. 10: 561–568 [Google Scholar]
- Knoblauch M., Peters W.S., Ehlers K., van Bel A.J.E. (2001). Reversible calcium-regulated stopcocks in legume sieve tubes. Plant Cell 13: 1221–1230 [DOI] [PMC free article] [PubMed] [Google Scholar]
- Knoblauch M., van Bel A.J.E. (1998). Sieve tubes in action. Plant Cell 10: 35–50 [Google Scholar]
- Kockenberger W., Pope J.M., Xia Y., Jeffrey K.R., Komor E., Callaghan P.T. (1997). A non-invasive measurement of phloem and xylem water flow in castor bean seedlings by nuclear magnetic resonance microimaging. Planta 201: 53–63 [Google Scholar]
- Lang A. (1978). A model of mass flow in the phloem. Aust. J. Plant Physiol. 5: 535–546 [Google Scholar]
- Lang A. (1979). A relay mechanism for phloem translocation. Ann. Bot. (Lond.) 44: 141–145 [Google Scholar]
- Lough T.J., Lucas W.J. (2006). Integrative plant biology: Role of phloem long-distance macromolecular trafficking. Annu. Rev. Plant Biol. 57: 203–232 [DOI] [PubMed] [Google Scholar]
- Marga F., Grandbois M., Cosgrove D.J., Baskin T.I. (2005). Cell wall extension results in the coordinate separation of parallel microfibrils: Evidence from scanning electron microscopy and atomic force microscopy. Plant J. 43: 181–190 [DOI] [PubMed] [Google Scholar]
- McNairn R.B. (1972). Phloem Translocation and heat-induced callose formation in field-grown Gossypium hirsutum L. cotton. Plant Physiol. 50: 366–370 [DOI] [PMC free article] [PubMed] [Google Scholar]
- McNairn R.B., Currier H.B. (1968). Translocation blockage by sieve plate callose. Planta 82: 369–380 [DOI] [PubMed] [Google Scholar]
- Minchin P.E., Lacointe A. (2005). New understanding on phloem physiology and possible consequences for modelling long-distance carbon transport. New Phytol. 166: 771–779 [DOI] [PubMed] [Google Scholar]
- Minchin P.E., Thorpe M.R., Farrar J.F., Koroleva O.A. (2002). Source-sink coupling in young barley plants and control of phloem loading. J. Exp. Bot. 53: 1671–1676 [DOI] [PubMed] [Google Scholar]
- Münch E. (1930). Die Stoffbewegung in der Pflanze. (Jena, Germany: Fischer; ). [Google Scholar]
- Murphy R., Aikman D.P. (1989). An investigation of the relay hypothesis of phloem transport in Ricinus communis L. J. Exp. Bot. 40: 1079–1088 [Google Scholar]
- Pelissier H.C., Peters W.S., Collier R., van Bel A.J.E., Knoblauch M. (2008). GFP tagging of sieve element occlusion (SEO) proteins results in green fluorescent forisomes. Plant Cell Physiol. 49: 1699–1710 [DOI] [PMC free article] [PubMed] [Google Scholar]
- Peters W.S., Knoblauch M., Warmann S.A., Pickard W.F., Shen A.Q. (2008). Anisotropic contraction in forisomes: Simple models won't fit. Cell Motil. Cytoskeleton 65: 368–378 [DOI] [PubMed] [Google Scholar]
- Peuke A.D., Windt C., Van As H. (2006). Effects of cold-girdling on flows in the transport phloem in Ricinus communis: Is mass flow inhibited? Plant Cell Environ. 29: 15–25 [DOI] [PubMed] [Google Scholar]
- Peuke A.D., Rokitta M., Zimmermann U., Schreiber L., Haase A. (2001). Simultaneous measurement of water flow velocity and solute transport in xylem and phloem of adult plants of Ricinus communis over a daily time course by nuclear magnetic resonance spectrometry. Plant Cell Environ. 24: 491–503 [Google Scholar]
- Pickard W.F., Abraham-Shrauner B. (2009). A 'simplest' steady-state Munch-like model of phloem translocation, with source and pathway and sink. Funct. Plant Biol. 36: 629–644 [DOI] [PubMed] [Google Scholar]
- Rokitta M., Peuke A.D., Zimmermann U., Haase A. (1999). Dynamic studies of phloem and xylem flow in fully differentiated plants by fast nuclear-magnetic-resonance microimaging. Protoplasma 209: 126–131 [DOI] [PubMed] [Google Scholar]
- Russin W.A., Evert R.F. (1985). Studies on the leaf of populus deltoides (Salicaceae) -Quantitative aspects, and solute concentrations of the sieve-tube members. Am. J. Bot. 72: 487–500 [Google Scholar]
- Scheenen T.W., Vergeldt F.J., Windt C.W., de Jager P.A., Van As H. (2001). Microscopic imaging of slow flow and diffusion: a pulsed field gradient stimulated echo sequence combined with turbo spin echo imaging. J. Magn. Reson. 151: 94–100 [DOI] [PubMed] [Google Scholar]
- Schulz A. (1986). Wound phloem in transition to bundle phloem in primary roots of Pisum sativum L. II. The plasmatic contact between wound-sieve tubes and regular phloem. Protoplasma 130: 27–40 [Google Scholar]
- Sjolund R.D., Shih C.Y., Jensen K.G. (1983). Freeze-fracture analysis of phloem structure in plant tissue cultures. III. P-Protein, sieve area pores, and wounding. J. Ultrastruct. Res. 82: 198–211 [DOI] [PubMed] [Google Scholar]
- Sugimoto K., Williamson R.E., Wasteneys G.O. (2000). New techniques enable comparative analysis of microtubule orientation, wall texture, and growth rate in intact roots of Arabidopsis. Plant Physiol. 124: 1493–1506 [DOI] [PMC free article] [PubMed] [Google Scholar]
- Talbot M.J., Wasteneys G.O., Offler C.E., McCurdy D.W. (2007). Cellulose synthesis is required for deposition of reticulate wall ingrowths in transfer cells. Plant Cell Physiol. 48: 147–158 [DOI] [PubMed] [Google Scholar]
- Thompson M.V. (2005). Scaling phloem transport: elasticity and pressure-concentration waves. J. Theor. Biol. 236: 229–241 [DOI] [PubMed] [Google Scholar]
- Thompson M.V. (2006). Phloem: The long and the short of it. Trends Plant Sci. 11: 26–32 [DOI] [PubMed] [Google Scholar]
- Thompson M.V., Holbrook N.M. (2003a). Scaling phloem transport: Water potential equilibrium and osmoregulatory flow. Plant Cell Environ. 26: 1561–1577 [Google Scholar]
- Thompson M.V., Holbrook N.M. (2003b). Application of a single-solute non-steady-state phloem model to the study of long-distance assimilate transport. J. Theor. Biol. 220: 419–455 [DOI] [PubMed] [Google Scholar]
- Thompson M.V., Wolniak S.M. (2008). A plasma membrane-anchored fluorescent protein fusion illuminates sieve element plasma membranes in Arabidopsis and tobacco. Plant Physiol. 146: 1599–1610 [DOI] [PMC free article] [PubMed] [Google Scholar]
- Ton J., Mauch-Mani B. (2004). Beta-amino-butyric acid-induced resistance against necrotrophic pathogens is based on ABA-dependent priming for callose. Plant J. 38: 119–130 [DOI] [PubMed] [Google Scholar]
- Van As H. (2007). Intact plant MRI for the study of cell water relations, membrane permeability, cell-to-cell and long distance water transport. J. Exp. Bot. 58: 743–756 [DOI] [PubMed] [Google Scholar]
- Van As H., Scheenen T., Vergeldt F.J. (2009). MRI of intact plants. Photosynth. Res. 102: 213–222 [DOI] [PMC free article] [PubMed] [Google Scholar]
- van Bel A.J.E. (2003). The phloem, a miracle of ingenuity. Plant Cell Environ. 26: 125–149 [Google Scholar]
- van Bel A.J.E., Knoblauch M. (2000). Sieve element and companion cell: The story of the comatose patient and the hyperactive nurse. Aust. J. Plant Physiol. 27: 477–487 [Google Scholar]
- Windt C.W., Gerkema E., Van As H. (2009). Most water in the tomato truss is imported through the xylem, not the phloem: A nuclear magnetic resonance flow imaging study. Plant Physiol. 151: 830–842 [DOI] [PMC free article] [PubMed] [Google Scholar]
- Windt C.W., Vergeldt F.J., De Jager P.A., Van As H. (2006). MRI of long-distance water transport: A comparison of the phloem and xylem flow characteristics and dynamics in poplar, castor bean, tomato and tobacco. Plant Cell Environ. 29: 1715–1729 [DOI] [PubMed] [Google Scholar]
- Wright J.P., Fisher D.B. (1980). Direct measurement of sieve tube turgor pressure using severed aphid stylets. Plant Physiol. 65: 1133–1135 [DOI] [PMC free article] [PubMed] [Google Scholar]
- Wright J.P., Fisher D.B. (1983). Estimation of the volumetric elastic modulus and membrane hydraulic conductivity of willow sieve tubes. Plant Physiol. 73: 1042–1047 [DOI] [PMC free article] [PubMed] [Google Scholar]