

Abstract
Correlated spiking is often observed in cortical circuits, but its functional role is controversial. It is believed that correlations are a consequence of shared inputs between nearby neurons and could severely constrain information decoding. Here we show theoretically that recurrent neural networks can generate an asynchronous state characterized by arbitrarily low mean spiking correlations despite substantial amounts of shared input. In this state, spontaneous fluctuations in the activity of excitatory and inhibitory populations accurately track each other, generating negative correlations in synaptic currents which cancel the effect of shared input. Near-zero mean correlations were seen experimentally in recordings from rodent neocortex in vivo. Our results suggest a re-examination of the sources underlying observed correlations and their functional consequences for information processing.
The spiking activity of neurons is often correlated within local cortical populations (1-4). While correlations could be a signature of active information processing (5,6), they can also impair the estimation of information conveyed by the firing rates of neural populations (2, 7, 8) and might limit the efficiency of an organism for performing sensory discriminations (2, 7). Under certain conditions correlated spiking is an inevitable consequence of shared pre-synaptic input (9, 10). In general, however, the overall contribution of shared input to correlation magnitudes measured in vivo is unclear, as measured correlations could reflect mostly covariations in activity due to cognitive or external variables outside the control of the experimenter (11-13). To investigate the relationship between correlations and shared input, we studied theoretically the correlation structures characteristic of densely connected recurrent networks.
We start by considering how the correlation between a single neuronal pair depends on the fraction p of shared inputs and the degree rin to which the inputs are themselves correlated. The effect of shared input can be isolated by considering presynaptic neurons that fire independently (rin = 0). Both excitatory (E) and inhibitory (I) shared inputs cause positive correlations of a moderate magnitude in the synaptic input and spiking activity of the postsynaptic pair (Fig. 1A-B) (9, 14). Spiking correlations rin between inputs, on the other hand, have a major impact on the output correlation rout of the post-synaptic pair. When all inputs are E, very weak input correlations give rise to strongly correlated synaptic currents and output spikes (Fig. 1C). This occurs because, when p and rin are small, the correlation c of the two input currents is approximately equal to
| (1) |
(15), where N is the number of synaptic inputs, resulting in a very large gain in the relationship between rin and rout (Fig. 1E, upper solid curve). The situation changes when both neurons receive I as well as E inputs. Correlations between E or between I neurons lead to strongly correlated excitatory and inhibitory synaptic currents (Fig. 1F, red and green traces). However, when E and I inputs are themselves correlated, large fluctuations in the excitatory and inhibitory currents occur simultaneously (Fig. 1F, asterisks) and cancel, leading to a significant reduction in the correlation of the total synaptic currents c and output spikes (Fig. 1F, black and gray traces). Correlations between E and I inputs thus decorrelate the synaptic currents to postsynaptic neurons (16).
Fig. 1. Effect of shared inputs and correlated inputs on output correlation.

(A) Shared excitatory (E, green) or inhibitory (I, red) inputs induce positive correlations in the synaptic currents of two cells (c > 0). (B) Correlation coefficient of synaptic currents c (dashed) and output spikes rout (circles, count window T = 50 ms) of a postsynaptic pair of integrate-and-fire neurons as a function of the shared input fraction p (21). Each post-synaptic cell received NE = 250 Poisson input spike trains. (C) Input spike raster (top), synaptic currents (middle) and membrane potentials (bottom) of a post-synaptic pair receiving weakly correlated E inputs (black circle in (E), rin = 0.025). (D) Whereas correlations between E inputs or between I inputs contribute positively to c, correlations between E and I inputs have a decorrelating effect. (E) Correlations c (dashed) and rout (circles) as a function of the input spike correlation rin at fixed p = 0.2. E inputs only: each cell receives NE = 250 correlated Poisson spike trains (21), E and I inputs: NI = 220 inhibitory input trains were added with identical statistics and correlations. (F) Same as (C) but for the case with E and I inputs (blue circle in (E), rin = 0.025). E and I currents are shown separately from the total currents (black and gray).
To investigate whether such decorrelation can arise spontaneously from the dynamics of a recurrent network, we analytically characterized the behavior of correlations in a simple recurrent circuit of binary neurons (17-19). The network consists of two populations (of size N) of E and I neurons connected randomly, both receiving excitatory projections from an external (X) population of N cells (Fig. 2A). The network has two key properties: first, the connectivity is dense so that the connection probability p (and thus the mean fraction of shared input) is fixed independently of the network size (e.g. p = 0.2 (20) as in Fig. 2). Second, the synaptic couplings are strong such that only a small fraction of a cell’s excitatory inputs is enough to evoke firing (Fig. 2B); in the model, although the average number of inputs is proportional to N, the number of excitatory inputs needed to induce firing is only proportional to (19). Our analysis showed that, even in the presence of shared input, the network settles into a stationary state in which the population-averaged firing correlation r‾ is very weak, if inhibition is sufficiently strong and fast. In fact, in networks of different sizes, r‾ decreases inversely proportional to N (Fig. 2C, open squares and (17)-section 1.3), a signature of asynchronous networks (18). In an asynchronous state, the variance of the population-averaged instantaneous activity scales in the same way as if the neurons were completely independent – as 1/N. Thus, correlations in the asynchronous state do not qualitatively constrain averaging of activity across neural populations (Fig. S2) (18).
Fig. 2. Asynchronous activity in a binary recurrent network.

(A) Schematic of the network architecture. The shared input fraction is p. (B) Strong coupling produces irregular spiking activity due to a dynamic balance between the large excitatory (E and X) and inhibitory (I) currents to each cell (19, 22). Dashed line represents threshold. (C) Population-averaged correlation coefficients of the firing activity (r‾, open squares), total current (c, filled squares) and current components vs. network size N. Dashed lines show and 1/N scaling for comparison. (D) Instantaneous population-averaged activities (transformed to z-scores) of the E, I and X neurons, showing that tracking becomes more accurate with increasing N. Insets show instances of the lag between E and I activities (EI-Lag). Color code as in (B). (E) Population-averaged cross-correlograms (CCGs) of the current components (N = 8192). Color code as in (C). Insets: magnification of the peak of the IE and EI CCGs (bottom) shows that the EI-Lag decreases with N, leading to the decrease in the magnitude and width of the total current CCG (top). (F) Description of the asynchronous self-consistent solution (see text). (G) The histogram of correlations in the network (EE pairs; N = 8192) is wide: σr ≫ r‾.
Asynchronous activity persists in the presence of shared input due to a spontaneously generated tracking of fluctuations in the population-averaged instantaneous activities mE(t) and mI(t) of the E and I neurons (Fig. 2D and (17)-section 1.4). Specifically, mI(t) tracks mE(t) with a small lag (EI-Lag), and they both closely follow the external instantaneous activity mX(t). In larger networks, tracking becomes more accurate, and becomes perfect in the large N limit,
| (2) |
where AE and AI are constants which depend on the network architecture. Tracking occurs because, when the connectivity is strong and dense, even small ‘random’ fluctuations in instantaneous excitatory activity, of order , are large enough to recruit inhibitory feedback.
Tracking of the instantaneous population activities is equivalent to a precise cancellation of the different components of the (zero-lag) population-averaged current correlation c (Fig. 2E and (17)-section 1.5). Because the synaptic current to each cell consists of an excitatory and an inhibitory component, the average current correlation across cell pairs, c, can be decomposed into cEE, cII and cEI (the term cIE = cEI). Both cEE and cII are positive and large, i.e., independent of N, for large networks (Fig. 2C, colored squares) due to amplification of weak firing correlations and of shared E or I inputs (Fig. 2F i; Fig. 1F red and green traces). However, cEI is large and negative due to correlations between E and I cells generated by tracking, leading to the cancellation:
| (3) |
(Fig. 2C, filled squares; 2F ii; Fig. S3). Even after this cancellation, however, the instantaneous current correlation c is still larger than the correlation in firing r‾ (Fig. 2C, filled and open squares). This is possible because neurons integrate their inputs over time, so that the instantaneous correlation r‾ is related to the area under the current cross-correlogram (CCG). Because tracking becomes faster for larger networks, both the width of the current CCG (effectively set by the EI-Lag) and its magnitude decrease as (Fig. 2E, insets). Its area is thus 1/N, as required for asynchronous firing (Fig. 2F iii). Because the asynchronous state just described is a dynamical phenomenon, it does not require fine-tuning of network parameters (Fig. S4). Parameter changes lead to adjustments in rates and correlations such the cancellation in equation 3 still holds.
While the theory predicts that the population-averaged correlation r‾ should be close to zero, it does not predict that every pair of cells should be as weakly correlated. Rather, the distribution of r across pairs is wide, with a standard deviation σr much larger than its mean r‾ for large networks (σr decays only as ), resulting in similar numbers of positively and negatively correlated pairs (Fig. 2G). This is because the hard-wired sources of correlation have a strong impact on individual r’s (of order ) and therefore generate large heterogeneity across pairs (Fig. S3). Asynchronous activity is also possible under non-stationary conditions: numerical simulations with time-varying inputs display a similar correlation structure if r is computed with respect to the time-varying instantaneous average activity of each cell (Fig. S5).
Active decorrelation of synaptic currents also occurs in a more biologically plausible network of spiking neurons. We simulated large networks of randomly connected conductance-based integrate-and-fire neurons (21), with parameters chosen to produce a balanced state where neurons fired irregularly (Fig. 3A; shared fraction p = 0.2) (22). As predicted, the distribution of spike count correlation coefficients r is wide (Fig. 3B), with an extremely low average (in EE pairs r‾ < 0.001 for all count window sizes, Fig. S6C). This happened for a large range of average firing rates and connection probabilities (Fig. S7A-F), with synchrony developing only when inhibition was substantially slower than excitation (Fig. S7G-I). The distribution of r conditioned on the response to time-varying external inputs was also wide for a large range of modulation frequencies (Fig. S8). To determine whether a cancellation between the components of the current correlation (equation 3) underlies the small value of r‾ observed, we injected different levels of constant current to cell pairs in which we had disabled the spiking mechanism. The range of current levels was adjusted to isolate the EPSP and the IPSP components near their respective reversal potentials (23), or combinations of EPSPs and IPSPs at intermediate potentials. The correlation between isolated EPSPs (Fig. 3C, green) and between isolated IPSPs (red) was much larger than the correlation measured with no injected current, due to a cancellation with the large negative correlation between EPSPs and IPSPs (gold). The V-shape relationship between membrane potential correlation and holding potential (Fig. 3D) is an experimentally testable prediction of our theory.
Fig. 3. Cancelation of correlations in a recurrent network of spiking neurons.
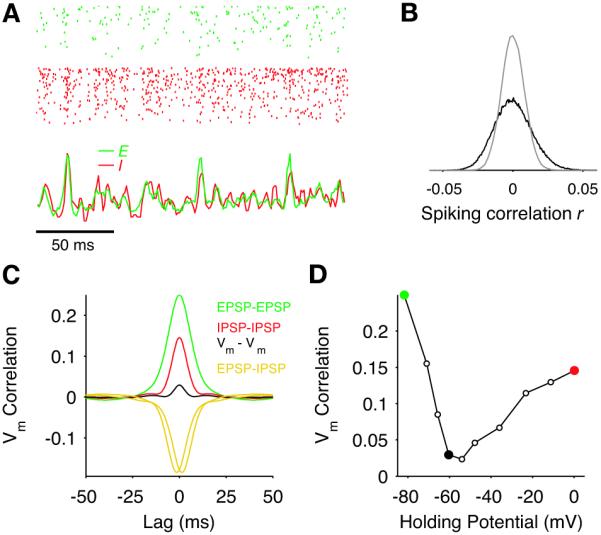
(A) Raster (top) of 500 E (green) and I (red) neurons in a conductance-based integrate-and-fire network receiving shared independent Poisson inputs (p = 0.2). Bottom curves show tracking of instantaneous population-averaged activities (transformed to z-scores, bin size 3 ms). Average firing rate of E and I cells were 1 and 3.6 spike/s, respectively. (B) Histogram of spike count correlations (black; count window 50 ms) and of jittered spike trains (gray, jitter ± 500 ms (21)). (C) Population-averaged CCGs of the membrane potential containing mostly EPSPs (green) or IPSPs (red) in both cells, or EPSPs for one cell and IPSPs for the other (gold). The black curve is from pairs at resting potential. (D) Peak height of the membrane potential CCG as a function of the mean holding potential of both neurons in the pair. Green and red circles correspond the reversal of inhibition and excitation and the black circle corresponds to rest.
The existence of a wide distribution of spike count correlations was confirmed in neuronal population recordings collected with silicon microelectrodes in somatosensory and auditory cortices of urethane-anesthetized rats (21). Under urethane anesthesia, cortical activity displays spontaneous changes in state (24) homologous to those seen during sleep (25). Network activity alternates between an ‘activated’ state of tonic firing resembling REM (ACT; Fig. 4A-B, blue), and an ‘inactivated’ state characterized by global fluctuations in population activity (Up-Down transitions), resembling slow-wave-sleep (InACT; Fig. 4C-D, red). During ACT periods, correlations were on average remarkably small, and the correlation histogram was wide (Fig. 4B shows one experiment: r‾ = 0.0075; 47% of negatively correlated pairs). These values were typical of ACT state correlations across different animals (Fig. 4E; n =11 recording sessions in 9 rats, r‾ median was 0.0053, [0.0024:0.0094] interquartile range; across all 30,772 pairs r‾ = 0.0052 and 47% had r < 0). This behavior did not depend strongly on the time-scale at which correlations were measured (Fig. S9). Although r‾ in the ACT state was systematically very low, it was positive and significantly different from zero in all experiments (Fig. 4E; p < 0.005). A minority of both positive and negative correlations were statistically significant (blue versus gray in Fig. 4B; Fig. 4F). Pairs with significant and negative (positive) correlations showed clear troughs (peaks) in their cross-correlograms on average (Fig. 4B, insets; Fig. S10). Finally, the correlation histogram during the ACT state was still wide even if only neurons recorded in the same shank were considered (Fig. S11). During InACT periods, as expected from co-modulation by the slow oscillation, the distribution of r was consistently biased towards positive values (Fig. 4C-F; n =7 sessions in 5 rats, r‾ median was 0.0953, [0.088:0.109] interquartile range; across all 18,916 pairs r‾ = 0.096 and 9% had r < 0). Within Up-state periods, however, average correlations were again very weak (26): removal of Down-states from the recorded spike trains (21) resulted in correlation histograms very similar to those during the ACT state (Fig. 4D-E; r‾ median was 0.0163, [0.0066:0.023] interquartile range; across all 18,916 pairs r‾ = 0.0136 and 45% had r < 0). Thus, correcting for common modulations in activity induced by the slow oscillation, revealed a wide distribution of correlations under non-stationary conditions in vivo.
Fig. 4. Distribution of correlations in the rat neocortex in vivo.

(A) Raster (top) and instantaneous population activity (bottom) for a population of 100 simultaneously recorded neurons (sorted by rate) during a period of cortical activation (ACT). (B) Histogram of spike count correlations of the population in (A) is wide (σr ≫ r‾). The white curve is the mean histogram of the jittered spike trains (jitter ± 200 ms, gray shade 95% confidence interval; count window 50 ms (21)). Insets show average raw cross-correlograms of all negatively (left) and positively (right) significantly correlated pairs (p < 0.01). (C-D) Same as (A-B) for the same population of cells during a period of cortical inactivation (InACT). Histogram of correlations during InACT is biased towards positive values (red). Restricting the analysis to Up-state activity by removing Down-state periods (black brackets in (C), (21)) largely eliminates the positive bias (Up-St, orange). (E) Box-whisker plots showing the distribution of mean correlations across experiments for different conditions. Crosses represent outliers. (F) Median fraction of significantly correlated pairs (p < 0.01, empty bars) and of significantly and negatively correlated pairs (solid bars) across experiments. Error bars represent interquartile range.
In summary, we demonstrate theoretically that recurrent network dynamics can lead to an active decorrelation of synaptic currents, resulting in a state of arbitrarily low mean correlation. We therefore conclude that shared input does not inevitably cause correlated activity. By preventing uncontrolled network-wide synchrony, this mechanism generates a background of weakly correlated spiking, as required for efficient information processing based on either firing rates or coordinated spike timing patterns (27, 28). Both simulations and in vivo recordings showed a wide distribution of correlations under stationary conditions. In nonstationary conditions, global activity modulations can result in positively biased correlations, but correlations around the mean activity imposed by these modulations can still be extremely small (Fig. 4D-E; Fig. S5 and Fig. S8). Similarly weak correlations have been reported in visually driven neural populations in area V1 of awake behaving monkeys (29). However, as the constellation of inputs driving a cortical circuit is in general unknown to the experimenter, positive correlations may persist even after all experimentally controlled variables are accounted for (11, 12). Whether ‘residual’ correlations of this nature will have a strong impact on coding will depend on the extent to which down-stream networks are able to disambiguate modulations in activity due to different sources. In either case, we suggest that cortical circuitry does not itself constitute an irreducible source of ‘noise’.
Supplementary Material
Acknowledgments
We thank A. Amarasingham, N. Brunel, G. Buzsaki, B. Doiron, A. Ecker, S. Fijisawa, A. Heimel, A. Kohn, D. Robbe, S. Sakata, E. Stark and A. Tolias for comments on an earlier version of this manuscript, C. van Vreeswijk for discussions and A. Compte, S. Ardid and J. Manrique for sharing their codes. This study was supported by NIH grants MH073245 and DC009947, NSF grant SBE-0542013 to the TDLC, an NSF Science of Learning Center, an NIDCD grant DC-005787-01A1 and a Spanish grant FIS 2006-09294. KDH is an Alfred P. Sloan fellow. We would like to dedicate this work to the memory of D. J. Amit.
References and Notes
- 1.Gawne TJ, Richmond BJ. J. Neurosci. 1993;13:2758. doi: 10.1523/JNEUROSCI.13-07-02758.1993. [DOI] [PMC free article] [PubMed] [Google Scholar]
- 2.Zohary E, Shadlen MN, Newsome WT. Nature. 1994;370:140. doi: 10.1038/370140a0. [DOI] [PubMed] [Google Scholar]
- 3.Vaadia E, et al. Nature. 1995;373:515. doi: 10.1038/373515a0. [DOI] [PubMed] [Google Scholar]
- 4.Lee D, Port NL, Kruse W, Georgopoulos AP. J. Neurosci. 1998;18:1161. doi: 10.1523/JNEUROSCI.18-03-01161.1998. [DOI] [PMC free article] [PubMed] [Google Scholar]
- 5.Gray CM, Singer W. Proc. Natl. Acad. Sci. USA. 1989;86:1698. doi: 10.1073/pnas.86.5.1698. [DOI] [PMC free article] [PubMed] [Google Scholar]
- 6.Riehle A, Grün S, Diesmann M, Aertsen A. Science. 1997;278:1950. doi: 10.1126/science.278.5345.1950. [DOI] [PubMed] [Google Scholar]
- 7.Britten KH, Shadlen MN, Newsome WT, Movshon JA. J. Neurosci. 1992;12:4745. doi: 10.1523/JNEUROSCI.12-12-04745.1992. [DOI] [PMC free article] [PubMed] [Google Scholar]
- 8.Sompolinsky H, Yoon H, Kang K, Shamir M. Phys. Rev. E. 2001;64:051904. doi: 10.1103/PhysRevE.64.051904. [DOI] [PubMed] [Google Scholar]
- 9.Shadlen MN, Newsome WT. J. Neurosci. 1998;18:3870. doi: 10.1523/JNEUROSCI.18-10-03870.1998. [DOI] [PMC free article] [PubMed] [Google Scholar]
- 10.Kriener B, Tetzlaff T, Aertsen A, Diesmann M, Rotter S. Neural Comp. 2008;20:2185. doi: 10.1162/neco.2008.02-07-474. [DOI] [PubMed] [Google Scholar]
- 11.Roelfsema PR, Lamme VAF, Spekreijse H. Nature Neuroscience. 2004;7:982. doi: 10.1038/nn1304. [DOI] [PubMed] [Google Scholar]
- 12.Cohen MR, Newsome WT. Neuron. 2008;60:162. doi: 10.1016/j.neuron.2008.08.007. [DOI] [PMC free article] [PubMed] [Google Scholar]
- 13.Nienborg H, Cumming BG. Nature. 2009;459:89. doi: 10.1038/nature07821. [DOI] [PMC free article] [PubMed] [Google Scholar]
- 14.Moreno-Bote R, Parga N. Phys. Rev. Lett. 2006;96:028101. doi: 10.1103/PhysRevLett.96.028101. [DOI] [PubMed] [Google Scholar]
- 15.The correlation between two quantities, each given by sum of N variables correlated by an amount rin, out of which Np are common is equal to (p + rin(N − p))/(1 + rin(N − 1)), which is approximately equal to p + Nrin when p ~ rinN ≪ 1.
- 16.When the firing properties of the E and I populations are identical, the leading order effect of positive firing correlations on c can only be ≥ 0. If excitation and inhibition are precisely balanced, the equality is realized and the fraction of shared input sets the population-averaged firing correlation (9).
- 17.Details of the theory are available in the Supporting Online Material.
- 18.Ginzburg I, Sompolinsky H. Phys. Rev. E. 1994;50:3171. doi: 10.1103/physreve.50.3171. [DOI] [PubMed] [Google Scholar]
- 19.van Vreeswijk C, Sompolinsky H. Science. 1996;274:1724. doi: 10.1126/science.274.5293.1724. [DOI] [PubMed] [Google Scholar]
- 20.Holmgren C, Harkany T, Svennenfors B, Zilberter Y. Journal of Physiology. 2003;551:139. doi: 10.1113/jphysiol.2003.044784. [DOI] [PMC free article] [PubMed] [Google Scholar]
- 21.See Materials and Methods in the Supporting Online Material.
- 22.Amit DJ, Brunel N. Cerebral Cortex. 1997;7:237. doi: 10.1093/cercor/7.3.237. [DOI] [PubMed] [Google Scholar]
- 23.Okun M, Lampl I. Nat Neurosci. 2008;11:535. doi: 10.1038/nn.2105. [DOI] [PubMed] [Google Scholar]
- 24.Steriade M. Electroencephalography. fourth edn. Williams and Willkins; 1999. [Google Scholar]
- 25.Clement EA, et al. PLoS ONE. 2008;3:e2004. doi: 10.1371/journal.pone.0002004. [DOI] [PMC free article] [PubMed] [Google Scholar]
- 26.Stern EA, Jaeger D, Wilson C. Nature. 1998;394:475. doi: 10.1038/28848. [DOI] [PubMed] [Google Scholar]
- 27.Vogels T, Abbott L. J. Neurosci. 2005;25:10786. doi: 10.1523/JNEUROSCI.3508-05.2005. [DOI] [PMC free article] [PubMed] [Google Scholar]
- 28.Kumar A, Rotter S, Aertsen A. J. Neurosci. 2008;28:5268. doi: 10.1523/JNEUROSCI.2542-07.2008. [DOI] [PMC free article] [PubMed] [Google Scholar]
- 29.Ecker AS, et al. 2009 Submitted. [Google Scholar]
Associated Data
This section collects any data citations, data availability statements, or supplementary materials included in this article.