

Abstract
Focal cortical injuries result in death of cortical neurons and their efferents and ultimately in death or damage of thalamocortical relay (TCR) neurons that project to the affected cortical area. Neurons of the inhibitory reticular thalamic nucleus (nRT) receive excitatory inputs from corticothalamic and thalamocortical axons and are thus denervated by such injuries, yet nRT cells generally survive these insults to a greater degree than TCR cells. nRT cells inhibit TCR cells, regulate thalamocortical transmission, and generate cerebral rhythms including those involved in thalamocortical epilepsies. The survival and reorganization of nRT after cortical injury would determine recovery of thalamocortical circuits after injury. However, the physiological properties and connectivity of the survivors remain unknown. To study possible alterations in nRT neurons, we used the rat photothrombosis model of cortical stroke. Using in vitro patch-clamp recordings at various times after the photothrombotic injury, we show that localized strokes in the somatosensory cortex induce long-term reductions in intrinsic excitability and evoked synaptic excitation of nRT cells by the end of the first week after the injury. We find that nRT neurons in injured rats show (1) decreased membrane input resistance, (2) reduced low-threshold calcium burst responses, and (3) weaker evoked excitatory synaptic responses. Such alterations in nRT cellular excitability could lead to loss of nRT-mediated inhibition in relay nuclei, increased output of surviving TCR cells, and enhanced thalamocortical excitation, which may facilitate recovery of thalamic and cortical sensory circuits. In addition, such changes could be maladaptive, leading to injury-induced epilepsy.
Introduction
Neocortical injuries initiate processes of cortical cell death and orthograde and retrograde degeneration of corticothalamic and thalamocortical axons, respectively (Peacock and Combs, 1965; Matthews, 1973; Iizuka et al., 1990; Sørensen et al., 1996), as well as gliosis in affected structures (Iizuka et al., 1990; Agarwala and Kalil, 1998). Although thalamic reticular (nRT) neurons are susceptible to excitotoxic injury after local stroke, they generally survive cortical lesions (Ross and Ebner, 1990). The functional long-term consequences of cortical stroke are predicted by the size and location of the lesion and by the capacity of the brain to compensate and reorganize lost functions, sometimes leading to posttraumatic epilepsy by mechanisms that are poorly understood. Several studies suggest that the thalamus is involved in generation of both partial and generalized seizures (for review, see Huguenard and Prince, 1997). Over the past decade, most of the emphasis has been on the role of thalamus in diffuse corticothalamic epilepsies. Much less is known about the role of the thalamus in partial epilepsies.
The nRT, located at the crossroads of the thalamocortical system (see Fig. 1), receives both upstream and downstream excitatory signals (Jones, 1985) and powerfully modulates output of thalamic relay neurons (for review, see Steriade, 2005). nRT cells produce divergent inhibitory output (Crabtree et al., 1998) that can both drive thalamocortical oscillations related to generalized absence seizures and potentially suppress feedback of focal cortical seizures (Huguenard and Prince, 1997; Steriade, 2005). Survival and reorganization of nRT after cortical lesions is expected to play a role in recovery of thalamocortical circuits. A malfunction of the surviving GABAergic nRT neurons could profoundly affect thalamocortical activity, and the results may be either favorable or disadvantageous, compensating for lesion-induced deficits while causing a deterioration of function or even postlesional epilepsy (So et al., 1996). However, the effects of cortical infarct on the physiological properties and connectivity of the nRT survivors remain unknown. Because these questions are crucial to our understanding of the mechanisms of poststroke thalamocortical reorganization leading to epilepsy, we used the cortical photothrombosis brain infarction rat model (Watson et al., 1985; Kelly et al., 2001; Kharlamov et al., 2003) to study the anatomical and physiological changes of nRT after well controlled focal infarction in the somatosensory cortex. Such lesions have been shown to result in poststroke epilepsy with seizures originating in the ipsilateral perilesional cortex and associated with motor arrest of the animal (Kelly et al., 2001; Kharlamov et al., 2003). In the present study, we first determined the precise location of cell death in thalamus after focal thrombosis in the somatosensory cortex. Furthermore, we examined the intrinsic excitability of nRT cells both central and peripheral to the region of maximal poststroke damage. We further examined whether the mechanisms central to oscillatory activity in this nucleus were altered by determining the ability of these neurons to fire bursts of action potentials (APs). Finally, we asked whether the excitatory or inhibitory synaptic inputs to nRT neurons were altered.
Figure 1.
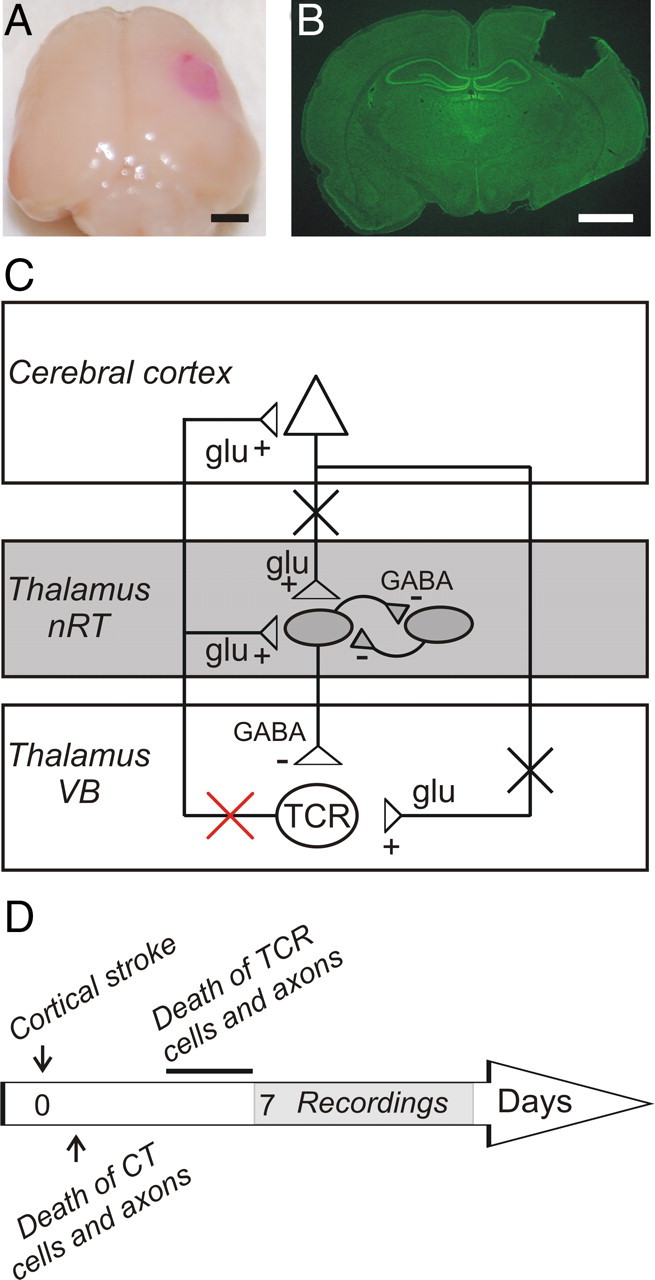
Cortical photothrombosis. A, Brain of a rat killed 7 d after lesioning the right somatosensory cortex. Scale bars: A, B, 2 mm. B, Nissl-stained coronal slice of the corresponding brain. Note that on sectioning the cortical infarct was transformed into a vacant space extending to the subcortical white matter, but not into subcortical regions. C, Simplified diagram of the corticothalamic loop comprised of cerebral cortex, thalamocortical relay nuclei, and the nRT. (+) and (−) correspond to glutamatergic (glu) excitatory and GABAergic (GABA) inhibitory projections, respectively. Somatosensory cortical infarct results in death (black crosses) of cortical neurons and corticothalamic axons and, ultimately, by the end of the first week, in death of thalamocortical relay (TCR) cells (red cross). D, Timeline showing sequence of events. TCR cell death occurs between the fourth and the sixth days after the cortical stroke and is complete by the end of the first week (line). See Introduction for details. CT, Corticothalamic; Glu, glutamate.
Materials and Methods
All experiments were performed according to protocols approved by the Stanford Institutional Animal Care and Use Committee, and every precaution was taken to minimize stress and the number of animals used in each series of experiments.
Cortical photothrombosis and brain infarction.
The photothrombosis method allows for the selective placement of cortical infarcts with reproducible area, depth, and location (Watson et al., 1985; Dietrich et al., 1987; Kharlamov et al., 1994, 1996; Schiene et al., 1996; Redecker et al., 2002). Photothrombosis was performed as described by Watson et al. (1985) as modified by Kharlamov et al. (2003) on 3-week-old [postnatal day 21 (P21)] Sprague Dawley rats (n = 25), an age at which the thalamic circuits have attained a relatively mature state (Warren and Jones, 1997). Briefly, animals were anesthetized with a mixture of ketamine (80 mg/kg) and xylazine (12 mg/kg) intraperitoneally. The scalp was incised in the midline and retracted to expose the desired area of the skull, and the periosteum was removed. Rose Bengal (40 mg/kg) (Sigma-Aldrich) dissolved in 0.9% saline was injected into the tail vein and a light from a 3-mm-diameter fiber optic cable connected to 200 W illuminator was focused on the skull for 20 min. The optical system was designed to have an emission spectrum that encompassed the in vivo absorption range of Rose Bengal (maximum absorbance at 562 nm). The light beam was centered 4.5 mm lateral and 2.5 mm caudal to bregma to induce a thrombotic lesion in the right somatosensory cortex (see Fig. 1 A,B) (Paxinos and Watson, 1986). The scalp was sutured, and the animal was allowed to recover. Buprenorphine (0.02 mg/kg) was administered as necessary after the surgery. Animals received a lethal dose of sodium pentobarbital (200 mg/kg, i.p.) 7–40 d after the cortical injury for electrophysiological recordings or 6–60 d after injury for histology. Control animals received the same injection of Rose Bengal but were not photostimulated (n = 16; aged P21) or were photostimulated after vehicle (NaCl) intravenous injection without Rose Bengal (n = 6; aged P21). In three rats, the injury extended into hippocampus and striatum. These animals were excluded from the study.
In vitro slice preparation.
Control or littermate injured Sprague Dawley rats (P28 to P35) were anesthetized with pentobarbital (200 mg/kg, i.p.) and decapitated. The brains were rapidly removed and immersed in an ice-cold (4°C) slicing solution containing the following (in mm): 234 sucrose, 2.5 KCl, 1.25 NaH2PO4, 10 MgSO4, 0.5 CaCl2, 26 NaHCO3, and 11 glucose, equilibrated with 95% O2 and 5% CO2, pH 7.4. Horizontal thalamic slices (250–270 μm) containing the thalamic ventrobasal complex (VB) and nRT were cut with a Lancer Series 1000 vibratome (Vibratome). The slices were incubated, initially at 32°C for 1 h and then at room temperature, in artificial CSF (ACSF) containing the following (in mm): 126 NaCl, 2.5 KCl, 1.25 NaH2PO4, 2 MgCl2, 2 CaCl2, 26 NaHCO3, and 10 glucose, equilibrated with 95% O2 and 5% CO2, pH 7.4. In some experiments, barium chloride (BaCl2) (1 mm) was added to the superfusate.
Electrophysiology.
Recordings were made at room temperature (22–25°C) using whole-cell patch-clamp methodology. After incubation, brain slices were transferred to the recording chamber and superfused with ACSF at a flow rate of 2 ml/min. Recordings were obtained from nRT neurons visually identified using differential contrast optics with a Zeiss Axioskop microscope and an infrared video camera.
Recording electrodes made of borosilicate glass had a resistance of 2–4 MΩ when filled with intracellular solution. For IPSCs, the internal solution contained the following (in mm): 135 CsCl, 10 HEPES, 10 EGTA, 5 QX-314 (lidocaine N-ethyl bromide), and 2 MgCl2. pH was adjusted to 7.3 with CsOH (290 mOsm). E Cl− was estimated to be ∼0 mV based on the Nernst equation. During IPSC recordings, neurons were clamped at −65 mV and events were pharmacologically isolated by bath application of the ionotropic glutamate receptor blockers DNQX (6,7-dinitroquinoxaline-2,3-dione) (20 μm; Ascent Scientific) and AP-5 (2-amino-5-phosphonopentanoic acid) (100 μm; Ascent Scientific). For EPSCs and current-clamp recordings, the internal solution contained the following (in mm): 120 K-gluconate, 11 KCl, 1 MgCl2, 1 CaCl2, 10 HEPES, 1 EGTA. pH was adjusted to 7.4 with KOH (290 mOsm). E Cl− was estimated to be approximately −60 mV based on the Nernst equation. Potentials were corrected for −15 mV liquid junction potential. During EPSC recordings, neurons were clamped at −80 mV and events were pharmacologically isolated by bath application of the GABAAR antagonist picrotoxin (50 μm; Tocris). In all recording conditions, access resistance was monitored and cells were included for analysis only if the series resistance was <20 ΜΩ and the change of resistance was <25% over the course of the experiment. In addition, adequacy of voltage clamp was demonstrated by T-current steady-state inactivation (SSIT) protocols in which peak latencies remained constant after voltage-clamp steps to −75 mV from a range of hyperpolarizing conditioning potentials (see Fig. 6 A1,A2, dashed lines). Current amplitude from the inactivation protocol, normalized to maximum, was plotted as a function of prepulse membrane potentials, and best-fitted with a Boltzmann function: I/I max = (A1 − A2)/(1 + e (V − V50%)/k) + A2, where V 50% and k represent the half-maximal voltage and Boltzmann slope factor, respectively; A1 and A2 represent initial and final I/I max values, respectively. SSIT was used as a measure to physiologically identify nRT cells (Huguenard and Prince, 1992; Deleuze and Huguenard, 2006).
Figure 6.
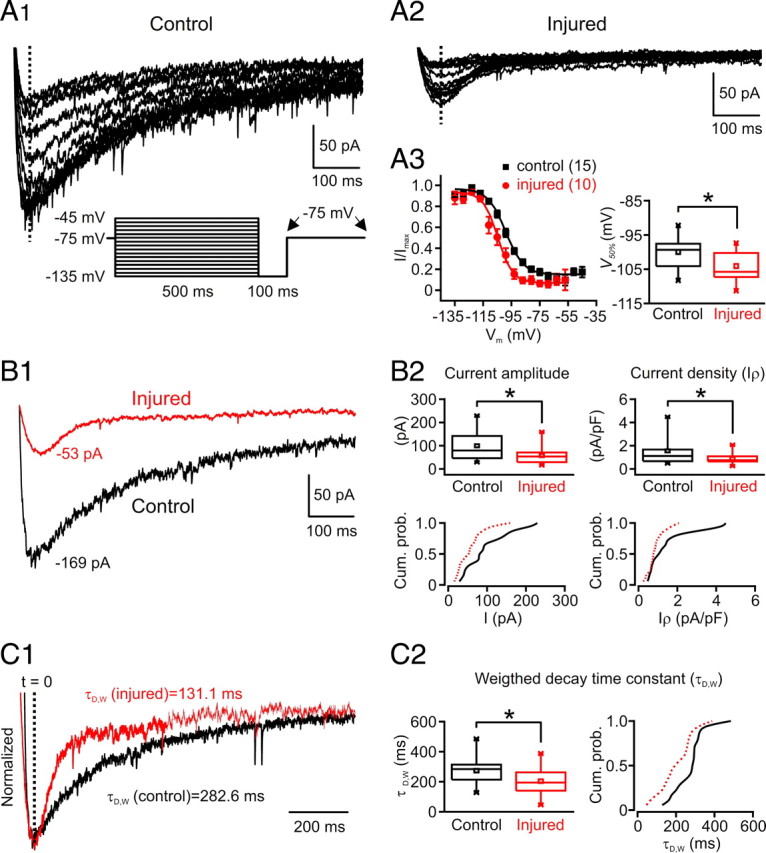
T-type current properties in nRT neurons after the cortical infarct. A, B, T-type current is decreased in nRT cells after injury. A1, A2, Representative nRT cell T-type current traces obtained with a SSI protocol in control (A1) and injured (A2) rats. T-currents were obtained with depolarizations to −75 mV from different holding potentials. At the bottom (A1), the voltage protocol is depicted: the holding potential was set to the indicated holding potentials for 500 ms, followed by a 100 ms hyperpolarization to −135 mV that preceded a command to −75 mV. The traces in A1 and A2 represent the currents obtained in the interval between the arrows in the indicated protocol (A1, bottom); large currents were obtained with the most hyperpolarizing prepulse potentials. A3, Normalized current amplitude plotted as a function of prepulse membrane potential (from 15 nRT cells from control rats and 10 nRT cells from injured rats) and best-fitted with a Boltzmann function (R 2 = 0.99 for both fits) (see Materials and Methods). The Boltzmann curve was shifted to the left and the half-maximal voltage (V 50%) was significantly more negative in the injured nRT cells compared with the controls (*p < 0.05). Quantitative data represent mean ± SEM. B, T-current amplitude is decreased in nRT cells after injury. B1, Superimposition of currents from injured (red) and control (black) nRT cells obtained at −75 mV after a −135 mV voltage step from the cells depicted in A1 and A2. B2, Top, The average current amplitude and current density (I ρ) (normalized by cell capacitance) of T-type calcium currents were both significantly (*p < 0.05) decreased in injured nRT cells (n = 18) compared with the controls (n = 18). B2, Bottom, The corresponding cumulative probabilities of the current amplitude and the current density were both shifted to the left (red, injured, vs black, control). C1, Normalized superimposition of the currents depicted in B1. C2, Left, Weighted decay time constant of the current was significantly (*p < 0.05) decreased in injured nRT cells (n = 18) versus the controls (n = 18). Right, The corresponding cumulative probabilities of the weighted decay time constant are shifted to the left in the injured nRT cells. Cum. prob., Cumulative probability.
Evoked EPSCs in nRT were obtained with a concentric bipolar stimulating electrode positioned in striatum (Str) or internal capsule (ic) (see Fig. 8 A), activating corticothalamic and thalamocortical fibers. A minimal stimulation protocol (50% failures and 50% successes) was used to activate putative single thalamocortical or corticothalamic glutamatergic fibers. Single and train stimuli (five pulses at 50–200 Hz) were applied. Evoked IPSCs were obtained with the stimulating electrode positioned in nRT ∼100–200 μm from the recording electrode to activate intra-nRT axons. A minimal stimulation protocol (50% failures and 50% successes) was defined as threshold and evoked currents were recorded with the stimulation intensity set at 1.5× threshold (Huntsman et al., 1999) (see Fig. 9 B4). Frequency–current (F–I) curves were obtained by applying depolarizing square current pulses from a holding potential of −80 mV, and F–I curve slope was calculated by measuring AP frequency during the last 100 ms of 400 ms of depolarization to minimize contributions of low-threshold Ca2+ spike (LTS) bursts.
Figure 8.

Altered evoked excitatory synaptic response in nRT. A, Low-power videomicroscopic image of a horizontal slice obtained 7 d after the cortical infarct. The nRT is localized between the ventrobasal complex (VB), formed by somatosensory thalamic relay nuclei, and the internal capsule (ic), which is separated from the cortex by the striatum (Str.). Evoked responses in nRT were obtained with a concentric bipolar stimulating electrode (stim.) positioned in the adjacent ic activating glutamatergic fibers of passage from cortex or thalamus projecting to nRT. The asterisk indicates the tip of the recording electrode (e). B1, Top, Representative averaged threshold responses (n ≥ 10) from single nRT cells from control (black) and injured (red) rats. Bottom, Evoked excitatory synaptic current (EPSC) amplitudes were significantly decreased in the injured nRT cells (n = 17) versus the controls (n = 13) (****p < 0.0001). B2, Top, Normalized EPSCs depicted in B1. Bottom, Weighted decay time constant (τD,W) was significantly increased in the injured cells (n = 17) versus the controls (n = 13) (*p < 0.05). C, Altered evoked EPSC response to a train of five stimuli at 50 Hz. C1, Representative averaged responses (n ≥ 10) from single nRT cells from control (black) and injured (red) rats at 1.5× threshold. C2, Ratio of second response to first response (or PPR). Note the significant (*p < 0.05) decrease of the PPR in the injured cells (n = 10) versus the controls (n = 6). C3, Normalized EPSC amplitude plots from control (n = 6) and injured (n = 10) nRT cells during 50 Hz stimulation. The injured cells were less likely to potentiate than the control ones (C1–C3). The amplitude of the evoked EPSC was significantly decreased for each shock (*p < 0.05, injured vs control). Error bars indicate SEM. D, Representative evoked EPSPs at different potentials in nRT cells induced by a train of five stimuli at 200 Hz at 1.5× threshold in the ic. In the control cell, the synaptic stimulation induced action potential firing, which increased with membrane hyperpolarization (3 action potentials at −77 mV, 11 at −87 mV, and 13 at −95 mV), as a large LTS (arrow) crowned with high-frequency burst of action potentials was recruited. Note the less efficient summation of EPSPs in the injured cell and a decrease in the number of action potentials with hyperpolarization (2 action potentials at −76 mV, 1 at −86 mV, and 0 at −95 mV) associated with a lack of the LTS (compare D, bottom left, with bottom right traces). e, Recording electrode; EML, medullary lamina; ic, internal capsule; stim. stimulating electrode; Str., striatum; VB, ventral-basal thalamic complex.
Figure 9.

Spontaneous synaptic activity in nRT is not altered after cortical infarct. A1, Spontaneous EPSC recordings from representative nRT neurons from control (top) and injured (bottom) rats. A2, Left, Ensemble averaged EPSCs from representative nRT cells from control (black) and injured (red) rats, plotted on the same time scale. A3, Right, Cumulative probability histograms of >1500 isolated events from control (n = 19 neurons) and injured (n = 16) neurons demonstrate no significant changes in amplitude and kinetics. B1, Spontaneous IPSC recordings from representative nRT cells from control (top traces) and injured (bottom traces) rats. B2, Ensemble averaged IPSCs from representative nRT cells from control (black) and injured (red) rats, plotted on the same timescale. B3, Cumulative probability histograms of isolated events from control (n = 28 cells; 2599 events) and injured (n = 19 cells; 1858 events) animals demonstrate no significant changes in amplitude and kinetics (p > 0.05). B4, Left, Superimposition of averaged IPSCs from representative nRT cells evoked by intra-nRT stimulation (see Materials and Methods). Right, Statistical graphs from control (n = 12) and injured (n = 7) nRT cells demonstrating no significant change in amplitude (p > 0.7, control vs injured) and kinetics (p > 0.9, control vs injured) of the evoked IPSC. Ampl., Amplitude; Cum. prob., cumulative probability; ns, not significant.
Data acquisition and analysis.
A Digidata 1320 digitizer and pClamp9 (Molecular Devices) were used for data acquisition and analysis. Signals were amplified with an Axopatch 200A amplifier (Molecular Devices), sampled, and filtered at 10 kHz. EPSCs and IPSCs were detected and analyzed with wDetecta, a custom postsynaptic current detection program (http://huguenardlab.stanford.edu/apps/wdetecta). The amplitude of action potentials was calculated as the potential difference between their voltage threshold and the peak of the waveform. Numerical values are given as means ± SEM unless stated otherwise. Statistical box charts show the following: mean (central dot), median (large horizontal line), maximal and minimal values (short horizontal lines), 99 and 1% range (crosses), percentile 25–75 range (box), and 5–95 range (whiskers). Statistical significance was assessed by performing a one-way ANOVA, t test, or Mann–Whitney rank sum test. Statistical analyses were performed with SigmaStat 3.5 and Origin 7.0 (OriginLab). For evoked EPSCs, the peak-to-baseline decay phase of the resulting current trace was fitted by the double-exponential function: I = A 1 e −t/τ1 + A 2 e −t/τ2, where A 1 and A 2 are the slow and fast amplitude components, and τ1 and τ2 are the slow and fast decay time constants, respectively. The weighted decay time constant (τD,W) was calculated using the following equation: τD,W = (τ1 A 1 + τ2 A 2)/(A 1 + A 2).
Morphological identification and three-dimensional reconstruction.
During electrophysiological experiments, nRT cells were filled with 0.2–0.5% biocytin (Sigma-Aldrich) included in the internal solution. At the end of the recordings, whole slices were then fixed with 4% paraformaldehyde solution and processed using the standard avidin–biotin peroxidase method (Horikawa and Armstrong, 1988; Tseng et al., 1991) or immunofluorescent staining. nRT cells recorded from control and injured animals were located at the same dorsal coordinates. Biocytin-filled cells were reconstructed three-dimensionally (see Fig. 3 B) using a Zeiss Axioskop microscope attached to a Neurolucida system (MBF Bioscience). Dendrites and axonal arbors were traced at 50× and putative axonal boutons were marked to allow for differentiation between small (<0.5 μm) and big boutons (>0.5 μm) (see Fig. 3 C,D). Dendritic branching was examined by using a Sholl analysis, which measures the degree of branching as a function of distance from the soma (see Fig. 3 B) (Sholl, 1953). Briefly, a series of concentric circles were centered on the soma at 10 μm intervals, and the number of dendrites intersecting each circle was counted (see Fig. 3 B). Fluorescent biocytin images were obtained using a confocal microscope with a 63× oil-immersion objective. The angle and circularity (circularity = 4π · area · perimeter−2) of the parvalbumin-labeled nRT cells were calculated using ImageJ (Rasband, 2006). A circularity value of 1.0 indicates a perfect circle. “Angle” is the angle of the major axis of the cell body, which was used to quantify the variability in orientation of individual nRT cells within the nucleus.
Figure 3.
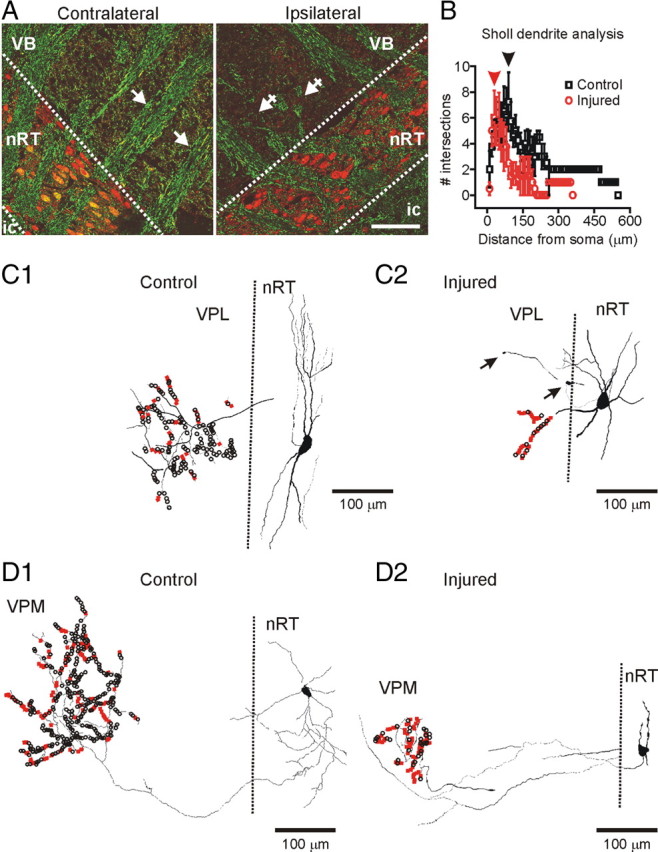
Anatomical changes in thalamus after the cortical infarct. A, Horizontal thalamic slices 7 d after the cortical infarct immunolabeled for parvalbumin (red) that labels nRT neurons and NF (green) that labels neuronal fibers. Note the parallel organization of the thalamocortical and corticothalamic fibers on the contralateral side (arrows) but disorganization and a massive loss of the fibers (crossed arrows) ipsilateral to the cortical infarct. The normally fusiform nRT somata (contralateral side) were more irregular and circular in the injured side. Note the colocalization of parvalbumin and NF immunoreactivity in somata of nRT cells as well as in the fibers on the contralateral side but not on the injured side. Scale bar, 100 μm. B, Sholl dendrite analysis of dendrite density (see Materials and Methods) by placing a series of concentric circles, spaced at 10 μm intervals centered on the somata. The number of dendritic intersections with each circle was counted. Mean (±SEM) number of intersections with each circle from four control and four injured cells is depicted. The mean values were significantly different at distances >100 μm from the soma (*p < 0.05). The Sholl diameter with the greatest number of intersections was smaller in injured cells (∼70 μm; red arrowhead) compared with controls (∼100 μm; black arrowhead), indicating an overall shrinkage of the dendritic tree. C1, C2, Reconstructed control (C1) and injured (C2) nRT cells projecting to VPL. Note the decreased dendritic and axonal length as well as a reduced number of axonal boutons in the injured nRT cell (C2) projecting to the cell-deprived VPL compared with the control nRT cell projecting to a healthy VPL (C1). D1, D2, Reconstructed control (D1) and injured (D2) nRT cells projecting to VPM. Note the decreased length and number of dendrites in the injured nRT cell as well as a strongly reduced number of axonal boutons in nRT cell projecting to the apparently noninjured VPM (D2) compared with the control nRT cell projecting to the corresponding thalamic area in the control rat (D1) (see text for details). The big axonal boutons (>0.5 μm) are indicated in black, and the small boutons (<0.5 μm) are indicated in red. ic, Internal capsule; VB, ventral-basal thalamic complex; VPL, ventral posterolateral thalamic nucleus; VPM, ventral posteromedial thalamic nucleus.
Histology and immunocytochemistry.
In some cases, 6–60 d after injury, animals were anesthetized with pentobarbital (200 mg/kg, i.p.) and perfused transcardially with saline followed by 4% paraformaldehyde (Sigma-Aldrich) in 0.1 m phosphate buffer (Sigma-Aldrich), pH 7.4. The brains were removed and postfixed in 4% phosphate-buffered paraformaldehyde at 4°C overnight. Digital images were taken for documentation of the position and extent of lesions (see Fig. 1 A), and the brains were cryoprotected with 30% sucrose buffer and frozen on dry ice. Horizontal or coronal 50 μm sections were obtained with a sliding freezing microtome (Microm; HM 400) and Nissl stained for histological analysis of the cortical injury induced by Rose Bengal photothrombosis (see Fig. 1 B). Free-floating sections were preincubated twice with 50% alcohol for 10 min each time and later in 10% normal goat serum in PBS, followed by incubation with the primary antibody against glial fibrillary acidic protein (GFAP) (polyclonal; 1:500; Millipore) done in conjunction with neuron-specific nuclear protein (NeuN) (monoclonal; 1:1000; Millipore) or with parvalbumin (PV) (monoclonal; 1:1000; Sigma-Aldrich) at 4°C overnight on a shaker. Other sets of sections were incubated with Neurofilament-200 kDa (NF) monoclonal antibody (Sigma-Aldrich) at a concentration of 1:100 in conjunction with parvalbumin polyclonal antibody (Millipore) at a concentration of 1:1000. The T-type channel Cav3.3 polyclonal antibody (1:500) (kindly provided by Terrance P. Snutch, University of British Columbia, Vancouver, BC, Canada) was combined with parvalbumin monoclonal antibody at a concentration of 1:1000 (Sigma-Aldrich). The slices were rinsed in PBS and incubated with the correspondent fluorescent second antibodies (Invitrogen) at a concentration of 1 μg/ml. Sections were mounted on slides using Vectashield Mounting Media, and the double immunofluorescence was assessed with a laser confocal microscope (Zeiss LSM 510).
Results
Location and size of the cortical infarct
Focal thrombotic lesions were performed unilaterally in the somatosensory cortex using the Rose Bengal photothrombosis technique (Watson et al., 1985; Kharlamov et al., 2003) on P21 rats (n = 20). All lesioned animals had highly consistent, well demarcated areas of focal infarction within the right somatosensory cortex (Fig. 1 A). The area of cortical infarction appeared as a cystic, scarred area of 2 mm in diameter. A Nissl-labeled coronal section taken through the lesion (Fig. 1 B) demonstrated extensive neuronal loss in the area of the infarct core that extended to the subcortical white matter without damaging the hippocampus. The infarct core was usually dislodged during tissue sectioning. In cortex adjacent to the infarct core, neither cell loss nor cytoarchitectural abnormalities were detected (data not shown). The lesion location, size, and depth were highly reproducible (n = 22 animals). No abnormalities were detected in the brains of control animals who received a Rose Bengal intravenous injection without photostimulation (n = 14) or in sham-operated photostimulated rats who did not receive Rose Bengal injection (n = 6). The schematic in Figure 1 C illustrates the postthrombotic degeneration of corticothalamic axons (black crosses) and secondary degeneration of thalamocortical relay axons (red crosses), which is complete by the end of the first week.
Location of retrograde cell death in thalamus
We first examined the effect of the cortical infarct on cell death in thalamus. The injury was first assessed with NeuN labeling, which showed cell loss specifically in the ventral posterolateral (VPL) thalamic nucleus ipsilateral to the cortical infarct (n = 6 animals) (Fig. 2 B2–F2). The cell loss in VPL was consistently colocalized with a strong GFAP labeling (Fig. 2 D2) signifying gliosis (Schmidt-Kastner et al., 1993). The cell loss and gliosis were indistinguishable 7, 14, 42, and 60 d after the cortical infarct (data not shown), indicating that cell loss was essentially complete by the end of the first week after the infarct. Interestingly, the cell loss and gliosis were restricted to VPL and absent in the adjacent nRT or other thalamic relay nuclei [ventrolateral thalamic nucleus (VL), VPL, ventral posteromedial thalamic nucleus (VPM), posterior thalamic nuclear group (Po)] (Fig. 2 C2). Neither cell loss nor gliosis were observed in the contralateral thalamus (Fig. 2 A1–F1) (n = 6 animals).
Figure 2.
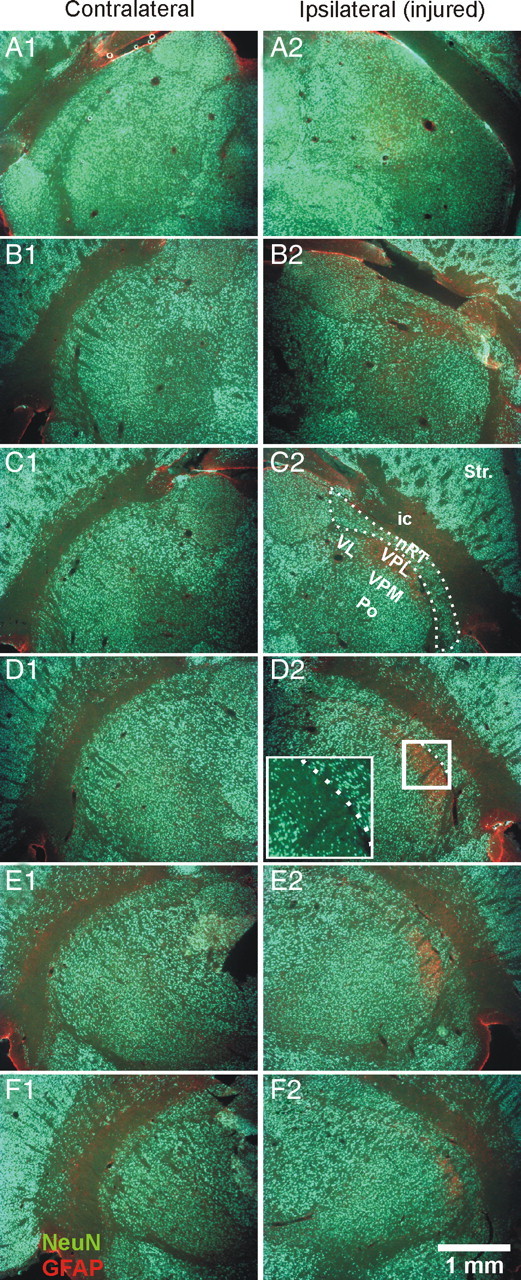
Cell death and gliosis in the ventral posterolateral thalamic nucleus. A–F, Horizontal thalamic 50 μm sections [every 250 μm; top row (A), most dorsal; bottom row (F), most ventral] from an injured rat with combined immunolabeling for GFAP (red) and NeuN (green). The cortical infarct results, after 7 d, in death of neurons and gliosis specifically in the ipsilateral VPL thalamic relay nucleus (B2–F2). Note, on the injured side, the strong GFAP immunolabeling in VPL associated with the absence of NeuN immunolabeling (B2–F2). The most strongly affected thalamic area (D2, white box) is enlarged to reveal the localized cell loss evident in NeuN staining. Note the cell loss in VPL but not in other relay nuclei (VPM, VL, Po), nor in nRT (dashed line) (C2). The corresponding contralateral side is not affected by the injury (A1–F1). ic, Internal capsule; Po, posterior thalamic nuclear group; Str., striatum; VL, ventrolateral thalamic nucleus; VPL, ventral posterolateral thalamic nucleus; VPM, ventral posteromedial thalamic nucleus.
Loss and disorganization of corticothalamic and thalamocortical fibers
We next examined the extent of the loss of corticothalamic and thalamocortical axons after injury as detected with NF labeling in four animals. As illustrated in Figure 3 A, the parallel organization of the fibers apparent in the contralateral (unaffected) hemisphere (arrows) was lost in the hemisphere ipsilateral to the cortical infarct (n = 4 animals). The loss of fibers was restricted to the VPL region and remaining fibers were disorganized (Fig. 3 A, crossed arrows).
Morphological changes in nRT
Somata
Under visual inspection, we observed a disorganized structure in terms of soma orientation. Somatic changes were first examined with parvalbumin labeling of nRT neurons. The size of the soma was similar in the injured and control cells (long axis, ∼25 μm). However, the fusiform shape of somata typically observed in control slices and in the contralateral side was lost in the injured side, where the cells appeared more circular (Figs. 3 A, 5 D). In nRT adjacent to the injured VPL, the circularity of the cells was increased by 25% (injured, 0.65 ± 0.01, n = 396 cells; vs contralateral, 0.52 ± 0.01, n = 379 cells from 4 rats; p < 0.0001). The circularity of nRT cells located ipsilateral to the injury, but >300 μm from the injured VPL, was less affected, but still 18% larger than the corresponding contralateral nRT region (injured, 0.52 ± 0.01, n = 382 cells; vs 0.44 ± 0.01, n = 341 homotopic contralateral cells; p < 0.0001).
Figure 5.
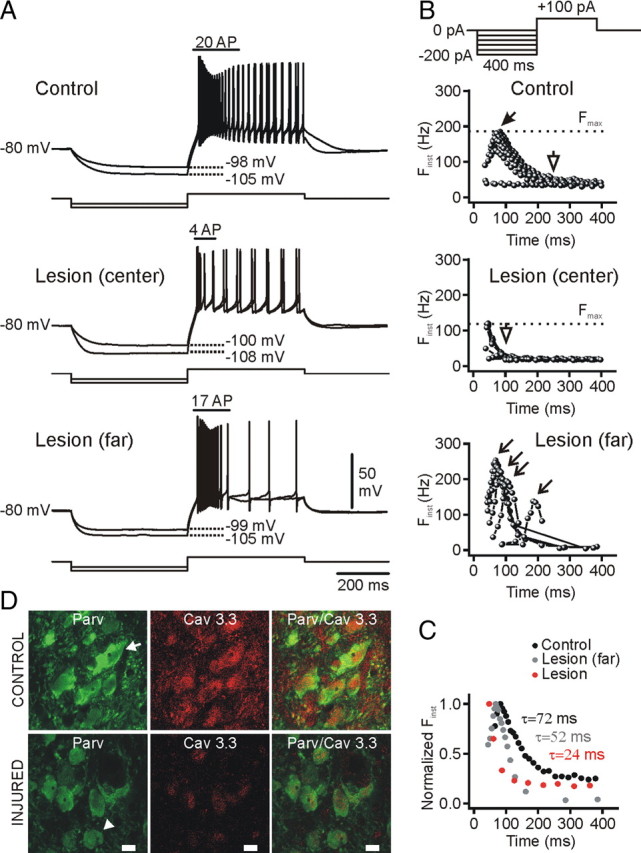
Low-threshold calcium spikes are decreased in nRT cells after injury. A, Voltage responses (top traces) from control and injured nRT cells to intracellular injections of negative and positive square current pulses (bottom traces) from −80 mV. At the top (B), the current protocol is depicted: the negative current step of variable intensity was followed by a depolarizing current step of +100 pA inducing a burst of action potentials followed by a regular firing. Note that, for similar membrane potential hyperpolarizations, the burst firing in the injured cell was significantly reduced compared with the control cell. B, Plot of the instantaneous firing frequency (F inst) in response to a positive current step of +100 pA after a negative current step of variable intensity (see the corresponding protocol at the top). Note the accelerating–decelerating pattern in the control cell firing bursts, which was absent in the injured cell (lesion center). Also, note the relative constancy of the latency to peak frequency in the control cell (filled arrow), which became variable (open arrows) in the nRT cell far (>300 μm) from the injury (lesion far). The shortest peak latency was obtained at the break of the strongest hyperpolarization. Note the decrease in the maximal F inst (F max, dashed line) in the injured cell (∼110 Hz, lesion center) compared with the control (∼200 Hz). C, Superimposition of the normalized instantaneous frequencies (F inst) at the saturation of the maximal F inst from the cells in B. Note the reduction of the decay time constant of the F inst correlated to the distance from the injury. D, Combined Cav3.3 (red) and parvalbumin (green) immunolabeling. The intensity of both parvalbumin and Cav3.3 immunolabeling was reduced in the injured nRT cells compared with the contralateral cells from the corresponding nRT region. Cav3.3 and parvalbumin immunolabeling was colocalized in the contralateral nRT cells, but Cav3.3 expression was decreased in the injured nRT. Note the fusiform shape of contralateral cells (arrow), which was less marked in the injured nRT cells (arrowhead). Scale bar, 10 μm. F inst, Instantaneous firing frequency; F max, maximal instantaneous firing frequency; Parv, parvalbumin.
Furthermore, the normal parallel orientation of nRT cells in the unaffected (contralateral) side was lost in the injured side (Fig. 3 A). This cellular disorganization was quantified by measuring the SD of the major axis angle of the nRT cells, which was significantly (p < 0.0001) increased in the nRT adjacent to the injured VPL (30.6 ± 2.3°), compared with the corresponding contralateral nRT (15.2 ± 1.4°). Major axis angle of nRT cells located far (>300 μm) from the injured VPL was not different compared with that of cells from the corresponding contralateral nRT region (ipsilateral, 19.5 ± 7.3°; contralateral, 23.0 ± 0.0°; p > 0.1).
Moreover, NF and parvalbumin were colocalized in somata and fibers on the contralateral side but not the injured side (Fig. 3 A) (n = 4 rats). Because parvalbumin and NF are normally expressed in somata and fibers (Majak et al., 1998; Lee and Cleveland, 1994; Clinton and Meador-Woodruff, 2004; Clinton et al., 2004), the reduced labeling on the side ipsilateral to the cortical infarct (Fig. 3 A) suggests a loss or decrease in their expression after injury, which is associated with a more circular somatic shape.
Interestingly, the morphological changes described above were also found 2 months after the cortical infarct (data not shown), suggesting that these changes are long-lasting and do not represent a transient, perhaps preapoptotic phenomenon.
Dendrites and axons
The dendritic and axonal changes were assessed after a three-dimensional reconstruction of nRT neurons filled with biocytin (Fig. 3 C,D). The cortical infarct induced striking morphological changes in nRT neurons projecting to the injured cell-deprived thalamic areas (VPL) and in nRT cells projecting to the thalamic areas less affected by cell loss and gliosis (VPM) (Fig. 3 C,D). Cortical infarct resulted in (1) decreased mean dendritic length (Table 1), (2) decreased mean number of dendritic arborizations (Fig. 3 B), (3) decreased mean axonal length (Table 1), and (4) decreased mean number of axonal boutons in the relay thalamic nuclei. Interestingly, the number of small boutons (<0.5 μm) per cell was not significantly decreased, whereas the number of big boutons (>0.5 μm) was decreased by ∼93% in the injured nRT cells compared with the controls (Table 1). It is important to note that the cortical infarct-induced morphological changes described above (decrease in the dendritic and axonal lengths, circular soma, and decreased total number of synaptic boutons) were observed not only in nRT neurons projecting to the injured thalamus (VPL) (Fig. 3 C) but also in those projecting to VPM (Fig. 3 D), which was not affected by cell death or gliosis (Fig. 2). This result suggests that the loss of boutons in the axons of nRT cells does not result from a local cell loss in the target thalamic nucleus, but rather from a pathological change in nRT cells after cortical stroke. No major differences in axon collaterals within nRT were observed (data not shown).
Table 1.
Morphological changes in nRT neurons after a cortical infarct
| Dendritic length (μm) | Axon length (μm) | Synaptic boutons/cell | Mean nearest bouton (μm) | Closest nearest bouton (μm) | Farthest nearest bouton (μm) | No. of small boutons/cell | No. of big boutons/cell | |
|---|---|---|---|---|---|---|---|---|
| Control | 1242.2 ± 80.4 | 3420 ± 463.3 | 246.7 ± 74.7 | 4.7 ± 0.1 | 1.0 ± 0.5 | 25.0 ± 9.9 | 71.0 ± 20.8 | 175.7 ± 57.2 |
| Injured | 623.5 ± 118.5 | 1014.4 ± 339.5 | 36.0 ± 22.2 | 4.2 ± 0.5 | 2.7 ± 1.2 | 8.8 ± 2.7 | 25.5 ± 15.2 | 10.5 ± 7.0 |
| ANOVA | p < 0.05 | p < 0.01 | p < 0.05 | ns | ns | ns | ns | p < 0.05 |
Morphological analysis was from four rats. Big synaptic boutons were those >0.5 μm, whereas small synaptic boutons were <0.5 μm. All values are expressed as means ± SEM.
ns, Not significant (p > 0.05).
Decreased intrinsic excitability in nRT cells
Passive membrane properties
To examine whether the altered morphology of nRT cells was associated with a change in intrinsic excitability, we first examined the membrane V–I relationship, which was determined by measuring membrane potential changes in response to a series of intracellular square current pulses (Fig. 4 A,B). The input resistance (R in) and membrane time constant (τm), measured from the to responses to current steps in linear portion of the V–I plot, were each decreased by 30% in injured nRT neurons compared with control cells (Fig. 4 C1,C2,D,F1,F2). The membrane capacitance (C m) was unchanged (Fig. 4 F3), suggesting that the reduced R in did not result from an increased membrane surface but rather from an increased membrane leak conductance. Other basic electrical membrane properties including resting membrane potential and action potential waveform were similar in injured and control cells (Table 2). In both cell populations, an inward rectification was observed in response to negative current pulses inducing hyperpolarizations past −95 mV (Fig. 4 D). This inward rectification was likely caused by the hyperpolarization-activated inward cationic current (I h) and inwardly rectifier K+ current (I Kir) (Abbas et al., 2006; Rateau and Ropert, 2006). F–I analysis (Fig. 4 E1,E2, Table 2) confirmed a decreased excitability after injury, showing (1) a 32% decrease in slope (see Materials and Methods) and (2) an 85% increase in rheobase (i.e., the minimal current intensity required to trigger an action potential firing) (Table 2). Moreover, the injured cells reached a maximal firing rate of only ∼60 Hz (Fig. 4 E1,E2), whereas the control cells reached a maximal firing rate of at least 80 Hz. All the alterations in intrinsic excitability described above persisted 4–6 weeks after the cortical stroke (supplemental Fig. 2, available at www.jneurosci.org as supplemental material) at a time when the seizures are expected to occur (Kelly et al., 2001; Kharlamov et al., 2003), showing that the early poststroke alterations in nRT are a long-term phenomenon, rather than a transient alteration. These findings reinforce the potential link between these poststroke thalamic alterations and the later epileptogenesis.
Figure 4.

Effects of focal cortical infarct on electrical membrane properties of nRT neurons. A, B, Voltage responses of control (A) and injured (B) nRT thalamic neurons (top traces) to intracellular injection of positive and negative square current pulses (bottom traces). At the break of the negative current pulses, control nRT cells exhibited a large rebound response eliciting a burst of action potentials (A), which was reduced in injured nRT cells in which each burst elicited fewer action potentials (B). C1, Top, superimposition of the same amplitude voltage responses to intracellular injections of negative current pulses of −80 and −120 pA in control (black) and injured (red) cells, respectively. Note a decreased membrane input resistance and a shorter membrane time constant in the injured cell (red) compared with the control cell (black). In the injured cell, the same hyperpolarization failed to induce a rebound burst at the break of the negative current pulse. Although a rebound burst could be obtained after stronger hyperpolarization (C2), it was much less robust compared with the control cell (red injured vs black control) and elicited approximately one-half the number of APs (C2). C2, The rebound response durations as well as the number of elicited action potentials are indicated by horizontal bars and text with the corresponding color code. D, Plots of voltage (V) as a function of current intensity (I), measured from the cells shown in A and B. The apparent input resistance was measured from the linear portion of the V–I curve. Note the decreased input resistance in the injured cell compared with the control. E1, Plot of the mean firing frequency (〈F〉) as a function of current intensity. Note the decreased firing in the injured cell. E2, Voltage responses of control (black) and injured (red) nRT cells to intracellular injections of positive square current pulses. In the injured cell, much higher current intensities were required to induce similar firing rate. F, After the cortical injury, the mean membrane input resistance (R in) of nRT cells was significantly decreased (***p < 0.0005, control, n = 33 cells; vs injured, n = 26 cells) (F1), the mean membrane time constant (τm) was significantly decreased (****p < 0.0001, control, n = 33 cells; vs injured, n = 26 cells) (F2), and the membrane capacitance (C m) was unchanged (p > 0.5; control, n = 33 cells; vs injured, n = 26 cells) (F3). ns, Not significant.
Table 2.
Comparison of electrical membrane properties of injured and control nRT neurons
| V m (mV) | AP ampl. (mV) | AP duration (ms) | AP threshold (mV) | AHP ampl. (mV) | F–I slope (Hz/pA) | Rheobase (pA) | |
|---|---|---|---|---|---|---|---|
| Control | −69.2 ± 5.2 | 60.9 ± 2.5 | 1.6 ± 0.1 | −57.8 ± 1.2 | 16.8 ± 0.95 | 0.31 ± 0.04 | 34.3 ± 2.5 |
| Injured | −66.5 ± 6.2 | 65.5 ± 2.2 | 1.5 ± 0.2 | −55.4 ± 0.9 | 18.9 ± 1.04 | 0.21 ± 0.01 | 63.3 ± 10.1 |
| ANOVA | ns | ns | ns | ns | ns | p < 0.05 | p < 0.001 |
The membrane resting potential (V m) and AP properties were calculated from 26 injured and 33 control nRT cells and were similar in both groups. F–I curve slope and rheobase were calculated from 24 injured and 30 control cells and were both significantly altered in the injured nRT cells compared with the control cells. All values are expressed as means ± SEM. AHP, Afterhyperpolarization; ampl., amplitude.
ns, Not significant (p > 0.05).
Low-threshold calcium spike
In 97% of nRT cells (32 of 33) from control rats, a hyperpolarization to −95 mV or more was followed by a rebound of excitation characterized by a LTS (Llinás and Jahnsen, 1982; Steriade et al., 1990) crowned by a burst of action potentials (Fig. 4 A,C1,C2, black traces). Interestingly, in the injured rats, the same hyperpolarizations failed to induce rebound bursts in 50% of cells (13 cells of 26). However, in 3 of those cells (of 13), an LTS could be evoked by injecting a positive current pulse of +100 pA after the hyperpolarizing step (Fig. 5 A, middle panel; lesion center; see the protocol in Fig. 5 B at the top). These results indicate that LTS was absent in ∼38% (10 cells of 26) of nRT cells ipsilateral to the cortical infarct, suggesting a functionally complete loss of T-type channels in these cells. In those ipsilateral nRT cells in which an LTS could be evoked as a post-hyperpolarization rebound response, the mean maximal number of action potentials within the burst was 9.7 ± 1.1 (range, 3–14 action potentials; n = 13 cells). In the control cells, by contrast, the maximal number of action potentials in a burst was significantly higher (13.7 ± 0.79; range, 6–23 action potentials; n = 32 cells; p < 0.01). Moreover, in the injured nRT cells that expressed LTS (n = 16 cells), the LTS was less robust than in control cells (Fig. 4, compare A, B; C2; Fig. 5 A) and its kinetics was altered. Specifically, the LTS decayed more rapidly in the injured cells compared with the controls (Fig. 5 C). Interestingly, nRT cells located far from the thalamic injury (>300–400 μm from the portion of nRT adjacent to VPL) expressed larger LTS responses than those nRT cells located proximal to the center of VPL injury (Fig. 5 A), despite the increased membrane leak. Such responses were less robust and decayed much faster than in control cells but slower than the LTS of nRT cells close to the VPL injury (Fig. 5 C).
These alterations in LTS properties persisted 4–6 weeks after the cortical stroke when the seizures are expected to occur. Specifically, in the injured nRT cells (1) the maximal number of action potentials in a post-hyperpolarization rebound burst was twofold reduced (injured, 4.8 ± 2.0; range, 0–10 action potentials; n = 5 cells; control, 9.6 ± 1.6; range, 4–20 action potentials; n = 8 cells; p < 0.05) and (2) the intraburst maximal firing frequency was reduced (injured, 46.2 ± 20.3 Hz; n = 5 cells; control, 101.6 ± 13.9 Hz; n = 8 cells; p < 0.05).
T-type calcium current is altered after injury
The altered LTS properties in nRT cells ipsilateral to cortical infarct could be attributable to a reduced number of T-channels and/or a change in their biophysical properties. To answer this question, we recorded T-currents from control and injured nRT cells with the same steady-state inactivation (SSI) protocol illustrated in Figure 6 A1, bottom.
Steady-state inactivation of T-type currents
The injured cells exhibited an abnormal voltage dependence of T-type calcium currents (Fig. 6 A3, left panel), with the SSI curve showing a hyperpolarized shift compared with the control nRT cells (Fig. 6 A3) (injured V 50%, −104.1 ± 1.5 mV, n = 10 cells; control V 50%, −99.9 ± 1.2 mV, n = 15 cells; p < 0.05). The Boltzmann function slope factor was similar in both cell groups (injured, 5.1 ± 0.7 mV, n = 10 cells; control, 5.2 ± 0.4 mV, n = 15 cells; p > 0.5). Such a hyperpolarized shift in the half-maximal voltages (V 50%) for the SSI could be attributable to the fact that the cells have an increased leak conductance after injury (Fig. 4). However, the hyperpolarized shift of the V 50% of the SSI was also observed using a CsCl internal solution that blocks leak channels and improves uniformity of voltage control (control, −84.4 ± 0.5 mV, n = 3 cells; injured, −89.4 ± 1.1 mV, n = 3 cells; p < 0.05), which strongly suggests that the hyperpolarized shift was not attributable to the leak.
Decreased peak density of T-type calcium current
Interestingly, the peak T-current amplitude was decreased by ∼42% in the injured cells (57.6 ± 8.6 pA; n = 18) compared with the controls (99.7 ± 14.3 pA; n = 18; p < 0.05) (Fig. 6 B1,B2, left panel). The peak current density was similarly decreased by ∼44% in the injured cells (0.9 ± 0.1 pA/pF; n = 18) compared with the controls (1.6 ± 0.3 pA/pF; n = 18; p < 0.05) (Fig. 6 B2, right). Thus, the difference in peak amplitude cannot be accounted for by cell size.
Increased T-current inactivation rate
The weighted decay time constant (τD,W) of T-current was decreased by 26% in the injured cells (203.8 ± 21.2 ms; n = 18) compared with the controls (273.9 ± 18.9 ms; n = 18 cells; p < 0.05) (Fig. 6 C1,C2). The same decreases in T-current amplitude and τD,W were found with CsCl-filled recording electrodes (data not shown), indicating that these changes were independent from the recording electrode internal solution.
Loss of Cav3.3 isoform in the ipsilateral nRT after cortical infarct
The decreased amplitude and faster decay rate of T-currents as well as the hyperpolarized shift in the SSI could result from a loss of T-channels and/or a change in their isoform expression and/or location. Three different isoforms of T-channels have been identified in mammals: α1G/Cav3.1, α1H/Cav3.2, and α1I/Cav3.3 (Lee et al., 1999; McRory et al., 2001; Murbartián et al., 2002; Perez-Reyes, 2003), with all expressed to some extent in nRT neurons (McKay et al., 2006), and each with differences in their voltage dependence and kinetic properties. Because Cav3.3 channels are (1) widely expressed in nRT somata and dendrites (McKay et al., 2006), (2) have slower inactivation kinetics compared with the other two isoforms (Lee et al., 1999), and (3) have the most depolarized half-inactivation voltage (4 mV compared with Cav3.1 and 12 mV compared with Cav3.2 when expressed in HEK-293 cells) (Lee et al., 1999), we tested the hypothesis that this isoform was lost in nRT after cortical infarct leading to reduced current amplitudes and faster decay kinetics. Indeed, Cav3.3 immunolabeling was dramatically decreased in nRT ipsilateral to the cortical injury (Fig. 5 D) in every case (n = 4 animals of 4), particularly in nRT adjacent to the injured, cell-deprived VPL, and its loss was less prominent in nRT cells far from VPL (>300 μm).
Altered burst morphology in injured nRT cells
We next examined the consequence of the decreased amplitude and decay time of T-current on maximal burst firing properties of nRT cells, as assessed by injecting a positive current pulse of same intensity (+100 pA push pulse) after hyperpolarizing current steps of variable intensity (Fig. 5 B, protocol at the top) (Porcello et al., 2003). After similar membrane potential hyperpolarizations, the maximal number of action potentials within the burst was reduced in nRT neurons adjacent to the injured VPL compared with the control cells (control, 14.8 ± 0.8 action potentials; range, 11–22; n = 15 cells from 8 rats; injured, 8.0 ± 1.2 action potentials; range, 3–16; n = 13 cells from 6 rats; p < 0.0001) but not significantly reduced in nRT cells far (>300 μm) from the injury (11.1 ± 2.1 action potentials; range, 3–17; n = 7 cells from 4 rats; p > 0.05) (Fig. 5 A). This result is in agreement with the decreased amplitude of T-current in the injured cells (Fig. 6 B1,B2).
In control cells, independent of the level of hyperpolarization, each burst showed the accelerating–decelerating spike firing pattern characteristic of a LTS-evoked burst in nRT neurons (Mulle et al., 1986; Spreafico et al., 1988; Avanzini et al., 1989; Bal and McCormick, 1993; Contreras et al., 1993; Slaght et al., 2002), reaching a peak value of ≥180 Hz (n = 15 cells from 8 control rats) (Fig. 5 B). In nRT neurons adjacent to the injured VPL (Fig. 5 B, lesion center), the accelerating pattern was lost in 62% of cells and was observed only for the first interspike interval in 23% of cells, and an accelerating/decelerating pattern was observed only in 15% of cells. Moreover, in all nRT cells adjacent to VPL (n = 13 cells), the peak frequency value was lower (∼120 Hz) compared with the control cells (n = 15; see above) (Fig. 5 B, lesion center).
In nRT neurons located ipsilateral to the cortical infarct, but far from the injury (>300 μm), the accelerating–decelerating pattern was conserved, although its kinetics was different from the control cells (Fig. 5 B, lesion far). Specifically, (1) after weak hyperpolarization, the latency of the peak was delayed by ∼100 ms compared with the control cells (Fig. 5 B, compare control, lesion far); and (2) the decay time of the instantaneous firing frequency was much shorter (∼50 ms) than in the control cells (>70 ms) but longer than in the nRT cells located in the center of injury (<30 ms) (Fig. 5 C). This result is in agreement with the voltage-clamp recording of the T-currents, which showed a faster decay time in the injured cells (Fig. 6 C1,C2).
Decreased excitability results from upregulation of I Kir
The decreased excitability of nRT neurons in the injured animals could be attributable to an increased leak current. Among the currents that could potentially contribute to the leak, the inwardly rectifying potassium (Kir) current is a good candidate (Hagiwara et al., 1978; Bichet et al., 2003; Rateau and Ropert, 2006). We therefore tested the effect of Ba2+, which blocks I Kir (Hagiwara et al., 1978) without affecting the H-current (I h) (Pape, 1996), on nRT cells from control and injured animals. We examined the effect of Ba2+ on the membrane I–V relationship of nRT cells by measuring currents generated by voltage steps from −65 to −135 mV in voltage-clamp mode (Fig. 7 A,B). nRT neurons from control animals expressed current responses similar to those described by previous studies (Santoro et al., 2000; Rateau and Ropert, 2006). As expected from the current-clamp recordings (see above), between −65 and −85 mV, which is the range of the resting membrane potential (Table 2), nRT cells from injured animals had a significantly lower R in compared with the controls (control, 382.6 ± 25.9 MΩ, n = 5 cells; injured, 261.8 ± 35.2 MΩ, n = 5 cells; p < 0.05) (Fig. 7 C). Bath application of 1 mm Ba2+ induced an inward current in nRT cells from both control and injured animals (Fig. 7 A,B). Between −65 and −85 mV, Ba2+ application increased the membrane R in by 33% in the control cells and by 134% in the injured cells. After Ba2+ application, the R in of control and injured nRT cells were similar (calculated in voltage range of −65 to −85 mV; control, 507.5 ± 36.2 MΩ, n = 5 cells; injured, 613.6 ± 192.3, n = 5 cells; p > 0.5) (Fig. 7 C, left). The effect of Ba2+ at this potential could be attributable to the block of a weakly rectifying Kir current (Bichet et al., 2003).
Figure 7.

Ba2+ restores the membrane input resistance but not the low-threshold calcium spike in the injured nRT cells. A, B, Current recordings in nRT cells from control (A) and injured (B) animals before and after application of 1 mm Ba2+. Two representative examples of nRT cells are illustrated for control (A1) and injured (B1) animals. The neurons were maintained at −75 mV and voltage steps between −65 and −135 mV were applied for 4 s at increments of 10 mV (A1, top trace). The instantaneous current (I inst) was measured at the beginning of the negative voltage step (dashed lines in A1, B1). A2, B2, Representative plots of I inst against the membrane potential (V m) before and during 1 mm Ba2+ application from a control cell (A2) and an injured cell (B2). Note the bigger effect of Ba2+ on the slope conductance of the injured cell compared with the control. C, Pooled results of membrane input resistance (R in) from five control and five injured cells recorded before and after Ba2+ application. Before Ba2+ application, R in was significantly (*p < 0.05) different in injured and control cells at both resting potential range (between −65 and −85 mV) and below −105 mV. After Ba2+ application, the R in was similar in the control and injured cells at both resting potential (between −65 and −85 mV) as well as at more hyperpolarized membrane potentials (less than −105 mV). The effect of Ba2+ on R in was four times stronger in the injured cells at both resting potential and at more hyperpolarized membrane potentials (less than −105 mV). Error bars indicate SEM. D, E, Ba2+ does not restore the LTS in the injured cells. Representative voltage responses from control (E) and injured nRT (D) cells to intracellular injections of negative square current pulses. The intensity of the current pulse is indicated below each voltage response. In control conditions, injured cells had a much lower R in compared with control cells (compare D, top trace, injured, with E, top trace, control), whereas after Ba2+ application R in was similar in control and injured cells (compare D, bottom trace, injured, with E, bottom trace, control). However, for the same level of hyperpolarization (−95 mV), the post-hyperpolarization rebound LTS observed in the control cells (E, arrow) was not observed in the injured cell (D, bottom trace).
We also calculated the R in at potentials more negative than −105 mV using the slope conductance (R in = 1/g m, where g m is the slope conductance) and found that, before Ba2+ application, membrane R in of nRT cells from injured animals was significantly lower (p < 0.05) compared with those from control animals (control, 331.6 ± 51.9 MΩ, n = 5 cells; injured, 241.97 ± 5.36 MΩ, n = 5 cells; p < 0.05) (Fig. 7 C, right). However, 1 mm Ba2+ application strongly reduced I–V slope in nRT cells from both control and injured animals (Fig. 7 A2,B2), corresponding to a 44% increase in R in in the control cells and, interestingly, to a much stronger increase (160%) in the injured cells (Fig. 7 C, right). Thus, after Ba2+ application, the membrane R in values in the hyperpolarized range for control and injured cells were similar (control, 478.3 ± 58.2 MΩ, n = 5 cells; injured, 629.1 ± 147.6 MΩ, n = 5 cells; p > 0.1) (Fig. 7 C, right).
Our results indicate that, after cortical injury, nRT neurons express higher Kir conductance compared with the controls at both resting potential (approximately −70 mV) as well as at hyperpolarized membrane potentials (less than −105 mV) and that I Kir contributes strongly to the leak. Because blocking I Kir restored the R in of the injured cells, it is likely that this current underlies the leak of nRT cells after injury.
Interestingly, Ba2+ did not restore the postinhibitory LTS, even though Ba2+ is a more effective charge carrier than Ca2+ in nRT T-channels (Huguenard and Prince, 1992), suggesting that the decrease or absence of LTS (Figs. 4 A–C, 5 A–D) and the hyperpolarized shift in the SSI curves of injured cells (Fig. 6 A3) are not attributable to the leak but rather a loss and/or a change in the T-type calcium channel subunit expression.
Evoked excitatory activity in nRT
Axon excitability and recruitment
To examine whether glutamatergic synaptic transmission was altered by cortical infarct, we stimulated cortical and thalamic afferents in the internal capsule (Fig. 8 A) and compared the evoked EPSC in nRT cells from control and injured animals. The intensity of stimulation required to induce an evoked EPSC at threshold (i.e., presumed activation of a single presynaptic fiber) (see Materials and Methods) in nRT cells was similar in control and injured rats (control, 27.1 ± 4.8 V, n = 13 cells; vs injured, 22.1 ± 2.7 V, n = 17 cells; p > 0.5), suggesting that the excitability of the remaining glutamatergic axons projecting to nRT was not altered by the cortical infarct. Moreover, input–output relationships for evoked EPSCs were not altered in injured cells (data not shown), suggesting that axonal recruitment was not altered by the cortical infarct.
Injury decreases the amplitude of the evoked EPSC
EPSCs were evoked in nRT neurons by stimulating the internal capsule (Fig. 8 A) to activate glutamatergic fibers of passage from cortex or dorsal thalamus projecting to nRT. The amplitude of the evoked EPSCs at threshold was significantly decreased in the injured nRT cells (78.9 ± 13.0 pA; n = 17 cells) compared with the controls (213.7 ± 63.5 pA; n = 13 cells; p < 0.0001) (Fig. 8 B1).
Injury slows decay of the evoked EPSC
The weighted decay time constant of internal capsule evoked EPSCs was increased by ∼85% in the injured nRT cells (2.4 ± 0.4 ms; n = 17) compared with the controls (1.3 ± 0.1 ms; n = 13 cells; p < 0.05) (Fig. 8 B2). Synaptic efficacy, as measured by area of the evoked EPSCs, showed no significant change with injury (control, 535 ± 199 fC, n = 13 cells; injured, 269 ± 63 fC, n = 17; p > 0.05). Thus, the overall total charge of the evoked EPSCs was similar in the injured and control nRT cells (p > 0.05), compensating for the decrease in amplitude. The 10–90% rise time of evoked EPSCs was not altered in the injured animals (control, 0.5 ± 0.1 ms, n = 13 cells; injured, 0.6 ± 0.1 ms, n = 17 cells; p > 0.4).
Injury decreases the paired-pulse ratio
Repetitive stimulation can elicit both paired-pulse facilitation (PPF) and paired-pulse depression. These phenomena can be described by the paired-pulse ratio (PPR), which is regarded as an index of presynaptic efficacy (Thomson et al., 1993; Markram and Tsodyks, 1996; Zucker and Regehr, 2002). We examined the PPR in nRT neurons of both control and injured animals at different interstimulus intervals to test the hypothesis that the glutamatergic synaptic efficacy in nRT may undergo an alteration after cortical infarct. In control cells, a PPF (PPR > 1) was observed in 83% of cells at 50 Hz, in 80% of cells at 100 Hz, and in 27% of cells at 200 Hz. However, after injury, a PPF was observed only in 50% of cells at 50 Hz, in 42% of cells at 100 Hz, and in 9% of cells at 200 Hz. The reduction in PPR in the injured cells was observed at all frequencies (50–200 Hz) (supplemental Fig. 1A, available at www.jneurosci.org as supplemental material; Fig. 8 C1–C3) but was significant only at 50 and 100 Hz (p < 0.05 at 50 and 100 Hz; p > 0.05 at 200 Hz) (supplemental Fig. 1D, available at www.jneurosci.org as supplemental material). However, even though the mean PPR was not significantly reduced at 200 Hz, its median value was lower in injured cells versus the controls (supplemental Fig. 1A, available at www.jneurosci.org as supplemental material).
Effects of cortical injury on amplitude of successive EPSCs evoked by stimulus trains
In addition to the PPR, synaptic efficacy can be measured by the time constant of decay of amplitudes of successively evoked EPSCs during a stimulus train. Synaptic responses elicited by trains of five stimuli (delivered in the internal capsule) (see Materials and Methods) at 1.5× threshold were measured in neurons from control and injured rats at stimulus frequencies of 50, 100, and 200 Hz (Fig. 8 C1; supplemental Fig. 1, available at www.jneurosci.org as supplemental material). During the train, there was a successive decline in amplitudes of successive EPSCs from the second evoked response within the train (Fig. 8 C1,C3; supplemental Fig. 1C, available at www.jneurosci.org as supplemental material). The decline in amplitude of successive EPSCs was measured, starting at the second evoked EPSC, by an exponential fit and was similar in control and injured cells for 50 Hz (control, 67.31 ± 5.93 ms, n = 6 cells; injured, 88.36 ± 80.28 ms, n = 10 cells; p > 0.05), 100 Hz (control, 17.04 ± 5.87 ms, n = 5 cells; injured, 23.76 ± 12.58 ms, n = 12 cells; p > 0.5), and 200 Hz stimulus trains (control, 5.88 ± 5.15 ms, n = 10 cells; injured, 6.35 ± 3.35 ms, n = 12 cells; p > 0.5). Furthermore, the train–pulse ratio, defined as the ratio between the fifth evoked EPSC by the first, was significantly lower at 50 Hz in the injured cells, but was not significantly different from the control at 100 or 200 Hz stimulation trains (supplemental Fig. 1B,D, available at www.jneurosci.org as supplemental material).
Effects of cortical infarct on the excitatory synaptic potentials evoked by 200 Hz stimulus trains
We next examined the membrane potential correlate of the evoked EPSCs. Thalamic relay neurons are capable firing high-frequency bursts of action potentials in vitro (Huguenard and Prince, 1994; Bal et al., 1995) and in vivo during normal spindle-wave activity and epileptic spike-and-wave discharges (Pinault, 2003; Steriade, 2005; Paz et al., 2007). Relay neuron bursts are characterized by frequencies of ∼200 Hz, which induce high-frequency bursts of EPSPs in the target nRT neurons (Bal et al., 1995). To examine whether this integrative property of nRT cells was altered after injury, we studied the excitatory postsynaptic response evoked by internal capsule stimulation with 200 Hz trains of five stimuli at 1.5× threshold intensity (see above). Activation of cortical/thalamic afferents to nRT neurons from control animals resulted in a short-latency burst of action potentials (Fig. 8 D, left). The number of elicited action potentials depended on the membrane potential of the cell. At depolarized membrane potentials, few action potentials were evoked, whereas at more hyperpolarized levels at which the T-current is de-inactivated (Steriade et al., 1990), the same stimulation induced a LTS (Fig. 8 D, arrow) crowned by a burst of Na+ action potentials. However, in the injured rats, the same stimulation protocol (i.e., 1.5× threshold stimulus train at 200 Hz) elicited fewer action potentials at depolarized membrane potentials (Fig. 8 D, top, compare right, left panels) and neither LTS nor action potential firing were observed at more hyperpolarized levels of membrane potential (Fig. 8 D, bottom, compare right, left panels).
Spontaneous synaptic activity in nRT
To determine whether the cortical infarct affected the synaptic activity of nRT GABAergic neurons, we examined spontaneous EPSCs (sEPSCs) and spontaneous IPSCs (sIPSCs) in cells from injured and control animals.
Spontaneous EPSCs
Surprisingly, despite a massive loss of cortical and thalamic glutamatergic afferents to nRT (Figs. 1, 2) and reductions in evoked EPSC (Fig. 8 B1), the mean frequency of the spontaneous EPSCs was not reduced in nRT neurons of injured animals (2.4 ± 1.9 Hz; n = 16 cells) compared with the controls (2.3 ± 1.4 Hz; n = 20 cells; p > 0.5, control vs injured cells) (Fig. 9 A1, representative traces). We next examined whether the kinetics of the isolated spontaneous EPSCs events was altered after injury (Fig. 9 A2,A3). Based on the analysis of 1900 sEPSCs from 20 control cells and 1600 sEPSCs from 16 injured nRT cells, none of the following parameters were found to be affected by the injury: amplitude (control, 19.7 ± 0.8 pA; injured, 22.4 ± 0.8 pA; p > 0.05), charge (control, 25.7 ± 2.0 fC; injured, 26.6 ± 2.0 fC; p > 0.5), half-width (control, 0.84 ± 0.05 ms; injured, 0.78 ± 0.07 ms; p > 0.1), 10–90% rise time (control, 0.21 ± 0.01 ms; injured, 0.20 ± 0.01 ms; p > 0.1), and decay time constant (control, 0.81 ± 0.05 ms; injured, 0.72 ± 0.08 ms; p > 0.1).
Spontaneous IPSCs
Similarly, mean IPSC frequency was not different in nRT neurons from injured animals (0.78 ± 0.09 Hz; n = 19 cells) compared with controls (0.99 ± 0.18 Hz; n = 28 cells; p > 0.3) (Fig. 9 B1, representative traces). IPSC kinetics was also unaffected; no significant differences were found in amplitude (control, 16.79 ± 0.77 pA; injured, 16.16 ± 1.05 pA; p > 0.6), 10–90% rise time (control, 2.30 ± 0.02 ms; injured, 2.39 ± 0.05 ms; p > 0.08), half-width (control, 74.8 ± 3.99 ms; injured, 82.40 ± 5.92 ms; p > 0.27), or decay time constant (control, 77.34 ± 2.94 ms; injured, 83.03 ± 4.11 ms; p > 0.25) (Fig. 9 B2,B3). In addition, there were no significant differences in evoked IPSC amplitude (control, 238.77 ± 54.0 pA; injured, 266.11 ± 73.27 pA; p > 0.7) or weighted decay time constant (control, 160.59 ± 21.48 ms; injured, 158.19 ± 20.61 ms; p > 0.4; control, n = 12 cells; injured, n = 7 cells) (Fig. 9 B4).
Discussion
The present study provides the first complete description of intrinsic and synaptic plasticity in nRT after focal cortical strokes and demonstrates how, despite compensatory changes in synaptic excitation, altered intrinsic properties result in a reduced responsiveness of nRT that persists during epileptogenesis. Briefly, in the rat photothrombosis model of stroke (Watson et al., 1985; Kharlamov et al., 2003), we showed that a local infarct in the somatosensory cortex induces (1) cell death and gliosis specifically in VPL by the end of the first week; (2) morphological changes in nRT cells ipsilateral to the infarct and, in particular, a decrease in the number and proportion of large versus small boutons on axons from nRT cells within the affected (VPL) and nonaffected (VPM) thalamic relay nuclei; (3) decreased intrinsic excitability of nRT cells because of an increased Kir conductance; (4) reduced postinhibitory rebound of excitation and a reduced ability to fire bursts of action potentials; (5) decreased expression of Cav3.3 T-type channels; (6) decreased amplitude and decay time of T-currents; (7) hyperpolarized shift in the steady-state inactivation of T-currents; (8) no change in the spontaneous synaptic excitatory and inhibitory activity; and (9) decreased paired-pulse ratio and altered synaptic efficacy. These results indicate that cortical thrombosis decreases the intrinsic excitability and reduces evoked synaptic excitatory currents in nRT neurons, which together might produce a powerful decrease in inhibitory drive onto thalamocortical relay cells and an overall increase in thalamocortical activity.
Origin of the decreased intrinsic excitability
One of the main findings of this study is the decreased intrinsic excitability of nRT cells after a cortical infarct. Specifically, the 30% decrease in membrane R in and τm were complete by the end of the first week after the cortical infarct. We showed that the leak resulted from an increased Kir conductance after injury. Indeed, in presence of Ba2+, which blocks I Kir without affecting I h (Pape, 1996), R in of injured and control nRT cells were similar. In both control and injured cells, I Kir-induced leak was higher at hyperpolarized membrane potentials (less than −105 mV) compared with the resting potential (approximately −70 mV). This result was expected because I Kir is normally expressed by nRT neurons and underlies ∼50% of leak less than −100 mV (Rateau and Ropert, 2006). Interestingly, in injured nRT cells compared with controls, Kir conductance was increased by the same factor at less than −105 mV and at approximately −70 mV, suggesting that this conductance will shunt synaptic depolarizations at the resting membrane potential. The mechanisms leading to increased I Kir in nRT neurons remain unknown. However, upregulation of Kir2 channels has been reported in dentate gyrus granule cells in temporal lobe epilepsy (Young et al., 2009) and was suggested to be a local adaptive mechanism that could counterbalance hyperexcitability in epileptic hippocampus.
Implication of loss of Cav3.3 channels on thalamocortical oscillations
The second key finding is the loss or reduction of LTS and the decreased amplitude and decay kinetics of T-currents after cortical infarct. Blockade of the leak channels was not able to restore the LTS, suggesting that its loss or decrease was not attributable to the leak, but rather to loss of T-type calcium channels. In thalamus, differences in distribution and kinetic properties of T-currents influence the nature of oscillatory output involved in both the normal sleep-wave cycle and the abnormal spike-and-wave discharges of absence epileptic seizures (Huguenard et al., 1993; Pape et al., 2004; Joksovic et al., 2006). Molecular analyses have identified three isoforms of T-type channels (Cav3.1, Cav3.2, Cav3.3) (Lee et al., 1999; McRory et al., 2001; Perez-Reyes, 2003) all expressed in nRT neurons (McKay et al., 2006). Cav3.3 channels are (1) expressed in nRT somata and dendrites (McKay et al., 2006), (2) have slower inactivation kinetics compared with the other two isoforms (Lee et al., 1999), and (3) have the most depolarized half-inactivation voltage. Therefore, we tested the hypothesis that this isoform was lost in nRT after injury, leading to reduced T-current amplitudes, faster decay kinetics, and hyperpolarized half-inactivation voltages. Indeed, the cortical infarct led to a strong reduction in the expression of Cav3.3 in ipsilateral nRT neurons, especially those adjacent to VPL, which is damaged by cell loss and gliosis. Cav3.3 loss was less prominent in nRT cells located >300 μm from the lesion, explaining why LTS was less affected (but still abnormal) in those cells. Because the hyperpolarized shift in half-inactivation voltages of T-currents in the injured nRT cells was also observed after blockade of leak channels, it is unlikely that it resulted from the increased leakiness.
Our results suggest that the decreased T-current amplitude and decay kinetics, as well as its hyperpolarized steady-state inactivation are attributable to a loss of Cav3.3 isoform in nRT ipsilateral to the infarct. Thus, Cav3.3 loss, together with the increased Kir leak-conductance, is likely to affect the nature of oscillatory output of nRT onto surviving relay thalamocortical cells and alter sensory processing.
Implication of morphological changes in nRT on its output onto relay nuclei
Cortical infarcts led to cell death in VPL, which could alter thalamic sensory information processing (Tokuno et al., 1992; Sela et al., 2009) and to long-lasting (≥2 months) morphological changes in the ipsilateral nRT. Specifically, the dendritic length of partially deafferented nRT cells was decreased, and somata lost their characteristic fusiform shape. These changes are likely attributable, at least in part, to the loss of NF, an important component of cytoskeleton whose decreased expression in thalamus has been reported in various neurological disorders (Lee and Cleveland, 1994; Clinton and Meador-Woodruff, 2004; Clinton et al., 2004). Interestingly, there was a dramatic decrease in the number of boutons on axons emanating from nRT cells within both the damaged thalamic relay nucleus (VPL) and less affected areas of thalamus (e.g., VPM). This result suggests that the cortical infarct affects not only inhibition from nRT in the functionally related damaged thalamus but also in other thalamic relay nuclei, thus resulting in a widespread effect on thalamocortical network excitability. Interestingly, intra-nRT axons did not seem affected (data not shown), which is in agreement with the finding that intra-nRT synaptic inhibition was not altered by the cortical infarct.
Poststroke synaptic plasticity in nRT
Because axon excitability was unchanged, the smaller amplitude of the EPSCs evoked by threshold stimulation, presumably activating a single presynaptic axon, could result from a reduced number of release sites per axon. However, the reduced amplitude of evoked EPSCs was associated with slower decay kinetics, thus maintaining the total charge of the response and suggesting postsynaptic compensation. If slowly decaying evoked EPSCs resulted from a change in specific AMPA GluR subunit composition (Dingledine et al., 1999; Schlesinger et al., 2005), one would expect to observe longer decay in spontaneous EPSCs. One possible explanation for this discrepancy would be activation of different receptors during spontaneous and evoked EPSCs. For example, injury might alter expression of extrasynaptic receptors or glutamate transporters.
Despite a massive loss of glutamatergic afferents to nRT, the mean frequency of spontaneous EPSCs was not reduced in nRT neurons, suggesting compensatory activity in the remaining corticothalamic and thalamocortical fibers. Furthermore, PPR, which is regarded as an index of presynaptic efficacy (Thomson et al., 1993; Markram and Tsodyks, 1996; Zucker and Regehr, 2002), was decreased during 50–200 Hz stimulus trains, suggesting an increased probability of release after injury. This could explain, at least in part, why the frequency of spontaneous EPSCs in nRT cells was not decreased after injury. In addition to PPR, synaptic efficacy can be measured by the time constant of decay of amplitudes of successively evoked EPSCs, and by the train–pulse ratio, which were not altered significantly at 100–200 Hz, suggesting a strong compensation of synaptic efficacy after injury. Thus, the decreased evoked firing of action potentials in nRT cells after injury is unlikely to result from a decreased synaptic efficacy, but rather from a decreased intrinsic excitability because of loss of T-channels and increased Kir conductance preventing an efficient summation of EPSPs and a sufficient depolarization to elicit a LTS.
Together, the results suggest that partially deafferented nRT cells are less likely to be excited and inhibit surviving thalamocortical cells, possibly leading to enhanced thalamocortical activity.
Pathophysiology
The critical finding of this study is the decreased intrinsic excitability of nRT cells as well as the loss of Cav3.3 channels leading to reduced ability to fire bursts of action potentials. The results demonstrate how, despite unchanged intra-nRT synaptic inhibition and compensatory alterations in excitatory synaptic activity, the change in intrinsic properties affects synaptic integration in nRT and most likely alters its widespread output onto relay nuclei. Future studies will be required to determine the extent to which such changes are dependent on the developmental stage of the animal. The injured thalamus may not initiate seizures (Williams, 1965), but the infarct, via its long-term effect on nRT, could affect the control of thalamocortical output and enhance the intensity of positive excitatory feedback to cortex, which might participate in poststroke development and spread of epileptiform activity.
Footnotes
This work was supported by National Institutes of Health Grants NS06477 and NS007280. We thank Karina Scalise, Astra S. Bryant, and Whitney McDonald for assistance with animal husbandry.
References
- Abbas SY, Ying SW, Goldstein PA. Compartmental distribution of hyperpolarization-activated cyclic-nucleotide-gated channel 2 and hyperpolarization-activated cyclic-nucleotide-gated channel 4 in thalamic reticular and thalamocortical relay neurons. Neuroscience. 2006;141:1811–1825. doi: 10.1016/j.neuroscience.2006.05.034. [DOI] [PubMed] [Google Scholar]
- Agarwala S, Kalil RE. Axotomy-induced neuronal death and reactive astrogliosis in the lateral geniculate nucleus following a lesion of the visual cortex in the rat. J Comp Neurol. 1998;392:252–263. doi: 10.1002/(sici)1096-9861(19980309)392:2<252::aid-cne7>3.0.co;2-1. [DOI] [PubMed] [Google Scholar]
- Avanzini G, de Curtis M, Panzica F, Spreafico R. Intrinsic properties of nucleus reticularis thalami neurones of the rat studied in vitro . J Physiol. 1989;416:111–122. doi: 10.1113/jphysiol.1989.sp017752. [DOI] [PMC free article] [PubMed] [Google Scholar]
- Bal T, McCormick DA. Mechanisms of oscillatory activity in guinea-pig nucleus reticularis thalami in vitro: a mammalian pacemaker. J Physiol. 1993;468:669–691. doi: 10.1113/jphysiol.1993.sp019794. [DOI] [PMC free article] [PubMed] [Google Scholar]
- Bal T, von Krosigk M, McCormick DA. Role of the ferret perigeniculate nucleus in the generation of synchronized oscillations in vitro. J Physiol. 1995;483:665–685. doi: 10.1113/jphysiol.1995.sp020613. [DOI] [PMC free article] [PubMed] [Google Scholar]
- Bichet D, Haass FA, Jan LY. Merging functional studies with structures of inward-rectifier K+ channels. Nat Rev Neurosci. 2003;4:957–967. doi: 10.1038/nrn1244. [DOI] [PubMed] [Google Scholar]
- Clinton SM, Meador-Woodruff JH. Abnormalities of the NMDA receptor and associated intracellular molecules in the thalamus in schizophrenia and bipolar disorder. Neuropsychopharmacology. 2004;29:1353–1362. doi: 10.1038/sj.npp.1300451. [DOI] [PubMed] [Google Scholar]
- Clinton SM, Abelson S, Haroutunian V, Davis K, Meador-Woodruff JH. Neurofilament subunit protein abnormalities in the thalamus in schizophrenia. Thalamus Relat Syst. 2004;2:265–272. [Google Scholar]
- Contreras D, Curró Dossi R, Steriade M. Electrophysiological properties of cat reticular thalamic neurones in vivo . J Physiol. 1993;470:273–294. doi: 10.1113/jphysiol.1993.sp019858. [DOI] [PMC free article] [PubMed] [Google Scholar]
- Crabtree JW, Collingridge GL, Isaac JT. A new intrathalamic pathway linking modality-related nuclei in the dorsal thalamus. Nat Neurosci. 1998;1:389–394. doi: 10.1038/1603. [DOI] [PubMed] [Google Scholar]
- Deleuze C, Huguenard JR. Distinct electrical and chemical connectivity maps in the thalamic reticular nucleus: potential roles in synchronization and sensation. J Neurosci. 2006;26:8633–8645. doi: 10.1523/JNEUROSCI.2333-06.2006. [DOI] [PMC free article] [PubMed] [Google Scholar]
- Dietrich WD, Watson BD, Busto R, Ginsberg MD, Bethea JR. Photochemically induced cerebral infarction. 1. Early microvascular alterations. Acta Neurol (Berl) 1987;72:315–325. doi: 10.1007/BF00687262. [DOI] [PubMed] [Google Scholar]
- Dingledine R, Borges K, Bowie D, Traynelis SF. The glutamate receptor ion channels. Pharmacol Rev. 1999;51:7–61. [PubMed] [Google Scholar]
- Hagiwara S, Miyazaki S, Moody W, Patlak J. Blocking effects of barium and hydrogen ions on the potassium current during anomalous rectification in the starfish egg. J Physiol. 1978;279:167–185. doi: 10.1113/jphysiol.1978.sp012338. [DOI] [PMC free article] [PubMed] [Google Scholar]
- Horikawa K, Armstrong WE. A versatile means of intracellular labeling: injection of biocytin and its detection with avidin conjugates. J Neurosci Methods. 1988;25:1–11. doi: 10.1016/0165-0270(88)90114-8. [DOI] [PubMed] [Google Scholar]
- Huguenard JR, Prince DA. A novel T-type current underlies prolonged Ca2+-dependent burst firing in GABAergic neurons of rat thalamic reticular nucleus. J Neurosci. 1992;12:3804–3817. doi: 10.1523/JNEUROSCI.12-10-03804.1992. [DOI] [PMC free article] [PubMed] [Google Scholar]
- Huguenard JR, Prince DA. Intrathalamic rhythmicity studied in vitro: nominal T-current modulation causes robust antioscillatory effects. J Neurosci. 1994;14:5485–5502. doi: 10.1523/JNEUROSCI.14-09-05485.1994. [DOI] [PMC free article] [PubMed] [Google Scholar]
- Huguenard JR, Prince DA. Basic mechanisms of epileptic discharges in the thalamus. In: Steriade M, Jones EG, McCormick DA, editors. The thalamus, Vol 2, Experimental and clinical aspects. New York: Oxford UP; 1997. pp. 295–230. [Google Scholar]
- Huguenard JR, Gutnick MJ, Prince DA. Transient Ca2+ currents in neurons isolated from rat lateral habenula. J Neurophysiol. 1993;70:158–166. doi: 10.1152/jn.1993.70.1.158. [DOI] [PubMed] [Google Scholar]
- Huntsman MM, Porcello DM, Homanics GE, DeLorey TM, Huguenard JR. Reciprocal inhibitory connections and network synchrony in the mammalian thalamus. Science. 1999;283:541–543. doi: 10.1126/science.283.5401.541. [DOI] [PubMed] [Google Scholar]
- Iizuka H, Sakatani K, Young W. Neural damage in the rat thalamus after cortical infarcts. Stroke. 1990;21:790–794. doi: 10.1161/01.str.21.5.790. [DOI] [PubMed] [Google Scholar]
- Joksovic PM, Nelson MT, Jevtovic-Todorovic V, Patel MK, Perez-Reyes E, Campbell KP, Chen CC, Todorovic SM. CaV3.2 is the major molecular substrate for redox regulation of T-type Ca2+ channels in the rat and mouse thalamus. J Physiol. 2006;574:415–430. doi: 10.1113/jphysiol.2006.110395. [DOI] [PMC free article] [PubMed] [Google Scholar]
- Jones EG. The thalamus. New York: Plenum; 1985. [Google Scholar]
- Kelly KM, Kharlamov A, Hentosz TM, Kharlamova EA, Williamson JM, Bertram EH, 3rd, Kapur J, Armstrong DM. Photothrombotic brain infarction results in seizure activity in aging Fischer 344 and Sprague Dawley rats. Epilepsy Res. 2001;47:189–203. doi: 10.1016/s0920-1211(01)00294-7. [DOI] [PubMed] [Google Scholar]
- Kharlamov A, Zivkovic I, Polo A, Armstrong DM, Costa E, Guidotti A. LIGA20, a lyso derivative of ganglioside GM1, given orally after cortical thrombosis reduces infarct size and associated cognition deficit. Proc Natl Acad Sci U S A. 1994;91:6303–6307. doi: 10.1073/pnas.91.14.6303. [DOI] [PMC free article] [PubMed] [Google Scholar]
- Kharlamov A, Uz T, Joo JY, Manev H. Pharmacological characterization of apoptotic cell death in a model of photothrombotic brain injury in rats. Brain Res. 1996;734:1–9. [PubMed] [Google Scholar]
- Kharlamov EA, Jukkola PI, Schmitt KL, Kelly KM. Electrobehavioral characteristics of epileptic rats following photothrombotic brain infarction. Epilepsy Res. 2003;56:185–203. doi: 10.1016/j.eplepsyres.2003.09.005. [DOI] [PubMed] [Google Scholar]
- Lee JH, Daud AN, Cribbs LL, Lacerda AE, Pereverzev A, Klöckner U, Schneider T, Perez-Reyes E. Cloning and expression of a novel member of the low voltage-activated T-type calcium channel family. J Neurosci. 1999;19:1912–1921. doi: 10.1523/JNEUROSCI.19-06-01912.1999. [DOI] [PMC free article] [PubMed] [Google Scholar]
- Lee MK, Cleveland DW. Neurofilament function and dysfunction: involvement in axonal growth and neuronal disease. Curr Opin Cell Biol. 1994;6:34–40. doi: 10.1016/0955-0674(94)90113-9. [DOI] [PubMed] [Google Scholar]
- Llinás R, Jahnsen H. Electrophysiology of mammalian thalamic neurones in vitro . Nature. 1982;297:406–408. doi: 10.1038/297406a0. [DOI] [PubMed] [Google Scholar]
- Majak K, Berdel B, Kowiański P, Dziewiatkowski J, Lipowska M, Moryś J. Parvalbumin immunoreactivity changes in the thalamic reticular nucleus during the maturation of the rat's brain. Folia Neuropathol. 1998;36:7–14. [PubMed] [Google Scholar]
- Markram H, Tsodyks M. Redistribution of synaptic efficacy between neocortical pyramidal neurons. Nature. 1996;382:807–810. doi: 10.1038/382807a0. [DOI] [PubMed] [Google Scholar]
- Matthews MA. Death of the central neuron: an electron microscopic study of thalamic retrograde degeneration following cortical ablation. J Neurocytol. 1973;2:265–288. doi: 10.1007/BF01104030. [DOI] [PubMed] [Google Scholar]
- McKay BE, McRory JE, Molineux ML, Hamid J, Snutch TP, Zamponi GW, Turner RW. CaV3 T-type calcium channel isoforms differentially distribute to somatic and dendritic compartments in rat central neurons. Eur J Neurosci. 2006;24:2581–2594. doi: 10.1111/j.1460-9568.2006.05136.x. [DOI] [PubMed] [Google Scholar]
- McRory JE, Santi CM, Hamming KS, Mezeyova J, Sutton KG, Baillie DL, Stea A, Snutch TP. Molecular and functional characterization of a family of rat brain T-type calcium channels. J Biol Chem. 2001;276:3999–4011. doi: 10.1074/jbc.M008215200. Erratum (2001) 276:30571–30574. [DOI] [PubMed] [Google Scholar]
- Mulle C, Madariaga A, Deschênes M. Morphology and electrophysiological properties of reticularis thalami neurons in cat: in vivo study of a thalamic pacemaker. J Neurosci. 1986;6:2134–2145. doi: 10.1523/JNEUROSCI.06-08-02134.1986. [DOI] [PMC free article] [PubMed] [Google Scholar]
- Murbartián J, Arias JM, Lee JH, Gomora JC, Perez-Reyes E. Alternative splicing of the rat Cav3.3 T-type calcium channel gene produces variants with distinct functional properties. FEBS Lett. 2002;528:272–278. doi: 10.1016/s0014-5793(02)03341-0. [DOI] [PubMed] [Google Scholar]
- Pape HC. Queer current and pacemaker: the hyperpolarization-activated cation current in neurons. Annu Rev Physiol. 1996;58:299–327. doi: 10.1146/annurev.ph.58.030196.001503. [DOI] [PubMed] [Google Scholar]
- Pape HC, Munsch T, Budde T. Novel vistas of calcium-mediated signalling in the thalamus. Pflugers Arch. 2004;448:131–138. doi: 10.1007/s00424-003-1234-5. [DOI] [PubMed] [Google Scholar]
- Paxinos G, Watson C. The rat brain in stereotaxic coordinates. Ed 2. London: Academic; 1986. [DOI] [PubMed] [Google Scholar]
- Paz JT, Chavez M, Saillet S, Deniau JM, Charpier S. Activity of ventral medial thalamic neurons during absence seizures and modulation of cortical paroxysms by the nigrothalamic pathway. J Neurosci. 2007;27:929–941. doi: 10.1523/JNEUROSCI.4677-06.2007. [DOI] [PMC free article] [PubMed] [Google Scholar]
- Peacock JH, Combs CM. Retrograde cell degeneration in adult cat after hemidecortication. J Comp Neurol. 1965;125:329–336. doi: 10.1002/cne.901250304. [DOI] [PubMed] [Google Scholar]
- Perez-Reyes E. Molecular physiology of low-voltage-activated T-type calcium channels. Physiol Rev. 2003;83:117–161. doi: 10.1152/physrev.00018.2002. [DOI] [PubMed] [Google Scholar]
- Pinault D. Cellular interactions in the rat somatosensory thalamocortical system during normal and epileptic 5–9 Hz oscillations. J Physiol. 2003;552:881–905. doi: 10.1113/jphysiol.2003.046573. [DOI] [PMC free article] [PubMed] [Google Scholar]
- Porcello DM, Smith SD, Huguenard JR. Actions of U-92032, a T-type Ca2+ channel antagonist, support a functional linkage between I T and slow intrathalamic rhythms. J Neurophysiol. 2003;89:177–185. doi: 10.1152/jn.00667.2002. [DOI] [PubMed] [Google Scholar]
- Rasband WS. ImageJ. Bethesda, MD: National Institutes of Health; 2006. [Google Scholar]
- Rateau Y, Ropert N. Expression of a functional hyperpolarization-activated current I h in the mouse nucleus reticularis thalami. J Neurophysiol. 2006;95:3073–3085. doi: 10.1152/jn.00922.2005. [DOI] [PubMed] [Google Scholar]
- Redecker C, Wang W, Fritschy JM, Witte OW. Widespread and long-lasting alterations in GABAA-receptor subtypes after focal cortical infarcts in rats: mediation by NMDA-dependent processes. J Cereb Blood Flow Metab. 2002;22:1463–1475. doi: 10.1097/01.WCB.0000034149.72481.BD. [DOI] [PubMed] [Google Scholar]
- Ross DT, Ebner FF. Thalamic retrograde degeneration following cortical injury: an excitotoxic process? Neuroscience. 1990;35:525–550. doi: 10.1016/0306-4522(90)90327-z. [DOI] [PubMed] [Google Scholar]
- Santoro B, Chen S, Luthi A, Pavlidis P, Shumyatsky GP, Tibbs GR, Siegelbaum SA. Molecular and functional heterogeneity of hyperpolarization-activated pacemaker channels in the mouse CNS. J Neurosci. 2000;20:5264–5275. doi: 10.1523/JNEUROSCI.20-14-05264.2000. [DOI] [PMC free article] [PubMed] [Google Scholar]
- Schiene K, Bruehl C, Zilles K, Qü M, Hagemann G, Kraemer M, Witte OW. Neuronal hyperexcitability and reduction of GABAA-receptor expression in the surround of cerebral photothrombosis. J Cereb Blood Flow Metab. 1996;16:906–914. doi: 10.1097/00004647-199609000-00014. [DOI] [PubMed] [Google Scholar]
- Schlesinger F, Tammena D, Krampfl K, Bufler J. Desensitization and resensitization are independently regulated in human recombinant GluR subunit coassemblies. Synapse. 2005;55:176–182. doi: 10.1002/syn.20110. [DOI] [PubMed] [Google Scholar]
- Schmidt-Kastner R, Wietasch K, Weigel H, Eysel UT. Immunohistochemical staining for glial fibrillary acidic protein (GFAP) after deafferentation or ischemic infarction in rat visual system: features of reactive and damaged astrocytes. Int J Dev Neurosci. 1993;11:157–174. doi: 10.1016/0736-5748(93)90076-p. [DOI] [PubMed] [Google Scholar]
- Sela L, Sacher Y, Serfaty C, Yeshurun Y, Soroker N, Sobel N. Spared and impaired olfactory abilities after thalamic lesions. J Neurosci. 2009;29:12059–12069. doi: 10.1523/JNEUROSCI.2114-09.2009. [DOI] [PMC free article] [PubMed] [Google Scholar]
- Sholl DA. Dendritic organization in the neurons of the visual and motor cortices of the cat. J Anat. 1953;87:387–406. [PMC free article] [PubMed] [Google Scholar]
- Slaght SJ, Leresche N, Deniau JM, Crunelli V, Charpier S. Activity of thalamic reticular neurons during spontaneous genetically determined spike and wave discharges. J Neurosci. 2002;22:2323–2334. doi: 10.1523/JNEUROSCI.22-06-02323.2002. [DOI] [PMC free article] [PubMed] [Google Scholar]
- So EL, Annegers JF, Hauser WA, O'Brien PC, Whisnant JP. Population-based study of seizure disorders after cerebral infarction. Neurology. 1996;46:350–355. doi: 10.1212/wnl.46.2.350. [DOI] [PubMed] [Google Scholar]
- Sørensen JC, Dalmau I, Zimmer J, Finsen B. Microglial reactions to retrograde degeneration of tracer-identified thalamic neurons after frontal sensorimotor cortex lesions in adult rats. Exp Brain Res. 1996;112:203–212. doi: 10.1007/BF00227639. [DOI] [PubMed] [Google Scholar]
- Spreafico R, de Curtis M, Frassoni C, Avanzini G. Electrophysiological characteristics of morphologically identified reticular thalamic neurons from rat slices. Neuroscience. 1988;27:629–638. doi: 10.1016/0306-4522(88)90294-1. [DOI] [PubMed] [Google Scholar]
- Steriade M. Sleep, epilepsy and thalamic reticular inhibitory neurons. Trends Neurosci. 2005;28:317–324. doi: 10.1016/j.tins.2005.03.007. [DOI] [PubMed] [Google Scholar]
- Steriade M, Jones EG, Llinás RR. Intrinsic properties and ionic conductances of thalamic cells. In: Steriade M, Jones EG, Llinás RR, editors. Thalamic oscillations and signaling. New York: Wiley Interscience; 1990. pp. 115–125. [Google Scholar]
- Thomson AM, Deuchars J, West DC. Large, deep layer pyramidpyramid single axon EPSPs in slices of rat motor cortex display paired pulse and frequency-dependent depression, mediated presynaptically and selffacilitation, mediated postsynaptically. J Neurophysiol. 1993;70:2354–2369. doi: 10.1152/jn.1993.70.6.2354. [DOI] [PubMed] [Google Scholar]
- Tokuno T, Kataoka K, Asai T, Chichibu S, Kuroda R, Ioku M, Yamada K, Hayakawa T. Functional changes in thalamic relay neurons after focal cerebral infarct: a study of unit recordings from VPL neurons after MCA occlusion in rats. J Cereb Blood Flow Metab. 1992;12:954–961. doi: 10.1038/jcbfm.1992.132. [DOI] [PubMed] [Google Scholar]
- Tseng GF, Parada I, Prince DA. Double-labelling with rhodamine beads and biocytin: a technique for studying corticospinal and other projection neurons in vitro. J Neurosci Methods. 1991;37:121–131. doi: 10.1016/0165-0270(91)90122-g. [DOI] [PubMed] [Google Scholar]
- Warren RA, Jones EG. Maturation of neuronal form and function in a mouse thalamo-cortical circuit. J Neurosci. 1997;17:277–295. doi: 10.1523/JNEUROSCI.17-01-00277.1997. [DOI] [PMC free article] [PubMed] [Google Scholar]
- Watson BD, Dietrich WD, Busto R, Wachtel MS, Ginsberg MD. Induction of reproducible brain infarction by photochemically initiated thrombosis. Ann Neurol. 1985;17:497–504. doi: 10.1002/ana.410170513. [DOI] [PubMed] [Google Scholar]
- Williams D. The thalamus and epilepsy. Brain. 1965;88:539–556. doi: 10.1093/brain/88.3.539. [DOI] [PubMed] [Google Scholar]
- Young CC, Stegen M, Bernard R, Müller M, Bischofberger J, Veh RW, Haas CA, Wolfart J. Upregulation of inward rectifier K+ (Kir2) channels in dentate gyrus granule cells in temporal lobe epilepsy. J Physiol. 2009;587:4213–4233. doi: 10.1113/jphysiol.2009.170746. [DOI] [PMC free article] [PubMed] [Google Scholar]
- Zucker RS, Regehr WG. Short-term synaptic plasticity. Annu Rev Physiol. 2002;64:355–405. doi: 10.1146/annurev.physiol.64.092501.114547. [DOI] [PubMed] [Google Scholar]