

Abstract
Saccular intracranial aneurysms (IAs) are balloon-like dilations of the intracranial arterial wall; their hemorrhage commonly results in severe neurologic impairment and death. We report a second genome-wide association study with discovery and replication cohorts from Europe and Japan comprising 5,891 cases and 14,181 controls with ∼832,000 genotyped and imputed SNPs across discovery cohorts. We identified three new loci showing strong evidence for association with IA in the combined data set, including intervals near RBBP8 on 18q11.2 (OR=1.22, P=1.1×10⁻¹²), STARD13/KL on 13q13.1 (OR=1.20, P=2.5×10⁻⁹) and a gene-rich region on 10q24.32 (OR=1.29, P=1.2×10⁻⁹). We also confirmed prior associations near SOX17 (8q11.23-q12.1; OR=1.28, P=1.3×10⁻¹²) and CDKN2A/B (9p21.3; OR=1.31, P=1.5×10⁻²²). It is noteworthy that several putative risk genes play a role in cell-cycle progression, potentially affecting proliferation and senescence of progenitor cell populations that are responsible for vascular formation and repair.
IA affects approximately 2% of the general population and arises from the action of multiple genetic and environmental risk factors1. We previously reported the first genome-wide association study (GWAS) of IA2 that identified three IA risk loci on chromosomes 8q11.23-q12.1, 9p21.3 and 2q33.1 with P < 5×10⁻⁸. This previous study had limited power to detect loci imparting genotypic relative risk (GRR) < 1.35 (Supplementary Table 1).
To increase the power to detect additional loci of similar or smaller effect, we ascertained and whole-genome genotyped 2 new European case cohorts (n = 1,616) and collected genotyping data from 5 additional European control cohorts (Supplementary Note, n = 11,955). We also increased the size of the original Japanese replication cohort and added a new Japanese replication cohort (2,282 cases and 905 controls) (Table 1). The new combined cohort has nearly 3-fold more cases than the original cohort and increased our power to detect variants with modest effect sizes. For example, this study had 89% and 64% average power to detect common variants (minor allele frequencies ≥ 10%) with GRR of 1.25 and 1.20, respectively (Supplementary Table 1).
Table 1.
Overview of the study cohorts
| Cohort | Case (n) | Control (n) | Number of QC-passed SNPs | Genomic inflation factor | |
|---|---|---|---|---|---|
| Discovery | Finland (FI) | 808 | 4,393 | 1,303,876 | 1.07 |
| Combined European (CE) | 1,972 | 8,122 | 905,906 | 1.09 | |
| Total discovery | 2,780 | 12,515 | 831,532 | 1.007 | |
| CE sub-cohorts | NL | 708 | 3,954 | 905,906 | 1.11 |
| DE | 789 | 2,228 | 905,906 | 1.06 | |
| AN | 475 | 1,940 | 905,906 | 1.06 | |
| Replication | Japan 1 (JP1) | 829 | 761 | 12 | |
| Japan 2 (JP2) | 2,282 | 905 | 13 | ||
| Total replication | 3,111 | 1,666 | 12 | ||
| Total | 5,891 | 14,181 | 12 |
Combined European (CE) cohort consisted of all European subjects who were not ascertained in Finland. Sub-cohorts of CE were defined on the basis of case series: NL = Cases from the Netherlands with matched controls; DE = German cases with matched controls; AN = @neurIST cases with matched controls. NL, DE and AN were exclusive subsets of CE (see also Supplementary Table 3). AN cases consisted of subjects from Germany, Great Britain, Hungary, the Netherlands, Switzerland and Spain. JP1 and JP2 were 2 independent Japanese case-control cohorts. Genomic inflation factors of FI and CE (as well as NL, DE and AN) were calculated for 1,303,876 and 905,906 SNPs, respectively. The genomic inflation factor of the discovery cohort (“Total discovery” row) was based on the meta-analysis result for 831,532 SNPs after correcting each cohort for genomic control. The discovery data (combined FI and CE) was not corrected for genomic control.
All subjects were genotyped using the Illumina platform. The new as well as the previously analyzed genotyping data were subjected to well-established quality control (QC) measures (Supplementary Table 2). We sought to eliminate potential confounding due to population stratification and gender1,3 by matching cases and controls of the same gender based on inferred genetic ancestry. As previous studies4,5 demonstrated that the Finnish population forms an ancestry cluster distinct from other European populations like those included in this study, we analyzed our Finnish cohort independently from others. To maximize opportunities for genetic matching and analytic power, we analyzed all subjects in the remaining European cohorts together. The resulting matched case-control data consisted of 808 cases and 4,393 controls in the Finnish (FI) cohort and 1,972 cases and 8,122 controls in the rest of the combined European (CE) cohort (Supplementary Table 3). We used the QC-passed genotype data and phased chromosomes from the HapMap CEU sample to impute missing genotypes6. We based our further analyses on 831,534 SNPs that passed the QC filters both in the FI and CE samples (Table 1 and Supplementary Table 2).
We tested for association of each QC-passed SNP with IA using conditional logistic regression, assuming a log-additive effect of allele dosage. We corrected each cohort for residual overdispersion (Table 1) using genomic control7, and combined the results from FI and CE to obtain P-values, odds ratios (ORs) and confidence intervals (CIs) for the discovery cohort of 2,780 cases and 12,515 controls using a fixed-effects model.
To evaluate the strength of association, in addition to using P-values, we employed a Bayesian approach8. We used the Bayes factor (BF) that represents the fold-change of the odds of association before and after observing the data9, and the posterior probability of association (PPA), calculated through the BF, that provides a simple probabilistic measure of the evidence of association8,10. For every SNP, we assumed a uniform prior probability of association of 1/10,000 and set the prior of the logarithm of per-allele OR as a normal distribution with a 95% probability of the OR to be between 0.67 and 1.5, with larger weights for smaller effect sizes9,11.
From the discovery results, we eliminated 2 imputed SNPs that showed PPAs of 0.97 and 0.94 as their association signals were not supported by surrounding genotyped SNPs and their genotypes were not confirmed by direct genotyping results (data not shown). This resulted in 831,532 QC-passed SNPs (Supplementary Table 2).
We observed 3 regions that showed very high PPA (> 0.995; Fig. 1a) and also a substantial excess of SNPs with P < 1×10⁻³ (1,295 SNPs versus 831 SNPs expected by chance) even after excluding those within previously identified associated regions2 (Fig. 1b). Moreover, we observed a strong correlation between the P-values and BFs for the upper tail of the distribution (Fig. 1c).
Figure 1. Genome-wide association analysis results in the discovery cohort.
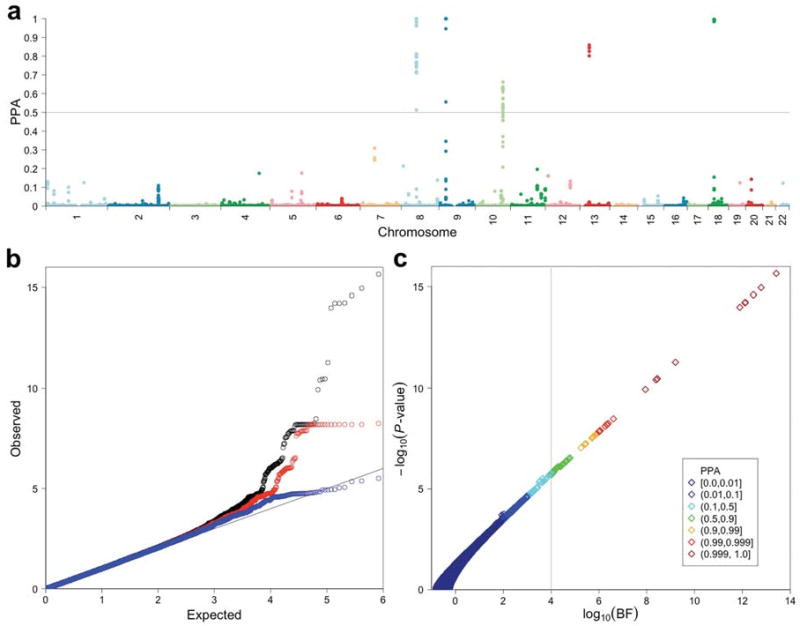
(a) The posterior probabilities of association (PPAs) for 831,532 QC-passed SNPs analyzed specifying a prior probability of association of 1/10,000 are plotted against genomic locations of SNPs. A gray horizontal line at PPA = 0.5 indicates the cutoff value for follow-up genotyping. (b) Quantile-quantile (QQ) plots of P-values (−log10 scale) are shown for: all the SNPs analyzed (black; n = 831,532); SNPs after excluding those within previously identified regions (red; n = 830,907); SNPs after excluding all within the final associated intervals (blue; n = 830,158). (c) A scatter plot of −log10 P-values vs. log10 Bayes factors (BFs) is shown with color for each point indicating the range of PPA. There are very close relationships among the P-value for association, the BF and PPA. Note that, given a uniform prior probability of association, the PPA increases as the BF increases. A vertical line indicates the minimum PPA threshold at 0.5 (BF = 1.0×10⁴) for follow-up.
We focused on 5 genomic regions (Fig. 1a) that contained at least one SNP with PPA > 0.5, for which the hypothesis of association with IA is more likely than the null hypothesis of no association. The PPAs and P-values of the most highly associated SNPs in these intervals ranged from 0.6621 to > 0.9999 and 7.9×10⁻⁷ to 2.2×10⁻¹⁶, respectively (Supplementary Table 4). The 5 chromosomal segments included 3 newly identified SNP clusters at 10q24.32, 13q13.1 and 18q11.2. The remaining 2 regions were previously identified loci at 8q11.23-q12.1 and 9p21.32 (Fig. 2). The third locus identified in our previous study at 2q33 did not contain any SNPs with PPA > 0.5. Furthermore, consistent with our previous results2, detailed analysis of the 8q11.23-q12.1 region detected two independent association signals within < 100 kb interval that spans the SOX17 locus (Fig. 2 and Supplementary Fig. 1); hereafter these two signals are referred to as 5′-SOX17 and 3′-SOX17. Thus the 5 chromosomal segments comprised 6 independent association signals for follow-up.
Figure 2. Regional plots for associated regions.
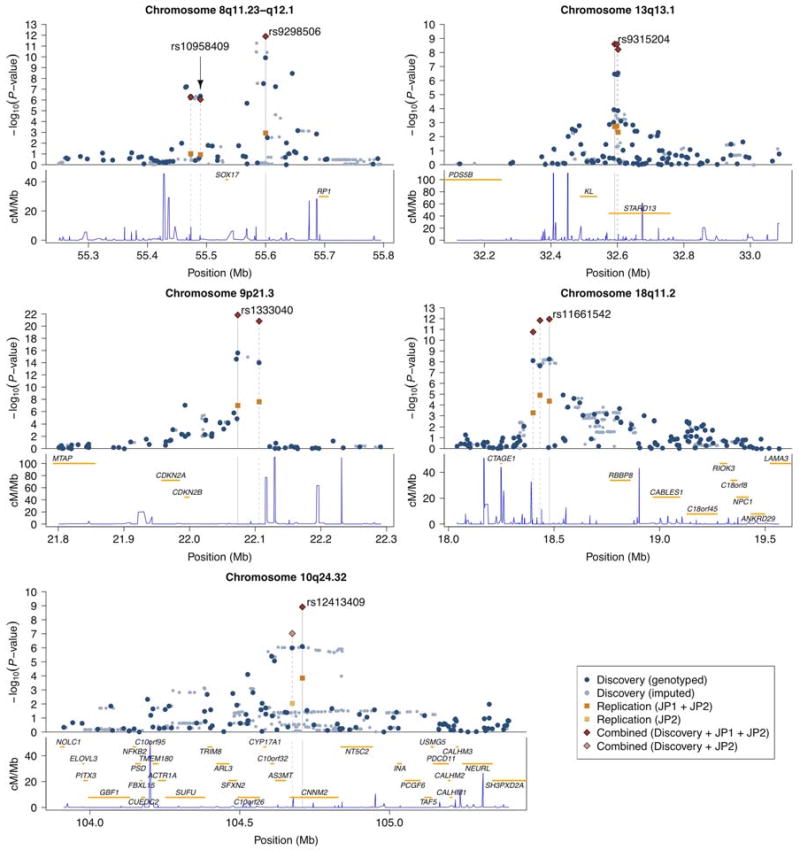
For each chromosomal interval, −log10 P-values for association are plotted against the genomic coordinates (NCBI build 36) in the upper panel; the recombination rates obtained from the HapMap database and the RefSeq genes (hg18) within the regions are shown in the lower panel. In the upper panel, rs identifiers of SNPs listed in Table 2 are shown and their positions are indicated by gray vertical lines. Gray dashed lines indicate locations of other SNPs genotyped in the replication cohorts. Dark blue and light blue dots represent results of genotyped and imputed SNPs for the discovery cohort, respectively; orange and light orange squares represent association results for the replication cohort using JP1 plus JP2 and JP2-only, respectively; combined results for SNPs genotyped both in the discovery and the replication cohort using JP1 plus JP2 and JP2-only are shown by red and light red diamonds, respectively.
We performed replication genotyping in 2 Japanese cohorts including 3,111 cases and 1,666 controls (JP1 and JP2, see Table 1). For each independent signal, we selected for replication the genotyped SNP with the highest PPA, and added up to 2 additional SNPs per locus. For the 5′-SOX17 region, we selected 2 SNPs analyzed previously, as they tag the best SNP in the current study (Supplementary Fig. 1).
All but one of the SNPs (rs12411886 on 10q24.32 in JP1) were successfully genotyped and passed QC filters. We tested for association of each SNP with IA using logistic regression stratified by gender, specifying the same model as for the discovery cohort (Supplementary Table 5). We combined results from JP1 and JP2 using a fixed-effects model (Table 2 and Supplementary Table 4). We considered an association to be replicated if the BF increased the odds of association > 10-fold after observing the replication data.
Table 2.
Representative SNPs analyzed both in the discovery and replication cohorts
| Locus | SNP | Position | Genes | Risk Allele | Cohort | P-value | log10(BF) | PPA | Per-allele OR (95% CI) | Control RAF | Case RAF |
|---|---|---|---|---|---|---|---|---|---|---|---|
| 8q11.23 | rs10958409 | 55,489,644 | SOX17 | A | Discovery | 4.2×10-07 | 4.64 | 0.8128 | 1.24 (1.14-1.35) | 0.15, 0.19 | 0.18, 0.22 |
| Replication | 0.12 | -0.11 | 1.08 (0.98-1.20) | 0.28 | 0.29 | ||||||
| Combined | 9.0×10-07 | 4.30 | 0.6685 | 1.17 (1.10-1.25) | |||||||
| 8q12.1 | rs9298506 | 55,600,077 | SOX17 | A | Discovery | 1.2×10⁻¹⁰ | 7.94 | 0.9999 | 1.33 (1.22-1.45) | 0.81, 0.76 | 0.85, 0.81 |
| Replication | 0.0012 | 1.56 | 1.21 (1.08-1.36) | 0.79 | 0.81 | ||||||
| Combined | 1.3×10⁻¹² | 9.85 | 1.0 – 1.4×10-06 | 1.28 (1.20-1.38) | |||||||
| 9p21.3 | rs1333040 | 22,073,404 | CDKN2A, CDKN2B | T | Discovery | 2.5×10⁻¹⁶ | 13.41 | 1.0 – 3.9×10⁻¹⁰ | 1.32 (1.24-1.41) | 0.56, 0.45 | 0.63, 0.53 |
| Replication | 1.0×10-07 | 5.18 | 1.31 (1.19-1.45) | 0.66 | 0.72 | ||||||
| Combined | 1.5×10⁻²² | 19.48 | 1.0 – 3.3×10⁻¹⁶ | 1.32 (1.25-1.39) | |||||||
| 10q24.32 | rs12413409 | 104,709,086 | CNNM2 | G | Discovery | 7.9×10-07 | 4.29 | 0.6621 | 1.38 (1.22-1.57) | 0.91, 0.91 | 0.94, 0.93 |
| Replication | 0.00014 | 2.34 | 1.23 (1.10-1.37) | 0.74 | 0.77 | ||||||
| Combined | 1.2×10-09 | 7.00 | 0.9990 | 1.29 (1.19-1.40) | |||||||
| 13q13.1 | rs9315204 | 32,591,837 | KL, STARD13 | T | Discovery | 3.3×10-07 | 4.73 | 0.8443 | 1.21 (1.13-1.31) | 0.21, 0.33 | 0.24, 0.39 |
| Replication | 0.0019 | 1.36 | 1.18 (1.06-1.31) | 0.24 | 0.27 | ||||||
| Combined | 2.5×10-09 | 6.72 | 0.9981 | 1.20 (1.13-1.28) | |||||||
| 18q11.2 | rs11661542 | 18,477,693 | RBBP8 | C | Discovery | 5.6×10-09 | 6.39 | 0.9959 | 1.21 (1.14-1.30) | 0.49, 0.44 | 0.54, 0.47 |
| Replication | 4.5×10-05 | 2.79 | 1.22 (1.11-1.34) | 0.61 | 0.65 | ||||||
| Combined | 1.1×10⁻¹² | 9.92 | 1.0 – 1.2×10-06 | 1.22 (1.15-1.28) |
Genomic locations for SNPs are based on NCBI build 36 and risk alleles are aligned to the forward strand of the reference sequence. Control and case risk allele frequencies (RAFs) for the discovery cohort are shown in the form: (RAF of CE), (RAF of FI). log10(BF) indicates the logarithm of the Bayes factor in favor of association. PPA stands for the posterior probability of association. Genes closest to the listed SNPs within the same linkage disequilibrium regions are shown.
Of the 6 candidate loci, all but the 5′-SOX17 interval were replicated, with replication P-values ranging from 0.0019 to 1.0×10⁻⁷ and the odds of association with IA increasing by 22.9 to 1.5×10⁵-fold, yielding robust evidence for replication for each interval (Table 2).
We combined the discovery and replication results using a fixed-effects model. All of the 5 loci that replicated in the Japanese cohort surpassed the conventional threshold for genome-wide significance (P < 5×10⁻⁸), with P-values ranging from 2.5×10⁻⁹ to 1.5×10⁻²², and all also had PPAs ≥ 0.998 (Table 2).
In order to determine each cohort's contribution to the observed association and to assess the consistency of the effect size across cohorts, we analyzed each ascertained cohort separately (Table 1 and Supplementary Table 5) and then combined the results from the 6 cohorts using a random-effects model. The association results remained highly significant (Fig. 3). For the 5 loci that were replicated in the Japanese cohorts, we found no evidence of significant heterogeneity across cohorts (P > 0.1). Every cohort had the same risk allele and provided support for association with the exception of JP1 cohort for the 3′-SOX17 locus, consistent with our previous study2 (Fig. 3).
Figure 3. Consistency of association across cohorts.
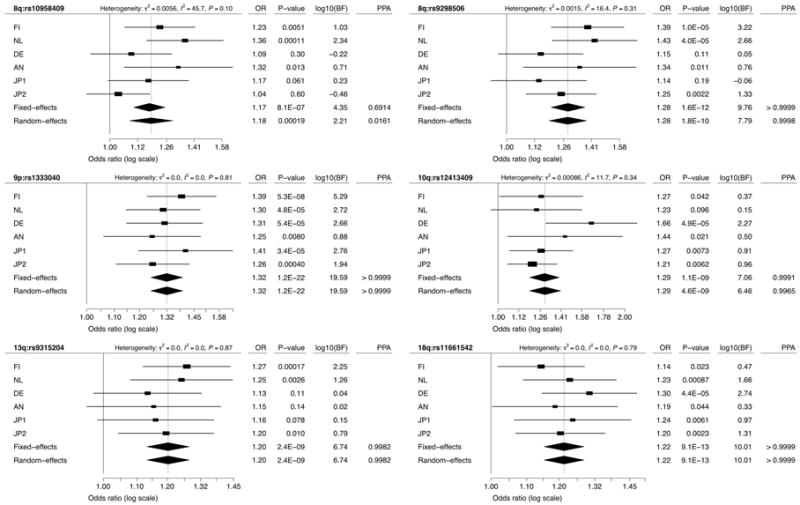
Forest plots are shown for meta-analysis of SNPs listed in Table 2. Squares and horizontal segments represent estimated per-allele odds ratios (ORs) and 95% confidence intervals (CIs) for individual cohorts. Diamonds represent the summary OR estimates and 95% CIs for the meta-analyses of 6 cohorts (fixed- and random-effects models). log10(BF) > 0 supports association with IA, while log10(BF) < 0 supports no association with IA. Analyzing the results here as 6 distinct cohorts rather than 4 (as in the primary analysis) results in only minor differences, due to different weights given to sub-cohorts of the combined European cohort (CE) associated with genomic control correction.
The most significant association was detected in the previously reported2 9p21.3 region near CDKN2A and CDKN2B with P = 1.5×10⁻²² (OR = 1.32; PPA > 0.9999). All of the newly studied cohorts strongly supported this association with IA (Fig. 3). These same alleles are also associated with coronary artery disease, but not with type 2 diabetes12. Similarly, the previously reported 8q11.23-q12.1 region showed significant association. The 3′-SOX17 interval (rs92986506) showed robust association with P = 1.3×10⁻¹² (OR = 1.28; PPA > 0.9999) and all new cohorts supported association of this SNP with IA (Fig. 3). For the 5′-SOX17 region (rs10958409), the new cohorts introduced a substantial heterogeneity across cohorts, lowering PPA to 0.016 (Fig. 3).
Among the newly identified loci, the strongest association was found at rs11661542 on 18q11.2 (OR = 1.22; P = 1.1×10⁻¹²; PPA > 0.9999). A cluster of SNPs that are associated with IA spans the interval between 18.400Mb and 18.509Mb and are strongly correlated with rs11661542 (Fig. 2). A single gene, RBBP8 (retinoblastoma binding protein 8), is located within an extended linkage disequilibrium (LD) interval (Fig. 2).
The second strongest new association was at rs12413409 on 10q24.32 (OR = 1.29; P = 1.2×10⁻⁹; PPA = 0.9990), which maps to intron 1 of CNNM2 (cyclin M2) (Fig. 2). A cluster of SNPs strongly correlated with rs12413409 and located within a ∼247kb interval in the same LD block supported the association (Fig. 2).
The third new locus is defined by rs9315204 at 13q13.1 (OR = 1.20; P = 2.5×10⁻⁹; PPA = 0.9981) in intron 7 of STARD13 (StAR-related lipid transfer (START) domain containing 13) (Fig. 2). Two SNPs, rs1980781 and rs3742321, that are strongly correlated with rs9315204 (r2 > 0.9) also showed significant association with IA (Fig. 2 and Supplementary Table 4). These two SNPs are missense (lysine to arginine) and synonymous coding variants of STARD13, respectively. Another gene that has been implicated in aging phenoytpes, KL (klotho), is located nearby13.
A search of the gene-expression database (eQTL browser, http://eqtl.uchicago.edu/) for all the IA-risk loci did not reveal any consistent pattern of association of IA SNPs with variation in gene expression levels.
In this second GWAS of IA, which included nearly 3 times as many cases as the initial study, we detected 3 novel risk loci and obtained strong independent evidence for association of 2 previously identified loci. The evidence that these are bona fide risk loci for IA is very strong from both Bayesian measures and conventional P-values.
Given our power (∼90%) to detect variants that confer risk of IA with GRR = 1.25 and MAFs ≥ 10%, we expect that we have identified most of these variants, limited principally by potential gaps in SNP coverage. Indeed, across the rest of the genome, there was no locus with PPA > 0.22 and MAF ≥ 10%, while there were 14 loci with PPAs between 0.1 and 0.22 and ORs between 1.16 and 1.25 (data not shown). We expect that a fraction of these loci are genuine IA risk loci, as suggested by the excess of SNPs with P < 1×10⁻³ (Fig. 1b); exploring this possibility will require analysis of still larger IA cohorts and/or genotyping of alleles with lower MAF.
Based on the results of the first GWAS of IA and the role of the implicated gene products, Sox17 and p15INK4b/p16INK4a, we previously hypothesized2 that the IA genes implicated might play a role in determining cell cycle progression, affecting proliferation14 and senescence of progenitor cell populations and/or the balance between production of progenitor cells versus cells committed to differentiation. Genes located within the newly identified regions support this idea. RBBP8, located within the 18q11.2 region, influences progression through the cell cycle by interacting with BRCA115. Similarly, of the two genes located within the 13q13.1 interval, STARD13 contains Rho-GAP and C-terminal STAR related lipid transfer (START) domains and its overexpression results in suppression of cell proliferation16. The other gene, KL, encodes a transmembrane protein that modulates FGF receptor specificity17; KL-deficient mice display accelerated aging in diverse organ systems13.
On the assumption that there is a four-fold increase in the risk of IA among siblings of cases18,19 and that the SNPs combine to increase log-odds of disease in an additive fashion, the 5 IA risk loci explain 5.2% (FI), 4.0% (CE) and 3.5% (combined JP1 and JP2) of the familial risk of IA. Under this model, the odds of developing IA varies 4.99 to 7.63 fold across the top and bottom 1% of genetic risk profile at these loci in these populations and 3.61 to 4.64 fold across the 5% extremes (Supplementary Fig. 2). When combined with traditional risk factors such as gender, blood pressure and smoking, these findings form the basis of future work aimed at pre-clinical identification of individuals who are at high risk of IA formation and rupture.
Online Methods
Genotyping
Whole-genome genotyping for discovery cohort was performed on the Illumina platform according to the manufacturer's protocol (Illumina, SanDiego, CA, USA). Beadchips used for individual cohorts are presented in Supplementary Table 2. Replication genotyping in the JP1 cohort was performed using either Taqman (Applied Biosystems) or MassARRAY (Sequenom) assays. For the JP2 cohort, genotyping for cases was performed using the multiplex PCR-based Invader assay (Third Wave Technologies Inc.); genotyping for controls was performed on Illumina platform as described previously20.
Ethics
The study protocol was approved by the Yale Human Investigation Committee (HIC protocol #7680). Institutional review board approval for genetic studies, along with written consent from all study participants, was obtained at all participating institutions.
Data storage and analysis tools
We used PLINK21 v1.06 and R statistical environment v2.9.0 (in particular, the snpMatrix package22) for storage of genotype data and data analysis.
Preprocessing
Prior to the analysis of genotyping data, we excluded SNPs that were located either on mtDNA or sex chromosomes; with A/T or C/G alleles; for which all subjects were assigned as ‘no call’; and assayed on Hap300v1 or 550v1 but dropped from newer versions.
Sample quality control (QC)
We excluded subjects in the discovery cohort that did not conform to our study design on the basis of genotyping and information quality, cryptic relatedness and population outliers. We summarized the sample exclusion steps in Supplementary Table 2. This filtering process resulted in 835 cases and 6,529 controls in the Finnish (FI) cohort and 2,000 cases and 8,722 controls in the rest of the combined European (CE) cohort.
Imputation
We performed imputation analysis with the HapMap phase II CEU reference panel (release 24) using the IMPUTE v1 software6. The analysis was performed separately for the FI and CE cohorts. We converted posterior probabilities of three possible genotypes to the fractional allele dosage scores (between 0 and 2) and used these scores for association tests in order to take into account the imputation uncertainty23. For the quality assessment of imputed SNPs, we also converted the posterior probabilities to the most likely genotypes with the threshold at 0.9.
Case-control matching
Population stratification and independent genotyping of cases and controls are major causes of confounding in genome-wide association studies24. Because our study consisted of multiple independently ascertained cohorts that were genotyped separately, we performed a stringent analysis to control for these biases by inferring genetic ancestries of subjects25,26. We used the Laplacian eigenmaps27 to infer population structure. Following the determination of the number of dimensions (K + 1) using the threshold given in Lee et al.28, we used the K-dimensional non-trivial generalized eigenvectors29 to calculate the Euclidean distance between two subjects.
In the course of this analysis, we excluded “isolated” subjects who were identified by using the nearest-neighbor distance distributions in any of the 2-dimensional sections. After excluding these subjects, we observed 13 and 5 dimensions in FI and CE, respectively. The larger dimensions observed in FI could be attributable to the presence of many isolated populations in Finland5.
Before matching, we stratified data into males and females because female gender is a known risk factor of IA1,3. We also set the maximum distance between cases and controls to match to be less than 0.028 and 0.009 in FI and CE cohorts, respectively. These values were determined by examining the distribution of the nearest-neighbor distances in K-dimensions (data not shown). We matched cases and controls using the fullmatch function in the R-package optmatch30,31.
SNP quality control
For both genotyped and imputed SNPs in the discovery cohort, we applied QC filters to individual cohorts and to cases and controls separately, on the basis of the missing rate, minor allele frequency (MAF) and the P-value of the exact test of Hardy-Weinberg equilibrium (HWE)32. For imputed SNPs, we also assessed imputation quality using the average posterior probability, MAF and allelic R2 metric33. Finally, we assessed differential missingness between cases and controls (Supplementary Table 2).
Any genotyped SNP that passed the QC filters both in the CE and FI cohorts is referred to as a “genotyped SNP” while one for which we used the QC-passed imputation data either in one or both of the cohorts is classified as an “imputed SNP”.
For genotyping data of the replication cohorts, we excluded SNPs if any of the following 3 conditions were met in either cases or controls: (i) missing rate > 0.05; (ii) P-value of the exact test of HWE < 0.001; or (iii) MAF < 0.01.
Statistical analysis
Cohort-wise association analysis
We tested for association between each QC-passed SNP and IA using the conditional and unconditional logistic regression for the discovery and replication cohorts, respectively34. For the discovery cohort, we used the matched strata to correct for potential confounding due to population stratification and gender, while for the replication cohorts we adjusted for gender. We assumed the log-additive effect of allele dosage on disease risk. We obtained P-values from the score test (two-sided) and estimated the logarithm of per-allele odds ratios (ORs) with standard errors (SEs) by maximizing the (conditional or unconditional) likelihood. Both the test statistic and the SE of log-OR were corrected using genomic control7. We performed the association analysis for FI and CE, as well as sub-cohorts of CE that consisted of NL cases, DE cases or @neurIST cases and their matched controls (Table 1 and Supplementary Table 3). We used the following R-functions to perform the association analysis: clogit, glm and snp.rhs.tests22.
Meta-analysis
We combined the cohort-wise per-allele ORs in FI and CE using a fixed-effects model of meta-analysis for 831,534 QC-passed SNPs to obtain the discovery results. For SNPs analyzed both in the discovery and replication cohorts, we combined JP1 and JP2 to obtain replication results and all 4 cohorts to obtain combined results. Our primary analysis was based on the fixed-effects model23. In order to assess the heterogeneity of the effect size between cohorts, we first divided CE into 3 cohorts as described above, aiming to analyze data without averaging effect sizes over the combined European cohorts, and then combined 6 cohorts using the random-effects model. We employed the restricted maximum likelihood procedure to estimate the between-cohort heterogeneity variance (τ 2) using the R-function MiMa35 (http://www.wvbauer.com/). From this estimate, we calculated the Cochran's Q statistic and the I2 statistic36.
Bayesian evaluation of the strength of association
To evaluate the strength of association, we employed a Bayesian approach9,37. A limitation of the use of P-values alone is that variability in factors such as effect size, MAF and sample size can result in identical statistics that might correspond to markedly different levels of evidence regarding the strength of association10. The Bayes factor (BF) provides an alternative that compares the probabilities of the data under the alternative hypothesis versus the null hypothesis. For computational simplicity, we approximated BF as described by Wakefield8. For all SNPs, we assumed a single prior for the log-OR: a normal distribution with mean 0 and standard deviation log(1.5)/ Φ-1(0.975), where Φ is the normal distribution function9.
The posterior probability of association10 (PPA) provides a simple probabilistic measure of evidence by introducing the prior probability of association, π1. We assumed a uniform prior, π1 = 1/10,000, for all the SNPs11. For BF > 106, changing π1 to a more conservative value of 1/100,000 would result in little change in the posterior probability of association.
To combine the results from multiple cohorts, we extended the formula38 to be applicable to multiple (> 2) cohorts.
Conditional analysis
For each region that contained a SNP with PPA > 0.5, we examined the number of independent association signals by testing for association of every genotyped SNP with IA by adjusting for the effect of a specified SNP (Supplementary Fig. 1).
Two-locus interaction analysis
We tested for deviation from a linear model, which assumes that two SNPs combine to increase the log-odds of disease in an additive fashion, using conditional (FI and CE) or unconditional (JP: JP1 plus JP2, stratified by cohorts and gender) logistic regression. There was no significant deviation from the linear model (data not shown).
Cumulative effect
We evaluated potential clinical implications of the genetic profiles of the 5 IA risk loci following the approach described by Clayton39. We fitted a 5-locus conditional (FI and CE) or unconditional (JP) logistic regression model including the additive and dominance-deviation terms for each locus. Using the estimated effect sizes and individual's genotypes, we calculated the risk scores for every individual. The receiver-operating characteristic (ROC) curve for each ethnic cohort (FI, CE and JP) was depicted using the risk score.
We also calculated the ratio of the exponential of the mean of the risk scores for control subjects within the top versus bottom 5 or 1% to obtain approximated odds ratios of disease between these classes.
The sibling recurrence risk was estimated by assuming the polygenic model that fits well to our data39. Fraction of the sibling recurrence risk attributable to all of the 5 loci was calculated by taking the ratio of the logarithm of this value and epidemiologically estimated value of 418,19.
Supplementary Material
Acknowledgments
We are grateful to the participants who made this study possible. We thank Andrea Chamberlain, Birgitt Meseck-Selchow and members of the Keck Foundation Biotechnology Resource Laboratory for their technical help. This study was supported by the Yale Center for Human Genetics and Genomics and the Yale Program on Neurogenetics, the US National Institute of Health grants R01NS057756 (M.G.) and U24 NS051869 (S.M.) and the Howard Hughes Medical Institute (R.P.L.). The @neurIST project was funded by European Commission, VI Framework Programme, Priority 2, Information Society Technologies, a European Public Funded Organization (Research Grant No. IST-FP6-027703). The Frankfurt case cohort collection was supported by BMBF (01GI9907), Utrecht Control cohort by the Prinses Beatrix Fonds and the Adessium foundation (L.H.vdB.). S.M. was supported in part by the Clinical and Translational Science Award UL1 RR024139, National Center for Research Resources, NIH. We would also like to acknowledge the use of Yale University Biomedical High Performance Computing Center (NIH grant: RR19895).
Footnotes
Competing Financial Interest: The authors declare competing financial interests. The authors have a provisional patent application under consideration based on the findings of this work.
Author Contributions: Study Cohorts: ascertainment, characterization and DNA preparation: M.N., M.v.u.z.F., E.G., J.E.J., J.H. and A.P. (FI case-control); Y.M.R. and G.J.E.R. (NL cases); P.B., T.D., J.B., G.Z., P.S., R.R., S.T., C.M.F., P.S., A.F.F., V.E., M.C.J.M.S., P.L., J.B., J.M. and D.R. (@neurIST case series); B.K., G.A., M.S., D.K., F.W., A.O., B.S., C.S., J.B., F.R., C.R., D.B., C.G., E.I.S., B.M., A.R. and H.S. (DE case series); A.T., A.H., H.K. and I.I. (JP1); S.K.L., H.Z. and Y.N. (JP2). Control Cohorts: A.A., A.P. and L.P. (Health2000); A.A., A.P. and L.P. (NFBC1966); C.M.v.D. and M.M.B.B. (Rotterdam Study); L.H.v.d.B. and C.W. (Utrecht); T.I. and H.E.W. (KORA-gen); S.S. (PopGen). Genotyping: K.B., Z.A., N.N., A.K.O., E.G., S.M., R.P.L. and M.G. (Yale); P.C., P.C. and F.C. (Aneurist); S.K.L., H.Z. and Y.N. (JP2). Data management and informatics: K.Y., K.B., Z.A., N.N. and M.G. (Yale); S.K.L., H.Z. and Y.N. (JP2 cohort); Statistical analysis: K.Y. and M.G. Writing team: K.Y., K.B., M.W.S., R.P.L. and M.G. Study design and analysis plan: K.Y., R.P.L. and M.G.
References
- 1.Rinkel GJ, Djibuti M, Algra A, van Gijn J. Prevalence and risk of rupture of intracranial aneurysms: a systematic review. Stroke. 1998;29:251–6. doi: 10.1161/01.str.29.1.251. [DOI] [PubMed] [Google Scholar]
- 2.Bilguvar K, et al. Susceptibility loci for intracranial aneurysm in European and Japanese populations. Nat Genet. 2008;40:1472–7. doi: 10.1038/ng.240. [DOI] [PMC free article] [PubMed] [Google Scholar]
- 3.Iwamoto H, et al. Prevalence of intracranial saccular aneurysms in a Japanese community based on a consecutive autopsy series during a 30-year observation period. The Hisayama study. Stroke. 1999;30:1390–5. doi: 10.1161/01.str.30.7.1390. [DOI] [PubMed] [Google Scholar]
- 4.Salmela E, et al. Genome-wide analysis of single nucleotide polymorphisms uncovers population structure in Northern Europe. PLoS One. 2008;3:e3519. doi: 10.1371/journal.pone.0003519. [DOI] [PMC free article] [PubMed] [Google Scholar]
- 5.Jakkula E, et al. The genome-wide patterns of variation expose significant substructure in a founder population. Am J Hum Genet. 2008;83:787–94. doi: 10.1016/j.ajhg.2008.11.005. [DOI] [PMC free article] [PubMed] [Google Scholar]
- 6.Marchini J, Howie B, Myers S, McVean G, Donnelly P. A new multipoint method for genome-wide association studies by imputation of genotypes. Nat Genet. 2007;39:906–13. doi: 10.1038/ng2088. [DOI] [PubMed] [Google Scholar]
- 7.Devlin B, Roeder K. Genomic control for association studies. Biometrics. 1999;55:997–1004. doi: 10.1111/j.0006-341x.1999.00997.x. [DOI] [PubMed] [Google Scholar]
- 8.Wakefield J. A Bayesian measure of the probability of false discovery in genetic epidemiology studies. Am J Hum Genet. 2007;81:208–27. doi: 10.1086/519024. [DOI] [PMC free article] [PubMed] [Google Scholar]
- 9.Wellcome Trust Case Control Consortium. Genome-wide association study of 14,000 cases of seven common diseases and 3,000 shared controls. Nature. 2007;447:661–78. doi: 10.1038/nature05911. [DOI] [PMC free article] [PubMed] [Google Scholar]
- 10.Stephens M, Balding DJ. Bayesian statistical methods for genetic association studies. Nat Rev Genet. 2009;10:681–90. doi: 10.1038/nrg2615. [DOI] [PubMed] [Google Scholar]
- 11.Wacholder S, Chanock S, Garcia-Closas M, El Ghormli L, Rothman N. Assessing the probability that a positive report is false: an approach for molecular epidemiology studies. J Natl Cancer Inst. 2004;96:434–42. doi: 10.1093/jnci/djh075. [DOI] [PMC free article] [PubMed] [Google Scholar]
- 12.Helgadottir A, et al. The same sequence variant on 9p21 associates with myocardial infarction, abdominal aortic aneurysm and intracranial aneurysm. Nat Genet. 2008;40:217–24. doi: 10.1038/ng.72. [DOI] [PubMed] [Google Scholar]
- 13.Kuro-o M, et al. Mutation of the mouse klotho gene leads to a syndrome resembling ageing. Nature. 1997;390:45–51. doi: 10.1038/36285. [DOI] [PubMed] [Google Scholar]
- 14.Visel A, et al. Targeted deletion of the 9p21 non-coding coronary artery disease risk interval in mice. Nature. 2010 doi: 10.1038/nature08801. [DOI] [PMC free article] [PubMed] [Google Scholar]
- 15.Yun MH, Hiom K. CtIP-BRCA1 modulates the choice of DNA double-strand-break repair pathway throughout the cell cycle. Nature. 2009;459:460–3. doi: 10.1038/nature07955. [DOI] [PMC free article] [PubMed] [Google Scholar]
- 16.Leung TH, et al. Deleted in liver cancer 2 (DLC2) suppresses cell transformation by means of inhibition of RhoA activity. Proc Natl Acad Sci U S A. 2005;102:15207–12. doi: 10.1073/pnas.0504501102. [DOI] [PMC free article] [PubMed] [Google Scholar]
- 17.Urakawa I, et al. Klotho converts canonical FGF receptor into a specific receptor for FGF23. Nature. 2006;444:770–4. doi: 10.1038/nature05315. [DOI] [PubMed] [Google Scholar]
- 18.Schievink WI. Genetics of intracranial aneurysms. Neurosurgery. 1997;40:651–62. doi: 10.1097/00006123-199704000-00001. discussion 662-3. [DOI] [PubMed] [Google Scholar]
- 19.Cannon Albright LA, et al. A genealogical assessment of heritable predisposition to aneurysms. J Neurosurg. 2003;99:637–43. doi: 10.3171/jns.2003.99.4.0637. [DOI] [PubMed] [Google Scholar]
- 20.Kamatani Y, et al. A genome-wide association study identifies variants in the HLA-DP locus associated with chronic hepatitis B in Asians. Nat Genet. 2009;41:591–5. doi: 10.1038/ng.348. [DOI] [PubMed] [Google Scholar]
- 21.Purcell S, et al. PLINK: a tool set for whole-genome association and population-based linkage analyses. Am J Hum Genet. 2007;81:559–75. doi: 10.1086/519795. [DOI] [PMC free article] [PubMed] [Google Scholar]
- 22.Clayton D, Leung HT. An R package for analysis of whole-genome association studies. Hum Hered. 2007;64:45–51. doi: 10.1159/000101422. [DOI] [PubMed] [Google Scholar]
- 23.de Bakker P, et al. Practical aspects of imputation-driven meta-analysis of genome-wide association studies. Hum Mol Genet. 2008;17:R122–8. doi: 10.1093/hmg/ddn288. [DOI] [PMC free article] [PubMed] [Google Scholar]
- 24.Clayton DG, et al. Population structure, differential bias and genomic control in a large-scale, case-control association study. Nat Genet. 2005;37:1243–6. doi: 10.1038/ng1653. [DOI] [PubMed] [Google Scholar]
- 25.Patterson N, Price AL, Reich D. Population structure and eigenanalysis. PLoS Genet. 2006;2:e190. doi: 10.1371/journal.pgen.0020190. [DOI] [PMC free article] [PubMed] [Google Scholar]
- 26.Price AL, et al. Principal components analysis corrects for stratification in genome-wide association studies. Nat Genet. 2006;38:904–9. doi: 10.1038/ng1847. [DOI] [PubMed] [Google Scholar]
- 27.Belkin M, Niyogi P. Laplacian eigenmaps for dimensionality reduction and data representation. Neural Comput. 2003;15:1373–1396. [Google Scholar]
- 28.Lee A, Luca D, Klei L, Devlin B, Roeder K. Discovering genetic ancestry using spectral graph theory. Genet Epidemiol. 2009 doi: 10.1002/gepi.20434. [DOI] [PMC free article] [PubMed] [Google Scholar]
- 29.von Luxburg U. A tutorial on spectral clustering. Stat Comput. 2007;17:395–416. [Google Scholar]
- 30.Rosenbaum P. A characterization of optimal designs for observational studies. J R Statist Soc B. 1991;53:597–610. [Google Scholar]
- 31.Hansen B, Klopfer S. Optimal full matching and related designs via network flows. J Comput Graph Stat. 2006;15:609–627. [Google Scholar]
- 32.Wigginton J, Cutler D, Abecasis G. A note on exact tests of Hardy-Weinberg equilibrium. Am J Hum Genet. 2005;76:887–93. doi: 10.1086/429864. [DOI] [PMC free article] [PubMed] [Google Scholar]
- 33.Browning B, Browning S. A unified approach to genotype imputation and haplotype-phase inference for large data sets of trios and unrelated individuals. Am J Hum Genet. 2009;84:210–23. doi: 10.1016/j.ajhg.2009.01.005. [DOI] [PMC free article] [PubMed] [Google Scholar]
- 34.Breslow N, Day N. IARC Sci Publ. 1980. Statistical methods in cancer research Volume I - The analysis of case-control studies; pp. 5–338. [PubMed] [Google Scholar]
- 35.Viechtbauer W. Bias and efficiency of meta-analytic variance estimators in the random-effects model. J Educ Behav Stat. 2005;30:261–293. [Google Scholar]
- 36.Higgins J, Thompson S, Deeks J, Altman D. Measuring inconsistency in meta-analyses. BMJ. 2003;327:557–60. doi: 10.1136/bmj.327.7414.557. [DOI] [PMC free article] [PubMed] [Google Scholar]
- 37.Goodman S. Toward evidence-based medical statistics. 2: The Bayes factor. Ann Intern Med. 1999;130:1005–1013. doi: 10.7326/0003-4819-130-12-199906150-00019. [DOI] [PubMed] [Google Scholar]
- 38.Wakefield J. Reporting and interpretation in genome-wide association studies. Int J Epidemiol. 2008;37:641–53. doi: 10.1093/ije/dym257. [DOI] [PubMed] [Google Scholar]
- 39.Clayton D. Prediction and interaction in complex disease genetics: experience in type 1 diabetes. PLoS Genet. 2009;5:e1000540. doi: 10.1371/journal.pgen.1000540. [DOI] [PMC free article] [PubMed] [Google Scholar]
Associated Data
This section collects any data citations, data availability statements, or supplementary materials included in this article.