Abstract
Loss of skeletal muscle mass and function is observed in many insulin-resistant disease states such as diabetes, cancer cachexia, renal failure and ageing although the mechanisms for this remain unclear. We hypothesised that impaired insulin signalling results in reduced muscle mass and function and that this decrease in muscle mass and function is due to both increased production of atrogenes and aberrant reactive oxygen species (ROS) generation. Maximum tetanic force of the extensor digitorum longus of muscle insulin receptor knockout (MIRKO) and lox/lox control mice was measured in situ. Muscles were removed for the measurement of mass, histological examination and ROS production. Activation of insulin signalling pathways, markers of muscle atrophy and indices of protein synthesis were determined in a separate group of MIRKO and lox/lox mice 15 min following treatment with insulin. Muscles from MIRKO mice had 36% lower maximum tetanic force generation compared with muscles of lox/lox mice. Muscle fibres of MIRKO mice were significantly smaller than those of lox/lox mice with no apparent structural abnormalities. Muscles from MIRKO mice demonstrated absent phosphorylation of AKT in response to exogenous insulin along with a failure to phosphorylate ribosomal S6 compared with lox/lox mice. Atrogin-1 and MuRF1 relative mRNA expression in muscles from MIRKO mice were decreased compared with muscles from lox/lox mice following insulin treatment. There were no differences in markers of reactive oxygen species damage between muscles from MIRKO mice and lox/lox mice. These data support the hypothesis that the absence of insulin signalling contributes to reduced muscle mass and function though decreased protein synthesis rather than proteasomal atrophic pathways.
Keywords: Ageing, ROS, Muscle
Introduction
Resistance to insulin action in skeletal muscle is a key feature of a variety of conditions such as type 2 diabetes (Sayer et al. 2007), renal failure (Lee et al. 2007), cancer cachexia (Daneryd et al. 1995) and normal ageing (Morley 2008). All of these conditions are associated with a loss of skeletal muscle mass and impaired muscle function. This loss of muscle mass can be catastrophic for the elderly (Close et al. 2005) resulting in a substantial decrement in quality of life (Close et al. 2007). The precise mechanisms for this loss of mass and function remain unclear, and therefore, interventions to preserve muscle function remain unsuccessful (Argiles et al. 2005; Volpi et al. 2004). There is, however, growing interest into the role that insulin resistance may play in mediating age-related losses of muscle mass and function. Resistance to insulin-mediated glucose uptake in skeletal muscle is usually associated with obesity and physical inactivity although it is found independently of these factors in older individuals (Kern et al. 1992) and crucial to this hypothesis is the fact that this impairment in skeletal muscle insulin resistance is not routinely addressed or treated unless diabetes develops.
Skeletal muscle mass is determined by the balance between protein synthesis and breakdown. Accelerated muscle protein breakdown occurs in many situations such as fasting (Sandri 2008) and trauma (Long et al. 1981) as well as in other disease states associated with abnormalities in mitochondrial function (Chabi et al. 2008), aberrant production of reactive oxygen species (ROS; Reid 2008) and as a direct result of reduced anabolic hormones, particularly insulin (Rennie 2007). Insulin plays a fundamental role in regulating gene transcription of key proteins involved in muscle protein breakdown, particularly suppression of atrophy related genes known as ‘atrogenes’ via the forkhead box (FOXO) transcription factors (Nader 2005). On activation of the insulin signalling pathway, FOXO is phosphorylated by AKT leading to its sequestration from the nucleus to cytoplasm, where ubiquitination and subsequent proteasomal degradation of FOXO takes place (Kandarian and Jackman 2006). This prevents muscle protein loss by reducing the synthesis of the muscle specific ubiquitin ligases atrogin-1 and MuRF1 (Sandri et al. 2004). These two ‘atrogenes’ are the most induced genes during various models of atrophy (Bodine et al. 2001) and have been proposed as the best markers of skeletal muscle atrophy and have recently been described as ‘master genes for muscle wasting’ (Sandri 2008).
The insulin–AKT pathway also acts to increase protein synthesis, via phosphorylation of ribosomal protein S6 by mammalian target of rapamycin (mTOR). Ribosomal S6 is activated by phosphorylation downstream of the insulin signalling pathway by P70 S6K and is required for the stimulation of protein synthesis (Guillet and Boirie 2005).
There is growing evidence suggesting an intrinsic link between the development of insulin resistance and increased activities of ROS (Bonnard et al. 2008; Wei et al. 2008; Stump et al. 2006). For example, increased levels of hydrogen peroxide have been shown to inhibit the insulin signalling cascade in insulin sensitive cells, whilst increased nitric oxide production in skeletal muscle cells causes increased insulin receptor substrate 1 degradation and reduced insulin signalling (Stump et al. 2006). It has been suggested that insulin resistance may be a response to protect the cell against damage caused by an increased activities of ROS by limiting nutrient entry into the cell (Fridlyand and Philipson 2006). It has also been reported that once insulin resistance is established in skeletal muscle, this may lead to a vicious cycle of increased blood glucose levels resulting in further oxidative stress and ineffective increases in circulating insulin concentration propagating the catabolic effects on the muscle (Leverve 2003).
In a recent study by Fujita et al. (2009), it was concluded that supraphysiological hyperinsulineamia was necessary to stimulate skeletal mucle protein synthesis in glucose tolerant older adults confirming the suggestion that age-related insulin resistance may contribute to sarcopenia. However, this study did not fully expolore the mechanisms responsible for this particulary looking at signalling for protein degradation and the contribution of ROS. The present study has therefore used muscle insulin receptor knock out (MIRKO) mice (Kim et al. 2000; Bruning et al. 1998) as a model to test our hypothesis and study the effects of skeletal muscle insulin resistance on muscle structure and function, protein synthesis and degradation pathways and ROS production. Although we acknowledge that a transgenic mouse model may not be an identical replication of human muscle insulin resistance, this transgenic model should help to clarify the role of insulin resistance in sarcopenia and explore any aberrant protein synthesis and degradation leading to the development of targeted interventions. We hypothesised that skeletal muscle insulin resistance results in reduced muscle mass and reduced maximum tetanic force generation and that the decrease in maximum tetanic force generation is due to both increased production of atrogenes and aberrant ROS generation.
Research design and methods
Experimental procedures
Twelve (six males and six females) adult wild-type (lox/lox) and 12 adult (six males and six females) MIRKO-specific pathogen-free mice were examined. All mice were 4 months old and created on C57 Bl6 background. The creation of the MIRKO mice has previously been described (Bruning et al. 1998). All mice were genotyped at 3 to 4 weeks old using genomic DNA from tail biopsies (Bruning et al. 1998). The principles of laboratory animal care were followed, and all experiments were performed in accordance with UK Home Office guidelines under the UK Animals (Scientific Procedures) Act 1986.
A separate group (n = 16 lox/lox and n = 8 MIRKO) of mice (4 months old) were treated with either 1.5 mU/g body weight of human insulin in normal saline (Sigma-Aldrich, UK) via IP injection or normal saline alone and used for the analysis of insulin signalling pathways. Eight lox/lox and eight MIRKO mice were given insulin, whilst the remaining eight lox/lox mice were given saline. The injection of insulin was to prime the insulin signalling pathways, and since MIRKO mice had no insulin receptors, it was considered unethical to utilise an extra group of untreated MIRKO mice. Pilot work in our laboratory has shown no differences in insulin signalling pathways in muscles from insulin-treated MIRKO mice compared with muscles from non-treated MIRKO mice. Mice were killed 15 min post-injection, and muscles and blood were immediately removed and stored at −80°C. All experiments were performed in the morning following an overnight fast to prevent any diurnal variation.
Measurement of maximum tetanic force generation and fatigability of muscles
Mice were anaesthetised using Hypnorm and midazolam at an initial dose of 0.3 ml kg−1 and 5 mg kg−1 body mass, respectively, given IP. Additional IP doses were given as required to maintain sufficient anaesthesia such that mice did not respond to tactile stimuli. Maximum tetanic force generation and twitch characteristics of extensor digitorum longus (EDL) muscles were measured in situ as previously described (McCully and Faulkner 1985; Kayani et al. 2008).
Once maximum tetanic force had been measured, muscles were allowed to recover for 5 min and were then subjected to a fatigue protocol consisting of 60 500-ms isometric contractions, every 5 s at a stimulation frequency of 150 Hz at 8 V. Five minutes after the last isometric contraction, muscles were again electrically stimulated to contract to measure recovery. Mice were killed by overdose of anaesthetic.
Measurement of muscle mass and calculation of CSA
Following the assessment of muscle force production, mice were sacrificed and the EDL, anterior tibialis (AT) and gastrocnemius muscles were dissected and removed of any subcutaneous fat. One AT was cut in half, one section was blocked for histology, whilst the other half was used for nuclear and cytoplasmic extraction with NE-PER Nuclear and Cytoplasmic Extraction Reagents (Thermo Scientific, Rockford, IL, USA). The remaining muscles were snap-frozen in liquid nitrogen. Prior to the EDL being frozen, the muscle length was measured to the nearest 0.5 mm. All muscles were weighed frozen and the weights recorded. Cross-sectional area (CSA) and maximum specific force was calculated as previously described (Brooks and Faulkner 1988).
Total and oxidised glutathione, total protein thiol and malonaldehyde content of the gastrocnemius muscle
Gastrocnemius samples were homogenised in sulphosalicylic acid for the analysis of glutathione and total protein thiols and saline for the analysis of malonaldehyde. The automated glutathione recycling assay described by Anderson (2002), modified for use on a 96-well plate reader (Benchmark, Biorad, UK), was used to measure total and oxidised gastrocnemius glutathione content as described previously (Vasilaki et al. 2006). Protein thiol and malonaldehyde contents of the muscle were measured as previously described (Di Monte et al. 1984). All data were standardised to muscle protein content measured using the bicinchoninic acid (BCA) assay (Sigma, Poole, UK). Muscle F2-isoprostanes were measured using the methods of Roberts and Morrow (2000).
Catalase, superoxide dismutase and glutathione peroxidise activities of the gastrocnemius muscle
Gastrocnemius muscles were homogenised in 50 mM phosphate buffer, pH 7.0 for analysis of enzymes. Catalase (CAT), total superoxide dismutase (SOD) and glutathione peroxidise activities were assessed as previously described (McArdle et al. 2001). Data were expressed relative to protein concentration.
Measurement of blood glucose and plasma insulin
Blood was removed from the tail vein for the analysis of whole blood glucose and plasma insulin concentrations. Blood glucose was measured using an ‘Accu-Chek Aviva Blood Glucose Meter’ (Roche Diagnostics, Germany). Plasma was stored at −20°C for later analysis of insulin concentration using a commercial Ultra Sensitive Mouse Insulin ELISA kit (Crystal Chem, Inc., Downers Grove, IL, USA).
Histological examination
AT muscles from all mice were removed mounted on cork discs surrounded by optimal cutting temperature embedding medium (RA Lamb, East Sussex, UK) and frozen in isopentane (Sigma-Aldrich, UK). A random selection of the muscles from each group (n = 4 per group) was selected for histological examination. Five-micrometre transverse sections were cut and stained with haematoxylin and eosin, sudan black B, a modified Gömöri trichrome stain and periodic acid–Schiff stains. Sections were also analysed for ATPase (pH 9.4 and pH 4.3) to test for any fibre-type changes, succinate dehydrogenase (Pearse 1972) and cytochrome oxidase (Seligman et al. 1968) activities.
Assessment of insulin signalling pathways and atrogenes
Gastrocnemius muscles were removed from the mice that had been pre-treated with 1.5 mU/g of insulin or saline and snap-frozen in liquid nitrogen. Previous unpublished studies from our laboratory have shown that this protocol results in activation of insulin signalling pathways in wild-type mice. Gastrocnemius muscles were homogenised in 50 mM TRIS, pH 8.2, 150 mM NaCl, 1% NP-40, 1 mM iodoacetamide, 1 mM benzethonium chloride, 5.7 mM phenylmethylsulphonyl fluoride and 1× Halt Phosphatase Inhibitor Cocktail (Pierce, Rockford, IL, USA). Samples were centrifuged at 14,000×g for 10 min at 4°C and the supernatant used for subsequent experiments. Protein concentration of the supernatant was measured using BCA (Sigma Aldrich, Dorset, UK) and equal volumes of total protein (200 μg) and Laemmli buffer were boiled in a water bath for 5 min, cooled and separated by sodium dodecyl sulphate polyacrylamide gel electrophoresis (SDS-PAGE) using a 12% polyacrylamide gel. Proteins were transferred onto a nitrocellulose membrane. The muscle contents of total AKT (primary antibody 1:1,000 dilution), phosphorylated AKT (Ser 473; primary antibody 1:1,000 dilution), FOXO3a (primary antibody 1:800 dilution), phosphorylated FOXO3a (Ser 253; primary antibody 1:1,000 dilution), FOXO4 (primary antibody dilution1:1,000) and phosphorylated S6 (Ser 240/244; primary antibody 1:1,000 dilution) were analysed. Anti-rabbit IgG horseradish peroxidase-linked antibody (1:2,000 dilution) was used as the secondary antibody for all primaries. All antibodies were purchased from Cell Signalling, UK. Bands were visualised using an enhanced chemiluminescence detection system (Amersham Lifesciences, Amersham, UK) and Chemidoc image capture system with Quantity One software (Bio-Rad). One hundred micrograms of nuclear and cytoplasmic extracts was run on SDS-PAGE and analysed for FOXO3a content by Western blotting as described above. Insulin receptors were immunoprecipitated using 5 mg of total protein. Samples were incubated overnight at 4°C with insulin receptor β antibody (1:50 concentration, Cell Signalling, UK), before precipitation using protein G agarose beads (Sigma-Aldrich, UK). Samples were run on SDS-PAGE and analysed by Western blotting as described above (insulin receptor β primary antibody, 1:1,000 dilution).
RNA was extracted using Trireagent (Sigma-Aldrich, UK) and purified using RNeasy minElute cleanup kit (Qiagen, UK). The quantity of RNA was measured using a Biotech Spectrometer, and quality was assessed by a formaldehyde/agarose gel analysis. Atrogin-1 and MuRF1 mRNA content were analysed by real-time PCR (Bio-Rad, Hercules, CA, USA) using iQ SYBR Green supermix (Bio-Rad, Hercules, CA, USA) and expressed relative to glyceraldehyde 3-phosphate dehydrogenase (GAPDH) expression. A 2-fold difference in relative mRNA expression was chosen as a meaningful difference.
Primer details:
Atrogin-1 forward 5′-CTCTGTACCATGCCGTTCCT-3′
Reverse 5′-GGCTGCTGAACAGATTCTCC-3′
MuRF1 forward 5′-GACAGTCGCATTTCAAAGCA-3′
Reverse 5′-AACGACCTCCAGACATGGAC-3′
GAPDH forward 5′-CCCACTAACATCAAATGGGG-3′
Reverse 5′-TCTCCATGGTGGTGAAGACA-3′
Statistical analysis
Statistical analyses were performed using the Statistical Package for Social Sciences (Version 15.0, Surrey, UK). All data are presented as means (SE). Data were initially checked for normality using normal probability plots. Independent t tests were used to compare muscle characteristics between MIRKO and lox/lox mice. A one-way between subjects ANOVA was used to analyse changes in response to administration of exogenous insulin (Field 2005). A mixed design ANOVA was used to analyse differences in fatigability of the MIRKO mice compared with lox/lox mice. When ANOVA resulted in a significant F value, least significant difference post hoc analysis was performed to locate the differences between means. Alpha was set at P < 0.05.
Results
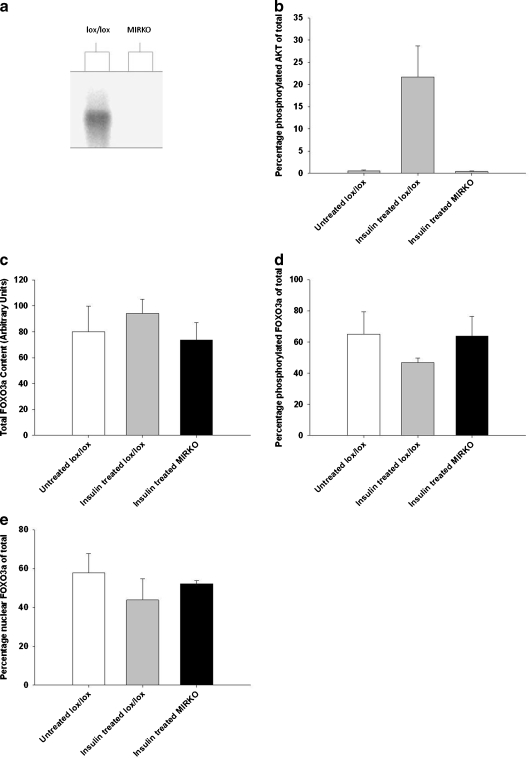
All mice were genotyped as previously described (Bruning et al. 1998) to confirm the presence of the lox and cre genes. All mice had a homozygous expression of the lox gene whilst the MIRKO mice had a heterozygous expression of the cre gene (data not shown). There was a >95% abolition of insulin receptor protein expression in muscles of MIRKO mice compared muscles of with lox/lox control mice confirming ‘knockout’ of the insulin receptor (Fig. 5a).
Fig. 5.
a Representative Western blot of immunoprecipitated insulin receptor β of the gastrocnemius muscle, b mean (SE) percentage of phosphorylated AKT (Ser 473) content of the gastrocnemius muscle, c mean (SE) total FOXO3a content of the gastrocnemius muscle, d mean (SE) phosphorylated FOXO3a (Ser 253) of the gastrocnemius muscle and e mean (SE) percentage of nuclear FOXO3a content of the AT muscle. White bars represent non-treated lox/lox mice, grey bars represent insulin-treated lox/lox mice and black bars represent insulin-treated MIRKO mice. *P < 0.05 indicates significant difference from untreated lox/lox mice
Muscle weight body mass and histological examination of muscles from lox/lox and MIRKO mice
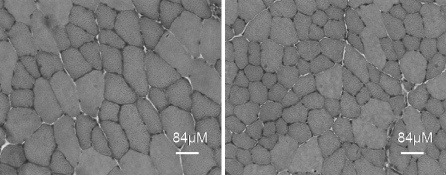
Mean muscle weights for gastrocnemius, EDL, soleus and AT muscles, cross-sectional area (CSA) of the EDL and total body mass are shown in Table 1. MIRKO mice demonstrated significantly reduced mass of the gastrocnemius (P = 0.001), AT (P = 0.001) and soleus (P = 0.003) muscles compared with lox/lox mice. There was no statistical difference in muscle mass (P = 0.082) or CSA (P = 0.06) of the EDL muscles. There were no significant differences in body mass (P = 0.272) between lox/lox and MIRKO mice. Histological examination of the AT muscle suggested that there were no gross differences in muscle fibre type, intramyocellular lipids, mitochondria, glycogen, succinic dehydrogenase and cytochrome oxidase activity in muscles of MIRKO mice compared with muscles from lox/lox mice (data not shown). The mean fibre area in AT muscles was significantly smaller (1,577 μm2 (SE 126) versus 2,814 μm2 (SE 187), P < 0.0005) in MIRKO mice compared with lox/lox mice (Fig. 1).
Table 1.
Mean (SE) skeletal muscle mass and body weight of MIRKO and lox/lox control mice
| lox/lox | MIRKO | |
|---|---|---|
| Gastrocnemius (mg) | 173 (6.4) | 136* (5.7) |
| EDL (mg) | 10.3 (0.4) | 9.3 (0.4) |
| AT (mg) | 52 (2.0) | 42* (1.5) |
| Soleus (mg) | 9.9 (0.56) | 7.3* (0.4) |
| CSAf (mg mm3) of EDL | 2.2 (0.09) | 1.96 (0.09) |
| Body mass (g) | 27 (1.0) | 25 (1.0) |
*P < 0.05
Fig. 1.
Transverse sections of AT muscles from lox/lox (left) and MIRKO (right) stained with haematoxylin and eosin to show general muscle architecture and fibre size. Bar = 80 μm
Muscle force and twitch characteristics
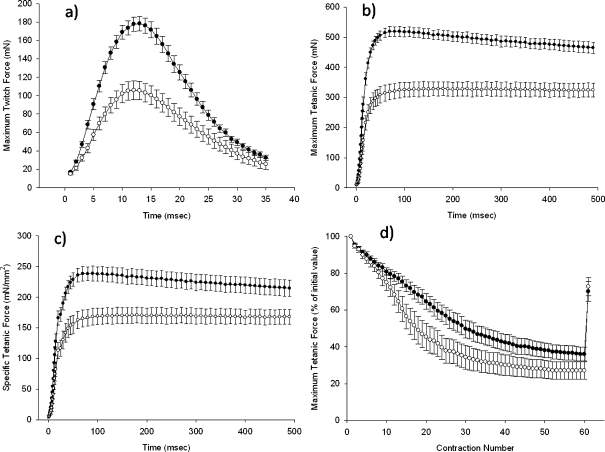
Maximum twitch and maximum and specific tetanic forces generated by EDL muscles from lox/lox and MIRKO mice are shown in Fig. 2a–c. EDL muscles from Lox/lox mice had a significantly greater maximum twitch force (P < 0.0005), maximum tetanic force (P < 0.0005) and specific tetanic force (P = 0.001) compared with those from MIRKO mice. Muscles from lox/lox mice also fatigued less than muscles from MIRKO mice demonstrated by a significant time by group interaction (P < 0.0005; Fig. 2d).
Fig. 2.
a Mean (SE) maximum twitch force of the EDL muscle, b mean (SE) maximum tetanic force for the EDL muscle, c mean (SE) specific force of the EDL muscle and d mean (SE) tetanic force as a percentage of the initial value of the EDL muscle during an in situ fatigue protocol in MIRKO and lox/lox mice. Black circles represent lox/lox mice; white circles represent MIRKO mice
Markers of oxidative damage
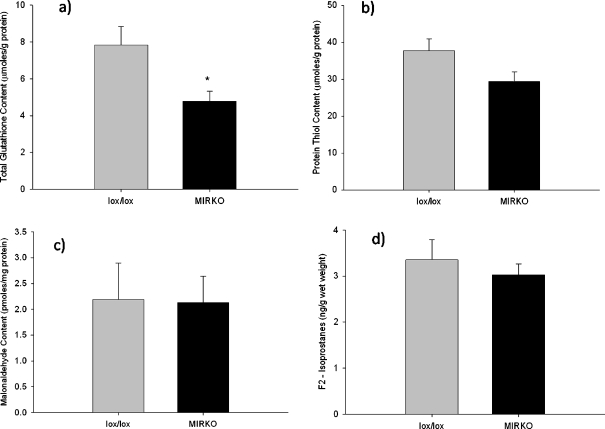
The total glutathione content (P = 0.009) of the gastrocnemius muscles from MIRKO mice was reduced compared with muscles from lox/lox mice (Fig. 3a), although there was no difference in the percentage found in the oxidised form (P = 0.82; data not shown). The redox potential of the gastrocnemius muscle from MIRKO and lox/lox mice was calculated using the Nernst equation derived from the glutathione/oxidised glutathione redox couple. The mean redox potential was −159.8 mV (SE 17.9) in muscles from lox/lox mice, compared with −141.5 mV (SE 10.2) in the muscles from MIRKO mice; this difference in mean redox potential was not statistically significant (P = 0.40).
Fig. 3.
a Mean (SE) total glutathione content of the gastrocnemius muscle, b mean (SE) total protein thiol content of the gastrocnemius muscle, c mean (SE) malonaldehyde content of the gastrocnemius muscle and d mean (SE) F2-isoprostane content of the gastrocnemius muscle. Grey bars represent lox/lox mice; black bars represent MIRKO mice. *P < 0.05 indicates significant difference from lox/lox mice
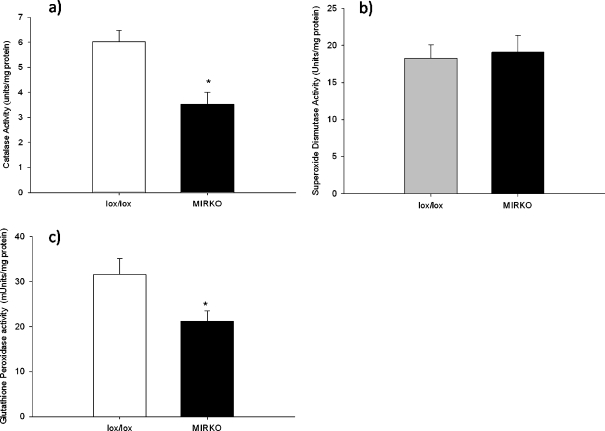
There were no significant differences in protein thiol content (P = 0.07; Fig. 3b), malonaldehyde (P = 0.99; Fig. 3c) or F2-isoprostane content (P = 0.51; Fig. 3d) of the gastrocnemius muscles between MIRKO and lox/lox mice. There was a significant decrease in CAT (P = 0.002) and glutathione peroxidase (P = 0.029) activities of muscles from MIRKO mice compared with muscles from lox/lox mice although there was no significant difference in total SOD activity (P = 0.77) between muscles from MIRKO mice compared with muscles from lox/lox mice (Fig. 4a–c).
Fig. 4.
a Mean (SE) catalase activity of the gastrocnemius muscle, b mean (SE) superoxide dismutase activity of the gastrocnemius muscle and c mean (SE) glutathione peroxidise activity of the gastrocnemius muscle. Grey bars represent lox/lox mice; black bars represent MIRKO mice. *P < 0.05 indicates significant difference from lox/lox mice
Insulin signalling
There were no significant differences in resting blood glucose or plasma insulin concentrations between MIRKO mice and lox/lox mice (glucose 5.1 mM (SE 0.3) versus 5.4 mM (SE 0.3) and insulin 0.6 ng/ml (SE 0.17) versus 0.4 ng/ml (SE 0.07), respectively) confirming the original description of these mice (Bruning et al. 1998). IP treatment of the mice with 1.5 mU/g of insulin significantly increased plasma insulin concentrations (P < 0.0005) in both MIRKO and lox/lox mice (144 ng/ml (SE 28) versus 149 ng/ml (SE 29), respectively).
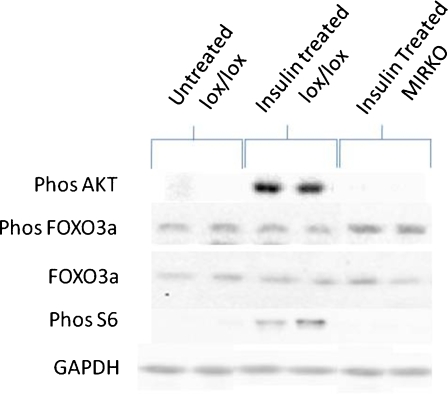
Representative Western blots can be seen in Fig. 7. There was a significant difference in the percentage of phosphorylated AKT (Ser 473) content of the gastrocnemius muscle between the three groups (P = 0.002). Post hoc analysis confirmed that AKT phosphorylation (Ser 473) was not seen in muscles from insulin-treated MIRKO mice compared with the marked increase in insulin-treated lox/lox mice (P = 0.002; Fig. 5b). There were no significant differences in total FOXO3a content of the gastrocnemius muscle between the three groups (P = 0.367; Fig. 5c) or phosphorylated FOXO3a expressed as a percent of total (P = 0.461; Fig. 5d). There was no significant difference in nuclear FOXO3a content in muscles from MIRKO mice compared with muscles from non-treated lox/lox mice and insulin-treated lox/lox mice (P = 0.617; Fig. 5e).
Fig. 7.
Representative Western blots of pAKT, total and pFOXO3a, pS6 in untreated lox/lox, insulin-treated lox/lox and insulin-treated MIRKO mice including the loading control (GAPDH)
Signalling pathways associated with protein synthesis
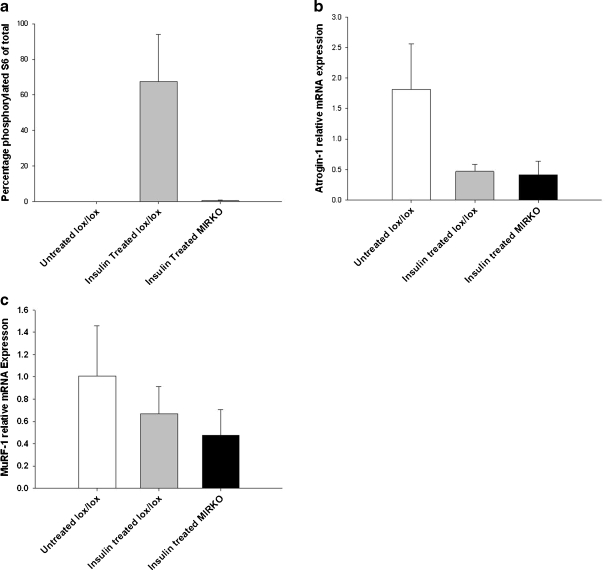
There was a significant difference in percentage of phosphorylated (Ser 240/244) ribosomal protein S6 content of the gastrocnemius muscle between the three groups (P = 0.015). Post hoc analysis confirmed that muscles from insulin-treated lox/lox mice had a significantly higher phosphorylated (Ser 240/244) ribosomal protein S6 content compared with muscles from non-treated lox/lox mice (P = 0.016) and those from insulin-treated MIRKO mice (P = 0.009; Fig. 6a).
Fig. 6.
a Mean (SE) percentage of phosphorylated (Ser 240/244) ribosomal S6 content of the gastrocnemius muscle, b mean (SE) atrogin-1 mRNA expression of the gastrocnemius muscle relative to GAPDH and c mean (SE) MuRF1 mRNA expression of the gastrocnemius muscle relative to GAPDH. White bars represent non-treated lox/lox mice, grey bars represent insulin-treated lox/lox mice and black bars represent insulin-treated MIRKO mice. *P < 0.05 indicates significant difference from untreated lox/lox mice
Ubiquitin ligases associated with atrophy
Treatment of lox/lox mice with insulin resulted in an ∼4-fold decrease in atrogin-1 mRNA relative expression of the gastrocnemius muscle compared with non-treated lox/lox mice as expected. However, there was also a ∼4.4-fold decrease in atrogin-1 relative mRNA expression in gastrocnemius muscles from MIRKO mice compared with untreated lox/lox control mice (Fig. 6b). There was also an ∼2.3-fold decrease in MuRF1 relative mRNA expression in gastrocnemius muscles from MIRKO mice compared with untreated lox/lox control mice (Fig. 6c).
Discussion
This study investigated the relationship between skeletal muscle insulin resistance and the loss of skeletal muscle mass and function using MIRKO mice and their wild-type litter mates (lox/lox). The main findings from this study were that muscles from MIRKO mice were significantly smaller than muscles from lox/lox mice and demonstrated a reduced maximum tetanic and specific force generation. Contrary to our original hypothesis, there was a statistically significant 4-fold decrease in the ubiquitin ligase atrogin-1 and a 2-fold reduction (although not statistically significant) in MuRF1 suggesting that the loss of muscle mass was not due to increased proteasomal degradation. There was, however, a failure to phosphorylate ribosomal protein S6 in response to exogenous insulin administration in muscles from MIRKO mice compared with muscles from lox/lox mice suggesting that a decrease in protein synthesis may be the primary factor contributing to the reduced muscle mass and function in insulin-resistant muscle.
Effects of the MIRKO genotype on muscle mass and force production
We have confirmed previous observations that MIRKO mice have significantly smaller muscle mass (Kim et al. 2000), and our histological examination of the AT muscle showed smaller muscle fibre size in muscles from MIRKO mice compared with lox/lox control mice. There was a significant loss of maximum tetanic force generation in muscles of MIRKO mice compared with muscles of lox/lox mice. This loss of maximum tetanic force generation may be partly due to the smaller fibre size, but there was a loss of specific force generation (force per cross sectional area), indicating that loss of muscle mass alone did not account for the reduced force generation. Lesniewski et al. (2003) previously reported a loss of specific force generation in insulin-deficient streptozocin diabetic mice, but this is the first report of loss of specific force generation in non-diabetic insulin-resistant mice. Lesniewski et al. suggested that the loss of specific force resulted in part from a defect in excitation–contraction coupling.
The present study was not designed to specifically investigate the mechanism responsible for the loss of specific force, but we found a loss in specific twitch generated by EDL muscles from MIRKO mice compared with EDL muscles from lox/lox mice suggesting that the loss of maximum tetanic force generation was not a result of metabolite depletion. Furthermore, there were no gross structural abnormalities or differences in fibre type between MIRKO and lox/lox mice. We cannot exclude the possibility that in the model used, the genetic knockout results in developmental differences and has acquired compensatory changes that might not be relevant to all acquired forms of insulin resistance. Thus, this study was primarily used to test the hypothesis that insulin resistance has an effect on muscle function, rather than directly relate it to any human deficiency or disease.
We hypothesised that insulin resistance would result in aberrant production of ROS, and therefore, muscles from MIRKO mice would demonstrate significantly increased markers of oxidative damage compared with muscles of lox/lox mice. Our data suggest that there was a relatively low level oxidation in muscles of MIRKO mice compared with muscles of lox/lox control mice, but there was no significant difference in markers of lipid peroxidation suggesting that any increase in ROS production in muscles from MIRKO mice was not sufficient to result in oxidative damage to the muscle. Therefore, it appears unlikely that oxidative stress is leading to the loss of muscle mass and function in muscles from MIRKO mice.
Potential mechanisms leading to decreased muscle mass in MIRKO mice
The present study was designed to investigate the pathways responsible for the decreased muscle fibre size. We hypothesised that muscles from MIRKO mice would be significantly smaller due to reduced phosphorylation of AKT resulting in decreased phosphorylation of FOXO and a downstream increase in atrogenes (Sandri et al. 2004). Treatment of the mice with 1.5 mU/g of human insulin resulted in a significant increase in phosphorylated AKT (Ser 473) in the lox/lox mice, whilst having no effect on muscles from MIRKO mice, confirming that the insulin signalling pathway could not been activated by insulin in MIRKO mice. Surprisingly, however, there was there no statistically significant difference in total or phosphorylated FOXO3a content or any differences in nuclear FOXO3a content between muscles from MIRKO and lox/lox mice, whilst there was a statistically significant ∼4-fold decrease in atrogin-1 mRNA and a ∼2-fold (albeit not statistically significant) decrease in MuRF1 mRNA in muscles from MIRKO mice. These data indicate that the decrease in muscle size and function in MIRKO mice is not due to an increase in atrogin-1 and MuRF1 via FOXO transcription. The present study did not make any direct measure of protein synthesis, and the interpretation of these data is based upon changes in atrogene mRNA expression. However, these two atrogenes are always induced during catabolic conditions, and their induction precedes muscle atrophy (Sandri 2008).
The decreased expression of atrogenes in muscles of MIRKO mice could reflect a survival mechanism in an attempt to preserve skeletal muscle mass in insulin-resistant muscle, although this suggestion is purely speculative. It is also possible that the autophagic/lysosomal pathway of skeletal muscle atrophy may be upregulated in muscles of MIRKO mice compared with lox/lox mice. Recent work (Mammucari et al. 2007; Zhao et al. 2008) has demonstrated that autophagy plays a key role in skeletal muscle atrophy stimulated by decreased PI3K–AKT signalling through mTOR (Zhao et al. 2008). It is therefore possible that despite a decrease in FOXO3a-dependent transcription, autophagy could be increased directly through decreased PI3K-AKT signalling. Future studies should investigate the autophagy pathway further.
Cuthbertson et al. (2005) reported that the major factor causing loss of muscle mass in ageing-related muscle atrophy is a reduction in protein synthesis rates. These researchers related this decreased protein synthesis to a decreased intramuscular expression and activation (phosphorylation) of signalling proteins. The present study reports a failure to phosphorylate ribosomal S6 in response to exogenous insulin treatment in muscles from MIRKO mice compared with lox/lox control mice. S6 is phosphorylated and thus activated by insulin via mTOR, which plays an important role in translation and protein synthesis. This lack of response of ribosomal protein S6 to insulin in MIRKO mice suggests that a decrease in protein synthesis may provide an explanation for the reduced muscle mass seen in MIRKO mice (Fig. 7).
Whilst the present data are exciting and provide greater insight into the potential mechanisms responsible for age-related loss of muscle mass and function, it must be stressed that these data were generated in a transgenic mouse model and future studies must now be undertaken to confirm these findings in aged human muscle. However, these data may provide further information leading to the development of targeted interventions, particularity aimed at increasing protein synthesis, ultimately attenuating the catastrophic loss of muscle mass and function observed in aged individuals.
Summary and conclusions
In conclusion, the present study supports the hypothesis that insulin resistance in non-diabetic mice results in a significant loss of muscle mass and function. Given that a loss of muscle mass and function is a major cause of skeletal muscle frailty and that ageing is associated with an increase in resistance to insulin (Morley 2008), these data suggest that treatment of insulin resistance could help preserve muscle function in older individuals. These data also demonstrate that the loss of muscle force in MIRKO mice cannot be solely attributable to the reduced muscle mass suggesting that insulin resistance may result in functional neuronal deficits or altered excitation–contraction uncoupling.
The second major finding of the present study is that the reduced muscle mass observed in muscles from MIRKO mice compared with lox/lox control mice is not a result of activation of atrophy pathways, and it is more likely that the reduction in muscle mass is a result of decreased protein synthesis. Consequently, targeted interventions aimed at increasing protein synthesis could be more useful than those inhibiting degradation pathways to optimally preserve muscle mass and function in older individuals.
Acknowledgements
The authors would like to thank Dr. Anna Kayani and Dr. Lea Zibrik from the Pathophysiology group at The University of Liverpool for their assistance with the PCR, Dr. Daniel Cuthbertson for his assistance in the preparation of the manuscript, Research into Ageing for their continued financial support and the Oxidative Stress Core of the Nathan Shock Center for Excellence in Basic Biology of Aging, Grant, AG 13319 (HVR).
References
- Anderson ME. Glutathione. In: Punchard NA, Kelly FJ, editors. Free radicals—a practical approach. Oxford: Oxford University Press; 2002. [Google Scholar]
- Argiles JM, Busquets S, Felipe A, Lopez-Soriano FJ. Molecular mechanisms involved in muscle wasting in cancer and ageing: cachexia versus sarcopenia. Int J Biochem Cell Biol. 2005;37:1084–1104. doi: 10.1016/j.biocel.2004.10.003. [DOI] [PubMed] [Google Scholar]
- Bodine SC, Latres E, Baumhueter S, Lai VK, Nunez L, Clarke BA, Poueymirou WT, Panaro FJ, Na E, Dharmarajan K, Pan ZQ, Valenzuela DM, Dechiara TM, Stitt TN, Yancopoulos GD, Glass DJ. Identification of ubiquitin ligases required for skeletal muscle atrophy. Science. 2001;294:1704–1708. doi: 10.1126/science.1065874. [DOI] [PubMed] [Google Scholar]
- Bonnard C, Durand A, Peyrol S, Chanseaume E, Chauvin MA, Morio B, Vidal H, Rieusset J. Mitochondrial dysfunction results from oxidative stress in the skeletal muscle of diet-induced insulin-resistant mice. J Clin Invest. 2008;118:789–800. doi: 10.1172/JCI32601. [DOI] [PMC free article] [PubMed] [Google Scholar]
- Brooks SV, Faulkner JA. Contractile properties of skeletal muscles from young, adult and aged mice. J Physiol. 1988;404:71–82. doi: 10.1113/jphysiol.1988.sp017279. [DOI] [PMC free article] [PubMed] [Google Scholar]
- Bruning JC, Michael MD, Winnay JN, Hayashi T, Horsch D, Accili D, Goodyear LJ, Kahn CR. A muscle-specific insulin receptor knockout exhibits features of the metabolic syndrome of NIDDM without altering glucose tolerance. Mol Cell. 1998;2:559–569. doi: 10.1016/S1097-2765(00)80155-0. [DOI] [PubMed] [Google Scholar]
- Chabi B, Ljubicic V, Menzies KJ, Huang JH, Saleem A, Hood DA. Mitochondrial function and apoptotic susceptibility in aging skeletal muscle. Aging Cell. 2008;7:2–12. doi: 10.1111/j.1474-9726.2007.00347.x. [DOI] [PubMed] [Google Scholar]
- Close GL, Kayani A, Vasilaki A, McArdle A. Skeletal muscle damage with exercise and aging. Sports Med. 2005;35:413–427. doi: 10.2165/00007256-200535050-00004. [DOI] [PubMed] [Google Scholar]
- Close GL, Haggan P, McArdle A. Skeletal muscle aging. Rev Clin Gerontol. 2007;17:13–23. doi: 10.1017/S0959259808002360. [DOI] [Google Scholar]
- Cuthbertson D, Smith K, Babraj J, Leese G, Waddell T, Atherton P, Wackerhage H, Taylor PM, Rennie MJ. Anabolic signaling deficits underlie amino acid resistance of wasting, aging muscle. Faseb J. 2005;19:422–424. doi: 10.1096/fj.04-2640fje. [DOI] [PubMed] [Google Scholar]
- Daneryd P, Hafstrom L, Svanberg E, Karlberg I. Insulin sensitivity, hormonal levels and skeletal muscle protein metabolism in tumour-bearing exercising rats. Eur J Cancer. 1995;31A:97–103. doi: 10.1016/0959-8049(94)00344-5. [DOI] [PubMed] [Google Scholar]
- Monte D, Bellomo G, Thor H, Nicotera P, Orrenius S. Menadione-induced cytotoxicity is associated with protein thiol oxidation and alteration in intracellular Ca2+ homeostasis. Arch Biochem Biophys. 1984;235:343–350. doi: 10.1016/0003-9861(84)90207-8. [DOI] [PubMed] [Google Scholar]
- Field A. Discovering statistics using SPSS for windows. 2. London: Sage; 2005. [Google Scholar]
- Fridlyand LE, Philipson LH. Reactive species, cellular repair and risk factors in the onset of type 2 diabetes mellitus: review and hypothesis. Curr Diabetes Rev. 2006;2:241–259. doi: 10.2174/157339906776818541. [DOI] [PubMed] [Google Scholar]
- Fujita S, Glynn EL, Timmerman KL, Rasmussen BB, Volpi E. Supraphysiological hyperinsulinaemia is necessary to stimulate skeletal muscle protein anabolism in older adults: evidence of a true age-related insulin resistance of muscle protein metabolism. Diabetologia. 2009;52:1889–1898. doi: 10.1007/s00125-009-1430-8. [DOI] [PMC free article] [PubMed] [Google Scholar]
- Guillet C, Boirie Y. Insulin resistance: a contributing factor to age-related muscle mass loss? Diabetes Metab. 2005;31(Spec No 2):5S20–5S26. doi: 10.1016/S1262-3636(05)73648-X. [DOI] [PubMed] [Google Scholar]
- Kandarian SC, Jackman RW. Intracellular signaling during skeletal muscle atrophy. Muscle Nerve. 2006;33:155–165. doi: 10.1002/mus.20442. [DOI] [PubMed] [Google Scholar]
- Kayani AC, Close GL, Jackson MJ, McArdle A. Prolonged treadmill training increases HSP70 in skeletal muscle but does not affect age-related functional deficits. Am J Physiol Regul Integr Comp Physiol. 2008;294:R568–R576. doi: 10.1152/ajpregu.00575.2007. [DOI] [PubMed] [Google Scholar]
- Kern M, Dolan PL, Mazzeo RS, Wells JA, Dohm GL. Effect of aging and exercise on GLUT-4 glucose transporters in muscle. Am J Physiol. 1992;263:E362–E367. doi: 10.1152/ajpendo.1992.263.2.E362. [DOI] [PubMed] [Google Scholar]
- Kim JK, Michael MD, Previs SF, Peroni OD, Mauvais-Jarvis F, Neschen S, Kahn BB, Kahn CR, Shulman GI. Redistribution of substrates to adipose tissue promotes obesity in mice with selective insulin resistance in muscle. J Clin Invest. 2000;105:1791–1797. doi: 10.1172/JCI8305. [DOI] [PMC free article] [PubMed] [Google Scholar]
- Lee SW, Park GH, Lee SW, Song JH, Hong KC, Kim MJ. Insulin resistance and muscle wasting in non-diabetic end-stage renal disease patients. Nephrol Dial Transplant. 2007;22:2554–2562. doi: 10.1093/ndt/gfm204. [DOI] [PubMed] [Google Scholar]
- Lesniewski LA, Miller TA, Armstrong RB. Mechanisms of force loss in diabetic mouse skeletal muscle. Muscle Nerve. 2003;28:493–500. doi: 10.1002/mus.10468. [DOI] [PubMed] [Google Scholar]
- Leverve X. Hyperglycemia and oxidative stress: complex relationships with attractive prospects. Intensive Care Med. 2003;29:511–514. doi: 10.1007/s00134-002-1629-3. [DOI] [PubMed] [Google Scholar]
- Long CL, Birkhahn RH, Geiger JW, Blakemore WS. Contribution of skeletal muscle protein in elevated rates of whole body protein catabolism in trauma patients. Am J Clin Nutr. 1981;34:1087–1093. doi: 10.1093/ajcn/34.6.1087. [DOI] [PubMed] [Google Scholar]
- Mammucari C, Milan G, Romanello V, Masiero E, Rudolf R, Piccolo P, Burden SJ, Lisi R, Sandri C, Zhao J, Goldberg AL, Schiaffino S, Sandri M. FoxO3 controls autophagy in skeletal muscle in vivo. Cell Metab. 2007;6:458–471. doi: 10.1016/j.cmet.2007.11.001. [DOI] [PubMed] [Google Scholar]
- McArdle A, Pattwell D, Vasilaki A, Griffiths RD, Jackson MJ. Contractile activity-induced oxidative stress: cellular origin and adaptive responses. Am J Physiol Cell Physiol. 2001;280:C621–C627. doi: 10.1152/ajpcell.2001.280.3.C621. [DOI] [PubMed] [Google Scholar]
- McCully KK, Faulkner JA. Injury to skeletal muscle fibers of mice following lengthening contractions. J Appl Physiol. 1985;59:119–126. doi: 10.1152/jappl.1985.59.1.119. [DOI] [PubMed] [Google Scholar]
- Morley JE. Diabetes and aging: epidemiologic overview. Clin Geriatr Med. 2008;24:395–405. doi: 10.1016/j.cger.2008.03.005. [DOI] [PubMed] [Google Scholar]
- Nader GA. Molecular determinants of skeletal muscle mass: getting the “AKT” together. Int J Biochem Cell Biol. 2005;37:1985–1996. doi: 10.1016/j.biocel.2005.02.026. [DOI] [PubMed] [Google Scholar]
- Pearse AG. Histochemistry, theoretical and applied. Baltimore: Williams and Wilkins; 1972. [Google Scholar]
- Reid MB. Free radicals and muscle fatigue: Of ROS, canaries, and the IOC. Free Radic Biol Med. 2008;44:169–179. doi: 10.1016/j.freeradbiomed.2007.03.002. [DOI] [PubMed] [Google Scholar]
- Rennie MJ. Exercise- and nutrient-controlled mechanisms involved in maintenance of the musculoskeletal mass. Biochem Soc Trans. 2007;35:1302–1305. doi: 10.1042/BST0351302. [DOI] [PubMed] [Google Scholar]
- Roberts LJ, Morrow JD. Measurement of F(2)-isoprostanes as an index of oxidative stress in vivo. Free Radic Biol Med. 2000;28:505–513. doi: 10.1016/S0891-5849(99)00264-6. [DOI] [PubMed] [Google Scholar]
- Sandri M. Signaling in muscle atrophy and hypertrophy. Physiology (Bethesda) 2008;23:160–170. doi: 10.1152/physiol.00041.2007. [DOI] [PubMed] [Google Scholar]
- Sandri M, Sandri C, Gilbert A, Skurk C, Calabria E, Picard A, Walsh K, Schiaffino S, Lecker SH, Goldberg AL. Foxo transcription factors induce the atrophy-related ubiquitin ligase atrogin-1 and cause skeletal muscle atrophy. Cell. 2004;117:399–412. doi: 10.1016/S0092-8674(04)00400-3. [DOI] [PMC free article] [PubMed] [Google Scholar]
- Sayer AA, Syddall HE, Dennison EM, Martin HJ, Phillips DI, Cooper C, Byrne CD. Grip strength and the metabolic syndrome: findings from the Hertfordshire Cohort Study. QJM. 2007;100:707–713. doi: 10.1093/qjmed/hcm095. [DOI] [PMC free article] [PubMed] [Google Scholar]
- Seligman AM, Karnovsky MJ, Wasserkrug HL, Hanker JS. Nondroplet ultrastructural demonstration of cytochrome oxidase activity with a polymerizing osmiophilic reagent, diaminobenzidine (DAB) J Cell Biol. 1968;38:1–14. doi: 10.1083/jcb.38.1.1. [DOI] [PMC free article] [PubMed] [Google Scholar]
- Stump CS, Henriksen EJ, Wei Y, Sowers JR. The metabolic syndrome: role of skeletal muscle metabolism. Ann Med. 2006;38:389–402. doi: 10.1080/07853890600888413. [DOI] [PubMed] [Google Scholar]
- Vasilaki A, Mansouri A, Remmen H, Meulen JH, Larkin L, Richardson AG, McArdle A, Faulkner JA, Jackson MJ. Free radical generation by skeletal muscle of adult and old mice: effect of contractile activity. Aging Cell. 2006;5:109–117. doi: 10.1111/j.1474-9726.2006.00198.x. [DOI] [PubMed] [Google Scholar]
- Volpi E, Nazemi R, Fujita S. Muscle tissue changes with aging. Curr Opin Clin Nutr Metab Care. 2004;7:405–410. doi: 10.1097/01.mco.0000134362.76653.b2. [DOI] [PMC free article] [PubMed] [Google Scholar]
- Wei Y, Chen K, Whaley-Connell AT, Stump CS, Ibdah JA, Sowers JR. Skeletal muscle insulin resistance: role of inflammatory cytokines and reactive oxygen species. Am J Physiol Regul Integr Comp Physiol. 2008;294:R673–R680. doi: 10.1152/ajpregu.00561.2007. [DOI] [PubMed] [Google Scholar]
- Zhao J, Brault JJ, Schild A, Goldberg AL. Coordinate activation of autophagy and the proteasome pathway by FoxO transcription factor. Autophagy. 2008;4:378–380. doi: 10.4161/auto.5633. [DOI] [PubMed] [Google Scholar]


