

Abstract
We report an alternative approach to transcriptome sequencing for the Illumina Genome Analyzer, in which the reverse transcription reaction takes place on the flowcell. No amplification is performed during the library preparation, so PCR biases and duplicates are avoided. Since the template is poly A+ RNA rather than cDNA, the resulting sequences are necessarily strand-specific. The method is compatible with paired- or single-ended sequencing.
Analysis of complementary DNA by Next-Generation sequencing (RNA-seq) enables us to build an accurate picture of active transcriptional patterns within an organism 1. The ideal RNA-seq protocol would be accurate, strand-specific, quantitative across a wide dynamic range, compatible with paired-end sequencing, and would detect antisense transcripts unambiguously 2,3. Some, but not all, of these requirements are met by existing methodologies.
Neither polydeoxythymine priming nor random hexamer priming yield the strand-specific information that is essential for comprehensive annotation of the transcriptome 4 and identification of antisense transcription 5,6. Consequently, several strand-specific approaches to RNA-seq have been developed 3,7-11, and with the exception of Helicos’ ‘Direct RNA Sequencing’ approach 3, in each case the cDNA is amplified by the polymerase chain reaction (PCR), an inherently biased procedure 12. PCR-amplified libraries can have reduced complexity compared to the total mRNA pool, because different fragments tend to amplify with unequal efficiency. This causes drop-out of some RNA species, and excessive amplification of others – such PCR duplicates are difficult to distinguish from genuinely abundant RNA species. To overcome these limitations, it is preferable to avoid library amplification altogether 3,13.
Here we report an RNA-seq approach for the Illumina Genome Analyzer in which reverse transcription takes place on the flowcell surface (‘FRT-seq’; Supplementary Fig. 1, Supplementary Table 1 and Methods). The method is strand-specific, amplification-free, compatible with paired-end sequencing, and avoids any ambiguities that might arise from the addition of non-templated nucleotides by the reverse transcriptase 14: in our method, these will occur at the 3′ end of the adapter sequence and are therefore not sequenced.
To evaluate the performance of reverse transcriptase in the flowcell environment, we exploited the ability of this enzyme to use DNA as well as RNA as a template, and performed first strand synthesis on a PCR-amplified PhiX DNA library (Illumina, USA, cat no CT-901-1001). We then completed cluster generation and sequencing following the standard protocols. We calculated sequence coverage in ten-base bins, and compared it to that obtained from the same library following the standard protocol, in which Taq polymerase performs first strand synthesis. The two enzymes performed similarly (Supplementary Fig. 2a). We then divided the PhiX genome (mean % G+C = 44.7%) into low (< 44.7%) and high (> 44.7%) % G+C bins and calculated Spearman correlations between sequence coverage and % G+C for both bins using window sizes from 20 to 210 bp, at 10 bp intervals (Supplementary Table 2). We found a moderate positive correlation for both enzymes with the low % G+C bin, indicating underrepresentation of low % G+C sequences in the mapped sequence data, and a much weaker correlation at high % G+C. The correlation at low % G+C was stronger for Taq polymerase than for reverse transcriptase. Additionally, we found a moderate negative correlation between coverage difference for the two enzymes and % G+C content (Supplementary Table 2 and Supplementary Fig. 2b). Together, this confirms that the reverse transcriptase is no less efficient at seeding clusters than Taq polymerase. There was no discernible difference in the % of reads mapping to the PhiX genome, or in the read quality of the sequences produced with either enzyme (data not shown).
We prepared two FRT-seq libraries using a human placental poly A+ RNA sample (Clontech, USA, cat. no. 636103), and prepared one paired end flowcell for each library. We sequenced each for 2 × 37 cycles on an Illumina Genome Analyzer, generating 3.3 and 3.5 Gb of sequence. For comparison we prepared two standard RNA-seq libraries from the same sample, using Illumina’s random priming protocol, and generated 1.6 Gb and 0.5 Gb of sequence. We mapped all reads to annotated genes from the ENSEMBL 15 database, normalized read counts and calculated Pearson correlations between libraries and between all lanes (Supplementary Table 3). FRT-seq was highly reproducible, with a Pearson correlation of 0.993 between the datasets obtained from separate libraries (Fig. 1). Correlations between individual lanes from the same FRT-seq library were close in value to this figure (0.998-1.000), indicating that the slight discrepancy that exists is due to sampling bias, rather than stochastic systematic biases in the library preparation and RT reactions. The correlation between standard RNA-seq libraries was very high between lanes from the same library (approximately 1.000), but lower between libraries (0.866), presumably reflecting stochastic amplification biases incurred during the library preparation PCR (Supplementary Fig. 3a-f). The comparatively poor technical reproducibility is not necessarily representative of the Illumina standard RNA-seq library preparation method per se, but indicates that care must be taken to ensure consistent results throughout the library preparation. Alternative approaches to RNA-seq have been reported 8,11, in which very good technical reproducibility was demonstrated (Pearson correlations = 0.98-0.99), but against which our FRT-seq method still compares favorably.
Figure 1. Correlation plots for FRT-seq libraries.
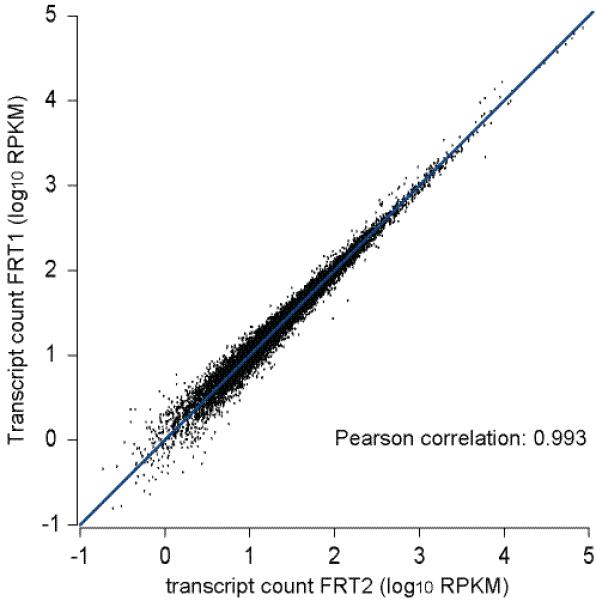
We plotted sequence data obtained from two FRT libraries prepared from the same poly A+ RNA sample. All reads were mapped to annotated genes from the ENSEMBL database, normalized read counts and calculated Pearson correlations between the libraries. RKPM = reads per kilobase of sequence per million reads.
The percentage of duplicate reads is low for the FRT-seq libraries (6.1 % and 7.2 % for libraries FRT1 and FRT2 respectively; Supplementary Table 4), but is higher and varies appreciably between standard libraries (94.1 % and 39.7 % for libraries STD1 and STD2 respectively). Regardless of the causative mechanism, duplicate sequences will be more prevalent for more abundant transcripts. Calculating the frequency of positions at which one or more duplicate sequences are observed, we obtained 2.2 % for each FRT-seq library and 74.2 % and 13.9 % for standard RNA-seq libraries respectively. The fragmentation methods are identical between standard and FRT-seq libraries, indicating that the observed difference in duplication frequency between library types is largely due to PCR bias.
To evaluate the influence of template % G+C on read depth, we divided sequences obtained by both methods into bins of % G+C, for the entire mapped fragment. Sequences generated by the PCR-based standard method appear to be biased away from lower % G+C towards a more neutral % G+C, compared to the FRT-seq data (Supplementary Fig. 4a, b). This mirrors the effect of PCR on genomic DNA 12.
For both methods, we assessed the evenness of sequence coverage along the length of genes, both in their entirety (Supplementary Fig. 5a, b) and across individual exons (Supplementary Fig. 5c-g). Representation was observed to be more even in the FRT-seq libraries compared to standard libraries.
To determine how closely the FRT-seq data correlated with microarray-derived expression data, we ran the poly A+ RNA sample on Human Expression BeadChips (Illumina) in triplicate, and compared the results to transcript counts obtained from FRT-seq and standard RNA-seq libraries (Supplementary Fig. 6). The Pearson correlation between transcription levels derived from array data and those obtained from FRT-seq (0.676) was substantially better than between array data and standard RNA-seq library (0.482), indicating that FRT-seq is the more quantitative approach. Correlations between individual RNA-seq libraries and array data differed slightly, reflecting differences in library quality (0.423 and 0.493 for libraries STD1 and STD2 respectively), whereas those between libraries FRT1 and FRT2 were in close agreement (0.676 and 0.674 respectively). These correlations are lower than has been reported previously for standard libraries 16. The arrays used in our study, Illumina HumanWG-6 v3 Expression BeadChips, were designed to detect mainly the 3′ end of transcripts, whereas the FRT-seq data represents their entirety, making the two types of data difficult to normalize, and hindering direct comparison. Additionally, the background signal of arrays may contribute to the failure of sequence and array data to correlate perfectly 16. Nevertheless, our results reveal that PCR amplification bias is a major cause of discordance between array and sequence data. Tables of called genes and read counts from both FRT-seq and standard libraries are available at ftp://ftp.sanger.ac.uk/pub/transseq
Sequences obtained using FRT-seq are necessarily strand-specific. To demonstrate this, we mapped all reads to the NCBI build 36 version of the human genome and created forward and reverse strand .wig files, for viewing in the Integrated Genome Browser (IGB, http://www.affymetrix.com/partners_programs/programs/developer/tools/igbsource_terms.affx; Fig. 2). The majority of reads produced by FRT-seq mapped with +− orientation, the first read corresponding to the sense strand and the second read corresponding to the antisense strand. For the standard, non-directional libraries, reads map to both strands with similar frequency (Supplementary Figures 7a, b and Supplementary Table 5).
Figure 2. Strand specificity of FRT-seq.
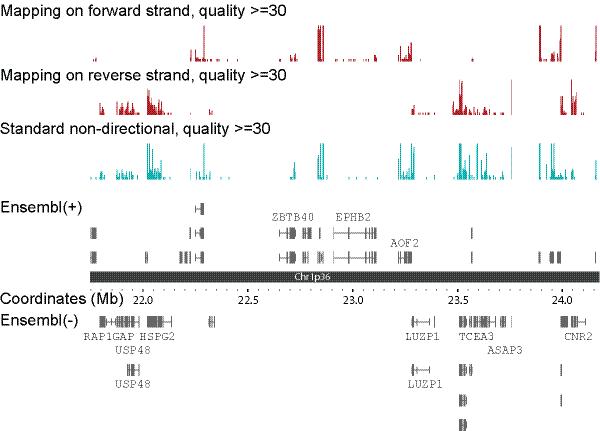
Sequences generated by FRT-seq were mapped against the human genome,. .wig files are displayed in IGB, though the colours were modified for clarity (dark red). For comparison, sequences made using the standard RT-seq library preparation protocols and flowcell amplification are also shown (blue). Below is a representation of the region of human chromosome 1p36, and beneath this genes are shown in Ensembl together with the strands from which the transcript is produced.
An appreciable percentage of reads mapped in the −+ orientation (2.55%), compared to the gene annotation. This is the least likely combination to arise from chimaerism, but would be expected for antisense transcripts. The value is highly consistent between the different libraries and between different lanes within the same library. Approximately 40 % of sequences mapping within the 1 kb upstream regions are in the antisense orientation, compared to < 3 % overall, indicating significant enrichment of antisense reads in the promoter regions (2-tailed p < 0.0001, Fisher’s exact test), consistent with their being genuine antisense transcripts 6 (Supplementary Table 6).
A reasonably high proportion of sequences mapped to intergenic regions, both for FRT-seq and standard RNA-seq libraries. When FRT-seq was performed on zebrafish ovary poly A+ RNA, mapping to Zv8, very few intergenic sequences were evident (Supplementary Figure 8). It is possible that the commercial human placental poly A+ RNA sample may have been contaminated with DNA or unspliced RNA, or that the human gene annotations in the ENSEMBL database are incomplete 16.
To conclude, FRT-seq enables amplification-free RNA-seq, and generates sequences that are strand-specific and compatible with paired end sequencing, presents no opportunity for the formation of intermolecular priming artifacts. We anticipate that this method will prove to be the method of choice for transcriptome sequencing in the future.
Supplementary Material
Acknowledgements
The authors would like to thank N. Bason and M. Quail for performing the standard RNA-seq library prep, J. Burton for coordinating the sequencing of standard RNA-seq libraries and J. Ule and M. Wollerton for advice on RNA ligation. This work was supported by the Wellcome Trust grant number [WT079643].
Accession number for sequence data
The sequence data from this study have been submitted to European Nucleotide Archive (http://www.ebi.ac.uk/embl) under accession no. [ERA000198].
Appendix
Methods
Fragmentation
We fragmented 250ng of a human placental poly A+ RNA (Clontech, USA, cat. no. 636103) by metal ion hydrolysis (Ambion, TX, USA), ethanol precipitated, and dephosphorylated non-specifically using Antarctic phosphatase (New England Biolabs Inc, MA, USA).
3′ adapter ligation
We ligated an adapter onto the 3′ end of the RNA using T4 RNA ligase 1 (New England Biolabs Inc, MA, USA). This adapter matched the Illumina reverse PCR primer 17 in sequence but consisted of 20 RNA nucleotides at the 5′ terminus, and the remaining bases were DNA nucleotides. The adapter was phosphorylated at the 5′ end, and blocked by dideoxy cytosine at the 3′ end (Supplementary Information).
To remove excess adapter, we ran ligation products in a denaturing acrylamide gel, retaining the portion of the gel containing oligonucleotides larger than the adapter, and discarding the portion containing oligonucleotides equal to or smaller than the adapter. We then extracted oligonucleotides from the gel.
5′ adapter ligation and cleanup
We phosphorylated templates at the 5′ (unligated) ends using polynucleotide kinase (New England Biolabs Inc, MA, USA), and ligated on a 5′ adapter. This adapter matched the Illumina forward PCR primer 17 in sequence, and had a similar composition to the 3′ adapter described above (Supplementary Information). We cleaned the fully ligated product using SPRI beads (Agencourt Bioscience Corporation, MA, USA).
Product validation and quantification
We quantified the library using a Bioanalyzer 2100 RNA chip (Agilent Technologies Inc, CA, USA), following the manufacturer’s protocol.
Reverse transcription and sequencing
We reverse transcribed ligated RNA libraries on an Illumina flowcell, in a manner that is analogous to the first strand synthesis of DNA templates, but using reverse transcriptase (Invitrogen, CA, USA), and performed the cluster amplification and sequencing reactions following the manufacturer’s recommended protocol for standard templates. We prepared a reverse transcriptase buffer mix in a total volume of 2.0 ml (1 x SuperScript II RT buffer (Invitrogen), 0.017M DTT, 2M betaine (Sigma)).
We filtered this buffer through a 0.2 μm filter and collected it in a 15 ml Falcon tube. We then added 187.5 μl 40 U / μl RNaseOut (Invitrogen) and mixed thoroughly. We pipetted 90μl into each tube in an 8-tube strip labeled D and stored at 4 °C until needed.
Next, we prepared 1120 μl of reverse transcriptase enzyme mix (1058.4 μl reverse transcriptase buffer mix from preceding step, 1 U / μl SuperScript II reverse transcriptase (Invitrogen), 500μM dNTP mix (Illumina)). We pipetted 140 μl into each tube of an 8-tube strip labeled E and stored at 4 °C until needed.
iii) Cluster station steps
We pipetted 140 μl Illumina Hybridisation Buffer (HT1) into each tube of an 8-tube strip labeled A, and pumped through a paired end flowcell with AspirationRate = 60, Volume = 120.
We diluted RNA libraries to 500 pM (based on Agilent Bioanalyzer 2100 RNA chip quantification) using Illumina Hybridization Buffer (HT1) and pipetted 90 μl to each tube of an 8-tube strip labeled B. We pumped this through the flowcell with following conditions: i) TempRamp Temperature = 96, Rate = 1; ii) Pump Reagent with AspirationRate = 15, Volume = 75; iii) Pump Reagent with AspirationRate = 100, Volume = 10; iv) Wait Duration = 30000; v) TempRamp Temperature = 40, Rate = 0.05
We pipetted 140 μl of Illumina Wash Buffer (HT2) into each tube of an 8-tube strip labeled C, and pumped through the flowcell with following conditions: i) Pump Reagent with AspirationRate = 15, Volume = 75; ii) TempRamp Temperature = 42, Rate = 1
We pumped the reverse transcriptase buffer mix (prepared above, and labeled D) through the flowcell with AspirationRate = 15, Volume = 70
We pumped the reverse transcriptase enzyme mix (prepared above, and labeled E) through the flowcell with: i) Pump Reagent with AspirationRate = 60, Volume = 95; ii) TempRamp Temperature = 42, Rate = 1; iii) Wait Duration = 500000; iv) Pump Reagent with AspirationRate = 15, Volume = 10; v) Wait Duration = 440000; vi) Pump Reagent with AspirationRate = 15, Volume = 10; vii) Wait Duration = 440000; vii) Pump Reagent with AspirationRate = 15, Volume = 10; viii) Wait Duration = 440000 ix) Pump Reagent with AspirationRate = 15, Volume = 10 x) Wait Duration = 440000; xi) Pump Reagent with AspirationRate = 15, Volume = 10; xii) Wait Duration = 440000; xiii) TempRamp Temperature = 70, Rate = 1; xiv) Wait Duration = 900000; xv) TempRamp Temperature = 37, Rate = 1
We pipetted 150 μl 0.1N NaOH into each tube of an 8-tube strip labeled F and pumped through the flowcell with following conditions: i) Pump Reagent with AspirationRate = 15, Volume = 120; ii) TempRamp Temperature = 37, Rate = 1
We pipetted 150μl TE pH8.0 into each tube of an 8-tube strip labeled G and pumped through the flowcell with following conditions: i) Pump Reagent with AspirationRate = 15, Volume = 120; ii) TempRamp Temperature = 37, Rate = 1
We then removed the hybridization manifold, connected an amplification manifold and followed the rest of the standard Illumina amplification recipe without changes. All other procedures were performed following Illumina’s recommended protocols.
Read Mapping
We filtered read pairs for polyN and polyA sequences, and mapped to both the human genome sequence (assembly NCBI36) and a non-redundant set of Ensembl gene sequences with corresponding RefSeq entries (downloaded from BioMART 18). We mapped read pairs using MAQ 19, and removed those where either or both reads in the pair failed to map. We imposed a mapping score cut-off of 30.
Expression arrays
We amplified, in triplicate, 12.5ng human placental Poly(A) RNA using the Illumina TotalPrep™-96 RNA Amplification Kit (Applied Biosystems, CA, USA) according to the manufacturer’s instructions. We applied 1500 ng biotinylated cRNA to an Illumina HumanWG-6 v3 Expression BeadChip (Illumina, CA, USA) for each replicate and hybridized overnight at 58 °C. We washed, detected and scanned chips according to the manufacturer’s instructions. We imported scanner output files into BeadStudio software (Illumina, CA, USA) and output non-normalized, probe-level data text files for further analysis.
We vst transformed and quantile normalized data 20 in Bioconductor (http://www.bioconductor.org) using the Lumi (http://www.bioconductor.org/packages/2.0/bioc/html/lumi.html) and Limma 21 packages. Expressed genes were called where the microarray probe reported a brightness above background in all three replicates (detection threshold p-value = 0.05). We united probes with the companion gene annotation using the Annotate package (http://www.bioconductor.org/packages/release/bioc/html/annotate.html).
Standard RNA-seq libraries
We produced standard libraries in accordance with Illumina’s RNA-seq V3.5 protocol.
Sequenced Transcriptome analysis
We normalized the number of read pairs mapping per gene by gene length and number of reads in the run, yielding a value of reads per Kb of coding sequence per million mapped reads RPKM. Additionally, we transformed and normalized data a second time by the same method used to generate the microarray data, for the microarray correlation analyses.
Correlation Analysis
We computed lane to lane Pearson correlations from lane RPKM values and lane to microarray Pearson correlations from vsn transformed 22, quantile normalized values for both data.
References
- 17.Bentley DR, et al. Nature. 2008;456:53–59. doi: 10.1038/nature07517. [DOI] [PMC free article] [PubMed] [Google Scholar]
- 18.Smedley D, et al. BMC Genomics. 2009;10:22. doi: 10.1186/1471-2164-10-22. [DOI] [PMC free article] [PubMed] [Google Scholar]
- 19.Li H, Ruan J, Durbin R. Genome Res. 2008;18:1851–1858. doi: 10.1101/gr.078212.108. [DOI] [PMC free article] [PubMed] [Google Scholar]
- 20.Yang YH, et al. Nucleic Acids Res. 2002;30:e15. doi: 10.1093/nar/30.4.e15. [DOI] [PMC free article] [PubMed] [Google Scholar]
- 21.Smyth GK. Stat Appl Genet Mol Biol. 2004;3 doi: 10.2202/1544-6115.1027. Article3. [DOI] [PubMed] [Google Scholar]
- 22.Huber W, von Heydebreck A, Sultmann H, Poustka A, Vingron M. Bioinformatics. 2002;18(Suppl 1):S96–104. doi: 10.1093/bioinformatics/18.suppl_1.s96. [DOI] [PubMed] [Google Scholar]
Footnotes
Competing interests
The authors declare competing financial interests: TWBO is an Illumina employee, shareholder and share option holder.
AOP
By using a reverse transcriptase for the bridge amplification step on the Illumina Genome Analyzer RNA conversion to cDNA and sequencing take place directly in the flowcell and yield highly accurate strand specific sequences.
Issue
By using a reverse transcriptase for the bridge amplification step on the Illumina Genome Analyzer RNA conversion to cDNA and sequencing take place directly in the flowcell and yield highly accurate strand specific sequences.
References
- 1.Wang Z, Gerstein M, Snyder M. RNA-Seq: a revolutionary tool for transcriptomics. Nat Rev Genet. 2009;10:57–63. doi: 10.1038/nrg2484. [DOI] [PMC free article] [PubMed] [Google Scholar]
- 2.Wu JQ, et al. Systematic analysis of transcribed loci in ENCODE regions using RACE sequencing reveals extensive transcription in the human genome. Genome Biol. 2008;9:R3. doi: 10.1186/gb-2008-9-1-r3. [DOI] [PMC free article] [PubMed] [Google Scholar]
- 3.Ozsolak F, et al. Direct RNA sequencing. Nature. 2009;461:814–818. doi: 10.1038/nature08390. [DOI] [PubMed] [Google Scholar]
- 4.David L, et al. A high-resolution map of transcription in the yeast genome. Proc Natl Acad Sci U S A. 2006;103:5320–5325. doi: 10.1073/pnas.0601091103. [DOI] [PMC free article] [PubMed] [Google Scholar]
- 5.Carninci P, et al. The transcriptional landscape of the mammalian genome. Science. 2005;309:1559–1563. doi: 10.1126/science.1112014. [DOI] [PubMed] [Google Scholar]
- 6.Katayama S, et al. Antisense transcription in the mammalian transcriptome. Science. 2005;309:1564–1566. doi: 10.1126/science.1112009. [DOI] [PubMed] [Google Scholar]
- 7.Lister R, et al. Highly integrated single-base resolution maps of the epigenome in Arabidopsis. Cell. 2008;133:523–536. doi: 10.1016/j.cell.2008.03.029. [DOI] [PMC free article] [PubMed] [Google Scholar]
- 8.Cloonan N, et al. Stem cell transcriptome profiling via massive-scale mRNA sequencing. Nat Methods. 2008;5:613–619. doi: 10.1038/nmeth.1223. [DOI] [PubMed] [Google Scholar]
- 9.Croucher NJ, et al. A simple method for directional transcriptome sequencing using Illumina technology. Nucleic Acids Res. 2009 doi: 10.1093/nar/gkp811. [DOI] [PMC free article] [PubMed] [Google Scholar]
- 10.He Y, Vogelstein B, Velculescu VE, Papadopoulos N, Kinzler KW. The antisense transcriptomes of human cells. Science. 2008;322:1855–1857. doi: 10.1126/science.1163853. [DOI] [PMC free article] [PubMed] [Google Scholar]
- 11.Parkhomchuk D, et al. Transcriptome analysis by strand-specific sequencing of complementary DNA. Nucleic Acids Res. 2009;37:e123. doi: 10.1093/nar/gkp596. [DOI] [PMC free article] [PubMed] [Google Scholar]
- 12.Kozarewa I, et al. Amplification-free Illumina sequencing-library preparation facilitates improved mapping and assembly of (G+C)-biased genomes. Nat Methods. 2009;6:291–295. doi: 10.1038/nmeth.1311. [DOI] [PMC free article] [PubMed] [Google Scholar]
- 13.Lipson D, et al. Quantification of the yeast transcriptome by single-molecule sequencing. Nat Biotechnol. 2009;27:652–658. doi: 10.1038/nbt.1551. [DOI] [PubMed] [Google Scholar]
- 14.Chen D, Patton JT. Reverse transcriptase adds nontemplated nucleotides to cDNAs during 5′-RACE and primer extension. Biotechniques. 2001;30:574–580. 582. doi: 10.2144/01303rr02. [DOI] [PubMed] [Google Scholar]
- 15.Hubbard TJ, et al. Ensembl 2009. Nucleic Acids Res. 2009;37:D690–697. doi: 10.1093/nar/gkn828. [DOI] [PMC free article] [PubMed] [Google Scholar]
- 16.Marioni JC, Mason CE, Mane SM, Stephens M, Gilad Y. RNA-seq: an assessment of technical reproducibility and comparison with gene expression arrays. Genome Res. 2008;18:1509–1517. doi: 10.1101/gr.079558.108. [DOI] [PMC free article] [PubMed] [Google Scholar]
Associated Data
This section collects any data citations, data availability statements, or supplementary materials included in this article.