

Abstract
The carboxylate side chains of Asp and Glu have significant coupling with the amide states of the backbone of Villin headpiece. In two dimensional spectroscopy, cross peaks are observed between these side chains and the main amide-I band. To model the absorption of the side chains, the electric field variations of vibrational frequencies of a carboxylic acid group (neutral form, CH3-COOH), and a carboxylate group (ionized form, CH3-COO-) are parametrized by means of DFT calculations. Simulations indicate that the side-chains significantly couple to only one or two amide-I modes out of all the amino acid residues which makes them useful as spectroscopic markers, providing information about the local structural behavior of the protein. Both experiment and simulations show that the cross peaks between the carboxylate and amide-I bands are significantly diminished above the melting temperature.
1. Introduction
It has been recognized for some time that the vibrational modes of the peptide units of proteins are sensitive indicators of secondary structure. In particular the amide-I mode, which is approximately a backbone carbonyl vibration, is highly degenerate and delocalized in polypeptides such that important aspects of the topology of the structure are often clearly manifested in the infrared spectrum. The delocalization is commonly understood to arise from electrostatic interactions that have sufficient range to sense secondary structure over useful distances. The introduction of two dimensional infrared (2D-IR) methods has permitted the direct experimental examination of these presumed electrostatic couplings between amide units thereby enlarging the scope and sharpening interpretations of vibrational spectroscopy as a structural indicator. The delocalization of the vibrations in proteins critically depends on the near degeneracy of the backbone modes at different residues. However there are also carbonyl-like vibrations associated with side chains which are nearby in frequency and are therefore expected to participate in the delocalization and to extend the plausible interpretations of spectra. In this paper we directly examine by means of 2D-IR and theory the side chain carboxylic acid modes and their coupling to the backbone states of a small protein, Villin Headpiece (HP35).
Since the 2D-IR method has intrinsically broad bandwidth it promises a new view of the time dependent changes in local and global structural features that occur during folding or unfolding. The Villin Headpiece was chosen for the present study because it is a small, 35 residue, naturally occurring protein.1-3 In addition it belongs in the group having the fastest known folding kinetics,4,5 and it has been suggested to utilize one of the simplest protein folding mechanisms.6 Its conformational dynamics is grounded in many types of experiments and theoretical models.6 Therefore Villin presents an excellent opportunity for 2D spectroscopy to contribute to the knowledge of protein structural evolution, especially since its relative simplicity suggests that the experiments could be directly simulated by molecular dynamics. The HP35 contains three small helices and a hydrophobic core7. The sequence contains two aspartic acid and two glutamic acid residues. The pKa of these ionizable side chains is greatly influenced by their interaction with the surrounding environment.8 The 2D-IR spectra of HP35 including these ionizable residues and the interaction of their vibrations with the backbone amide-I states are the focus of the present work.
Isotope editing techniques combined with 2D-IR, where the amide-I transition frequency is modified by substituting 12C =16O by 13C=16O or 13C=18O, have often been used to simplify complex systems with many overlapping transitions.9-11 This approach permits spectral selection of particular residues and provides site specific information regarding protein backbone states. However, isotope edited transition frequencies of the backbone occur at frequencies that are very similar to those of the carboxylate side chain vibrations. The present 2D-IR work investigates the interaction of the carboxylate side chains with the backbone amide states of HP35, focusing on the effect of these ionizable groups on the spectra. The results show that the interactions between the side chains and the amide-I band provide information about the local structure of the protein and suggests the use of these carboxylate side chains as naturally occurring spectroscopic probes with which to study the protein conformational dynamics. However the carboxylate infrared transitions are not as well understood as amide-I modes so a detailed theoretical study of them is also needed to establish their utility as probes.
Experimental and theoretical studies of the infrared absorption of the aliphatic mono-acids and di-acids,12,13 salicylic acid and its derivatives,14 cyanoacetic acid,15 sodium acetate16 and several other acids17 have been reported. Many experimental studies12-14,17 have verified there is a pH dependent infrared absorption. At low pH, one absorption band is in the range 1700-1730 cm-1 (C=O stretch region) and another is in the range 1200-1250 cm-1 (C-OH bending). At high pH, the IR absorption is dramatically changed. One band is observed in the 1550-1650 cm-1 frequency range, corresponding to the asymmetric COO- vibration. The symmetric stretch of the carboxylate is observed in the range 1300-1450 cm-1. A linear correlation between the asymmetric vibration frequency and the pKa of the acids have been reported.12,13 In order to model the absorption of the side chains, we have parametrized the vibrational frequencies of the carboxylic acid group (neutral form, R-COOH), and the carboxylate group (ionized form, R-COO-) by means of DFT calculations on acetic acid CH3-COOH. MD simulations of the Villin headpiece in folded and unfolded states are then carried out with the results being used to simulate their IR and 2D-IR spectra including both the amide-I backbone and carboxylic acid vibrational states.
2. Materials and Methods
Sample Preparation
Villin headpiece (HP35), consisting of 35 amino acids and having the sequence LSDEDFKAVFGMTRSAFANLPLWKQQNLKKEKGLF was synthesized by Biomer Technologies (Hayward, CA). A double labeled peptide isotopomer, containing the isotopic amide carbonyl label 13C=16O at Ala57 and 13C=18O at Ala59 was synthesized along with the unlabeled HP35. The peptides were dissolved in D2O to obtain a concentration of approximately 10 mM. HCl (NaOH) was added to a phosphate buffer solution (pH = 5.7) to attain the acidic (basic) pH used in the experiements. Finally these buffer solutions were lypholized and dissolved in D2O. The sample contained some residual trifluoroacetic acid (TFA) from the peptide purification. CD spectrum obtained for the sample solution containing residual TFA in neat D2O showed a melting temperature (Tm) of 70° C which is the same within experimental errors with the reported Tm of 70.5° C for Villin headpiece.18
Linear IR Spectroscopy
The FTIR absorption spectra were recorded at 1 cm-1 resolution on a Perkin-Elmer 2000 Explorer spectrometer in a temperature controllable cell with CaF2 windows and a path length of 56 μm.
Two-Dimensional IR Spectroscopy
The multidimensional IR spectra were obtained using heterodyned spectral interferometry with the laser arrangement described previously.6-8 Three Fourier-transform limited 75 fs pulses (wave-vectors k1, k2 and k3) with energy of ca 400 nJ each were incident on the sample. The signal in the phase matching direction −k1+k2+k3 was detected by heterodyning it with a local oscillator (LO) pulse, which preceded the signal pulse by ~1500 fs. The time interval between the first and the second pulse is denoted as the coherence time τ, that between the second and the third pulse is denoted as the waiting time T, and that between the third pulse and the detected signal is denoted as t. The rephasing and nonrephasing sequences correspond to k1 arriving earlier or later than than k2 respectively. The signal and the LO were combined at the focus of the monochromator (with a groove density 50 lines/mm) and the heterodyned signal created was detected by a 64-element HgCdTe array detector. Each detector element is 200 μm in width and 1 mm in height. The experimental raw data collected in this procedure was in the form of a two dimensional array of time (in 2 fs steps) and wavelength (in ~15 nm steps). To obtain the absorptive or correlation spectra, rephasing and nonrephasing 2D frequency spectra were added. The detailed protocols of data processing have been described previously.19
MD simulation of villin headpiece subdomain
Simulations were carried out using available structure of recombinant form of HP-361,20 which contains a supplementary Met residue on the N-terminal side. We verified that this amino-acid does not influence the overall structure of the peptide. The amide vibration close to the N-terminus of the peptide (located between Met and the Leu residues) is not included in the 2D-IR simulation. Two series of MD simulations were conducted: one for the folded and one for the unfolded state. There were performed using the NAMD 2.6 program21 with the CHARMM27 force field22 and periodic boundary conditions with a 2 fs time step. Long-range electrostatic interactions were computed using particle-mesh Ewald (PME)23,24 and a real space cutoff of 12 Å was used for nonbonded interactions. Langevin dynamics with a 1 ps-1 damping coefficient were used to achieve a constant temperature. 1 atm constant-pressure was maintained using a Nose-Hoover Langevin piston25,26 with a decay period of 200 fs and a 100 fs damping time, when pressure regulation was employed.
Folded state simulation
The Folded-Ionized (FI) simulation was initiated from the HP-36 NMR minimized average structure2 (Protein DataBank indentification number 1VII). The peptide, with all side chains ionized, is embedded in a 52 Å box containing 4650 water molecules and 2 chloride ions to neutralize the box. After minimization and 5 ns equilibration using the NPT ensemble at the temperature 300 K, an NVT simulation was performed, with snapshots recorded every 2 fs for 250 ps.
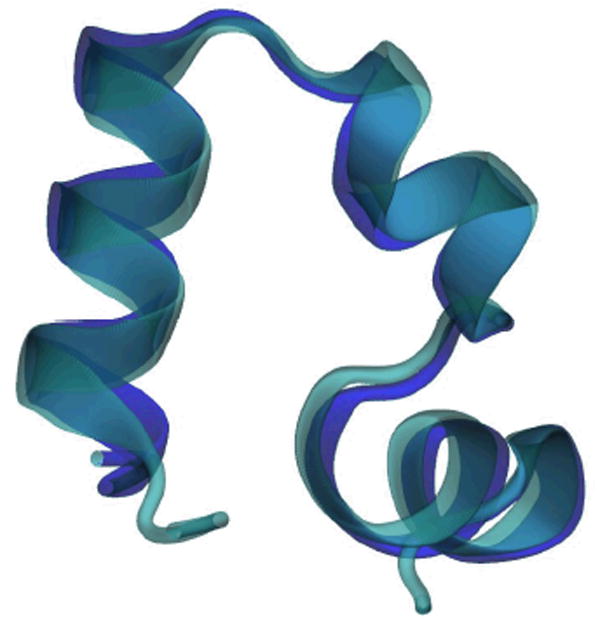
For comparison we have generated a similar simulation starting from the mutant HP-35 X-ray structure7 (Protein Data Bank identification number 1yrf). In this mutant, the ASN residue N68 is replaced by HIS. The HP35 and HP36 sequences both converge to a similar structure as seen from the average structures in Figures 1 and 6. The average Cα RMSD from the NMR structure including residues 42 to 76 is 1.95 Å for HP-35 and 1.88 Å for HP-36.
Figure 1. The structure of Villin headpiece (HP35).
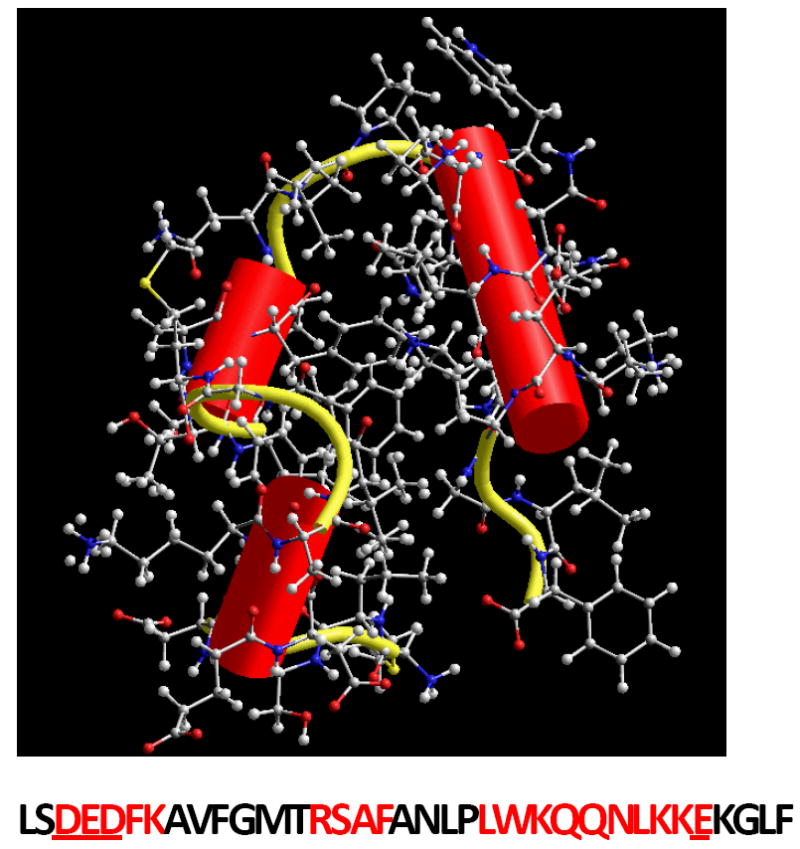
The residues forming the helices are marked in red and four amino acid residues with ionizable side chains are underlined (Data from Protein DataBank indentification number 1VII).
Figure 6. Superposition of HP35 (Purple) and HP36 (Cyan) average structure.
In a second simulation, the Folded-Neutral state (denoted herein by FN) initiated from the NMR structure, the side chains of the glutamic and aspartic acid residues D44, E45, D46 and E72 and the terminal carboxylate group l (F76) were replaced by their neutral acid forms. The peptide is embedded in a 52 Å box containing 4691 water molecules and 7 chloride ions. After minimization and equilibration, an MD simulation was performed for 250 ps.
Unfolded state simulation
The Unfolded-Ionized (UI) simulation was initiated using the FI trajectory. We have performed a high temperature simulation of the Villin headpiece by heating to 800 K for 5 ns. Ten snapshots were selected along this trajectory at 500 ps intervals and each were equilibrated at 358 K during 1 ns to obtain ten 250 ps length trajectories of the unfolded state denoted here as Unfolded-Ionized (UI).
Electronic structure computations
DFT calculations were performed at the B3LYP/aug-cc-pVDZ level using the GAUSSIAN 03 software package.27 Calculations employed the molecular frame defined on Figure 7. The coordinates are centered at the carbonyl carbon atom, the X axis is defined along the C=O bond and the XY plane coincides with the COO plane. After optimization of the structure, the carbonyl harmonic frequency of acetic acid was found to be 1808 cm-1. This value is 20 cm-1 higher than the observed value (1788 cm-1).20 It is acceptable considering the anharmonic shifts of similar vibrational modes (amide-I: -16 cm-1, gas-phase CO molecule -27 cm-1).
Figure 7. Molecular frames.
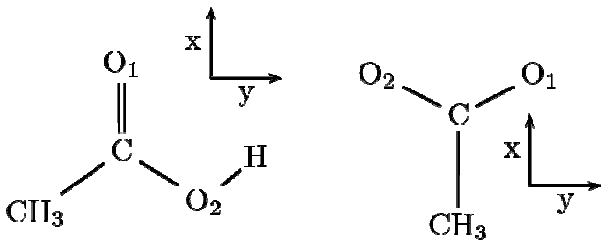
Acetic acid (left) and acetate (right) molecules and the corresponding molecular frame used in the DFT calculations.
3. Experimental Results
Linear IR Spectra
The FTIR spectrum of unlabeled Villin headpiece (HP35) in D2O shows an amide-I band in the region 1620 – 1660 cm-1 and another sharp peak at 1674 cm-1 due to TFA (see sample section). Two broad but less intense bands were observed as shoulders in the regions 1560-1600 cm-1 and 1700-1730 cm-1 (see Figure 2). The line shape parameters of the peak at 1674 cm-1 are obtained separately by fitting the linear IR spectrum of neat TFA in D2O. Fitting the linear spectrum of HP35 in D2O with three Gaussian profiles along with the line shape parameters obtained for the TFA peak yields the relative cross-sections of 0.2 and 0.1 for the bands at 1560-1600 cm-1 and 1700-1730 cm-1, relative to the amide-I band. The FTIR spectrum of the isotopically double labeled HP35 shows a 20% increase in cross-section in the region 1560-1600 cm-1 compared with that of the unlabeled compound.
Figure 2. Experimental linear IR spectra.
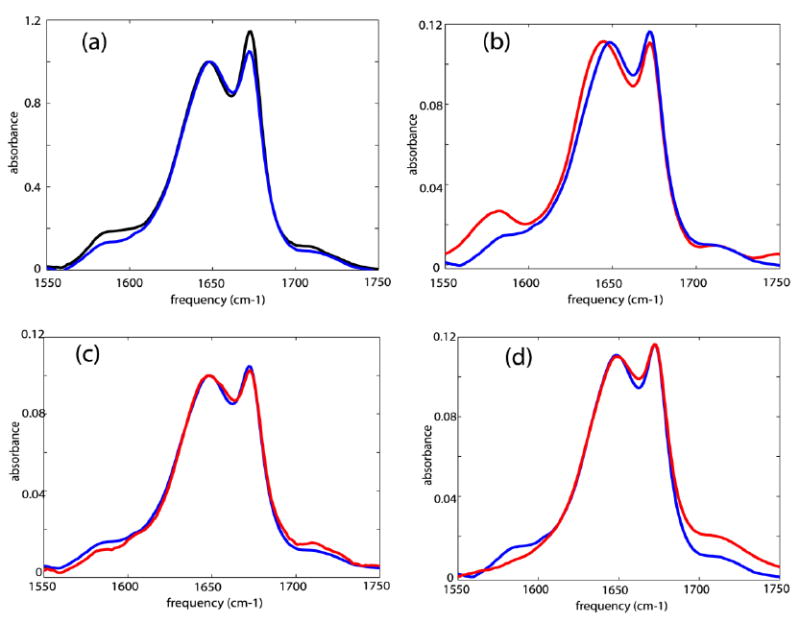
Linear IR spectra of: (a) unlabeled HP35 (blue) and double labeled HP35(black) in neat D2O; (b) unlabeled HP35 in D2O (blue) and at pD ~11.0 (red); (c) unlabeled HP35 in D2O (blue) and at pD ~3.0 (red); and (d) unlabeled HP35 in D2O (blue) and at pD ~1.0 (red).
The linear spectrum of the unlabeled HP35 at pD~11.0 showed an increase in cross-section at 1560-1600cm-1 as compared with the neutral solution (Figure 2). At pD~3.0, there was a slight weakening of the lower frequency broad shoulder and a small increase in absorption above 1700 cm-1 as compared with the neutral solution. This broad band 1560-1600cm-1 was less intense for the unlabeled compound at pD~1.0 as compared with the spectrum in neat D2O. At pD~1.0 an increased cross section at ~1700-1730 cm-1 was observed. The broad band at 1560-1600 cm-1 was one-third the cross section at pD ~1.0 compared with neat D2O.
Two-Dimensional IR Spectra
The 2D-IR spectrum of unlabeled HP35 in D2O at room temperature, shown in Figure 4(a), has pairs of diagonal peaks with each consisting of a v = 0 → v = 1 transition on the diagonal and v = 1 → v = 2 transition shifted along the horizontal axis by the diagonal anharmonicity. The amide-I transition region consists of two clearly distinguishable bands, at 1630 and 1643 cm-1. A diagonal peak at 1674 cm-1 corresponds to the sharp band from TFA. Less intense (~20% of that of the peak at 1643 cm-1) diagonal peaks were observed around 1660 and 1615 cm-1. Overlapping transitions were observed along the diagonal outside the amide-I’ region in the frequency region 1560-1590 cm-1. An enlarged view of these diagonal peaks is shown in Figure 4(b): cross-peaks between them and the amide-I band are observed. The occurrence and the shapes of these cross peaks are shown in figure 4(c). As seen in Figure 4(c), the cross peaks are clearly distinguishable though the diagonal peaks in the same region overlap on one another (Figure 4(b)). A main objective of the theory will be to explain the origin of the cross peaks shown in Figure 4 (c). Cross peaks were also observed between the side chain COOH and the TFA as shown in Figure 4(d).
Figure 4. 2D-IR spectra of Villin headpiece at 23° C.
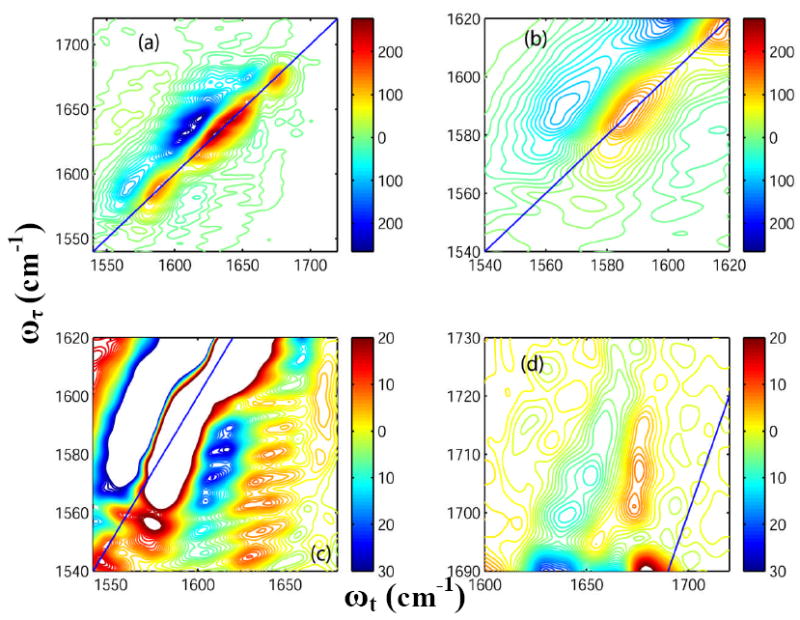
Real part of the absorptive 2D-IR spectrum of HP35 in neat D2O (T = 0) at 23° C focusing on: (a) the whole frequency range for the carbonyl stretches; (b) the diagonal peaks from Asp and Glu ionizable side chains; (c) the cross peaks arising due to the coupling between the ionizable side chains and the main amide-I bands; and (d) the cross peaks arising between the COOH side chain of Asp and Glu and the TFA.
Temperature Dependence of FTIR
The difference FTIR spectra of unlabeled HP35 (Figure 3) at each temperature were obtained by subtraction of the absorbance at the lowest temperature (0°C). Figure 3 shows a decrease in the cross section in the range of 1610-1655 cm-1 and an increase of cross section in the range 1655-1750 cm-1 with the increase in temperature. The decrease in the cross section at 1655-1750 cm-1 identifies two underlying components as marked in Figure 3.
Figure 3. Difference infrared spectra of Villin headpiece (HP35).
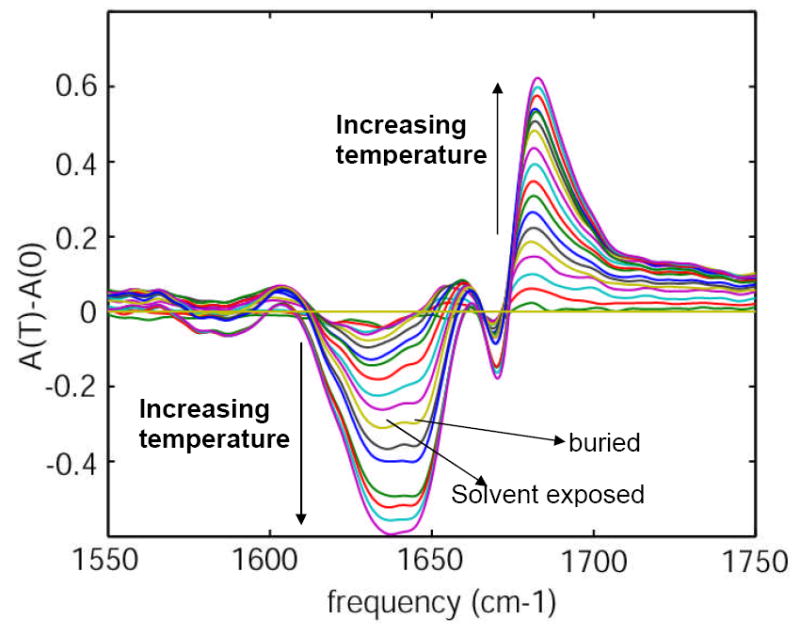
Difference FTIR spectra of unlabeled HP35 as a function of temperature, in the range 0-90 °C in 5° increments.
Figure 5(a) shows the 2D-IR spectrum of HP35 at 85°C. The temperature increase causes a 60% decrease in the signal amplitude for the transitions at 1630 and 1643 cm-1. New pairs of diagonal peaks are observed at 1680 and 1690 cm-1(Figure 4(a)) at the higher temperature. The ratio of the signal amplitude of the peak at 1680 cm-1 to that at 1690 cm-1 is 0.33. A cross peak can also be clearly seen between these two transitions. The intensity of the peak at 1660 cm-1 increases with temperature (it becomes ~50% of that of the peak at 1643 cm-1 at 85°C). Details of different regions of this spectrum are displayed in Figure 5 for comparison with the room temperature 2D-IR spectra as shown in Figure 4. The intensity of the overlapping diagonal peaks in the frequency region 1560-1590 cm-1 shown in Figure in Figure 4(b) was decreased to 50% of that at room temperature by heating to 85 C. The cross peaks originating from the carboxylate side chains and amide –I’ show a ~ 50% decrease in intensity at 85°C compared with the room temperature spectrum (see Figure 4(c)). A 50% increase in intensity is observed for the cross peaks between the side chain COOH and TFA at around 1700-1730 cm-1 (Figure 4(d)) and the diagonal peak at 1674 cm-1 from residual TFA decreases by 30% in signal amplitude on heating.
Figure 5. 2D-IR spectra of Villin headpiece at 85° C.
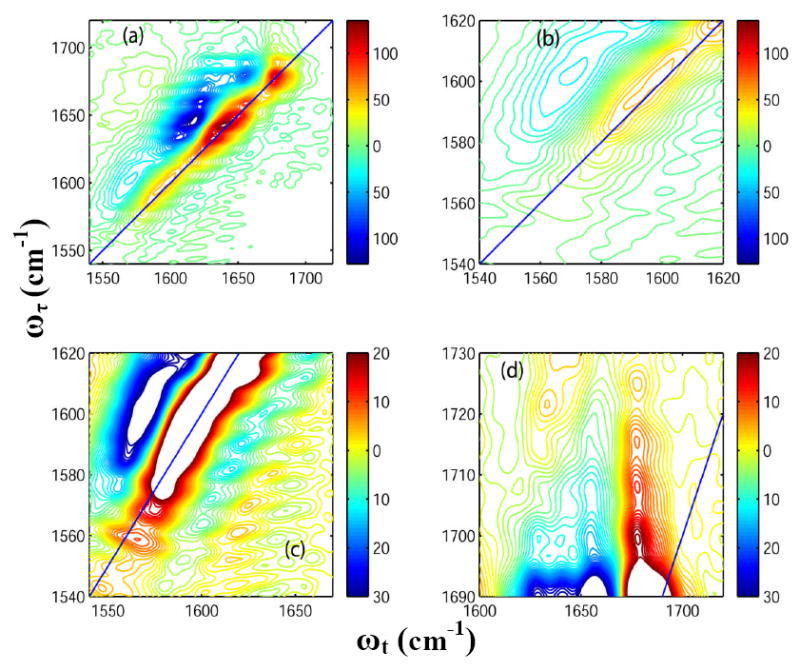
Real part of the absorptive 2D-IR spectrum of HP35 in neat D2O (T = 0) at 85°C focusing on: (a) the whole frequency range for the carbonyl stretches; (b) the diagonal peaks from Asp and Glu ionizable side chains; (c) the cross peaks arising due to the coupling between the ionizable side chains and the main amide-I bands; and (d) the cross peaks arising between the COOH side chain of Asp and Glu and the TFA.
4. Discussion of experimental results
The amide-I band is primarily composed of two components, one from the carbonyl groups buried in the hydrophobic core (~1645 cm-1) and the other from the carbonyls that are solvent exposed (~1630 cm-1). The presence of these two bands composing the main amide-I peak were confirmed from the temperature dependent difference FTIR spectrum, which shows the growth of two distinct negative difference peaks in the range 1610 – 1655 cm-1 with increase in temperature as seen in Figure 3. No secondary structural units in peptides and proteins are reported to have amide-I transitions below 1600 cm-1. Thus the broad absorption at ~1560-1600 cm-1 was considered to be associated with side chain transitions of the amino acids. The carboxylate groups of aspartic (D) and glutamic (E) acids are reported28 to have transitions at 1584 and 1567 cm-1 respectively in D2O. A symmetric stretching mode (CN3H5+) of arginine (R) has been reported to be near 1581-1586 cm-1. These are the only reports that we have located concerning transitions of amino acid side chains in the range 1560-1600 cm-1. The increase in cross section of the peak in the 1560-1600 cm-1 region of HP35 at pD~11.0 confirmed the fact that this broad band is not likely to be associated with arginine. A small decrease in the cross section in the region 1560 – 1600 cm-1 at pD~3.0, along with a small increase in the region above 1700 cm-1 (carbonyl stretch of the carboxylic acid side chain) occurred on lowering the pD to 3.0. This result is consistent with the transitions at 1560-1600 cm-1 being from the carboxylate side chains. An ionizable side chain in a protein usually adopts a charge determined by its standard pKa (3.9 and 4.3 for Asp and Glu respectively). However, the pKa of an ionizable group in a protein is greatly influenced by its geometry and its interaction with the surrounding environment. When the pD was further decreased to 1.0, a distinct decrease in cross section was observed at 1560-1600 cm-1, confirming the fact that the broad transition in the region 1560 – 1600 cm-1 is associated with the carboxylate side chains of Asp and Glu. Moreover, the increase in cross section in the region ~1700-1730 cm-1 is consistent with the shift of the COO- + H+ <=> COOH equilibrium towards COOH. This assignment is consistent with the calculations of Scherega et al29 who found that Asp44, Glu45 and Asp46 of the Villin headpiece (HP36) displayed a significantly different average degree of charge from that predicted from the standard pKa. This broad IR absorption arising from the carboxylate groups of the amino acid side chains has not been reported previously. Its frequency range overlaps with that expected for the amide-I transition region of the 13C=16O and 13C=18O isotope edited amino acids.
The carboxylate transition region of the difference FTIR spectrum appears to be composed of overlapping bands, so it was natural to use 2D-IR spectroscopy in an attempt to simplify their interpretation.
The 2D-IR experimental results in this paper focus on the unlabeled compound. The 2D-IR spectrum of unlabeled VH35 shows cross peaks between the carboxylate side chains and the main amide-I bands (see Figures 4). The frequencies on along ωτ of the string of cross peaks near ωt = 1740 cm-1 indicate that they are arising from four diagonal peaks at frequencies at 1589, 1581, 1574 and 1564 cm-1. These peaks are not seen directly in the diagonal traces. Careful data analysis confirms that the cross peaks between the carboxylates and the amide-I band are from coupling. These cross peaks between the carboxylates and main amide-I band are clearly visible both in the absorptive and the rephasing (echo) spectra. The cross peak locations are shifted to lower frequencies by about 2 cm-1 in the photon echo spectra as a result of line shape distortion but otherwise form an identical pattern to that seen in the absorptive spectra and shown on Figure 4(c). As reported by Barth et al28, the carboxylate side chain transitions from Asp and Glu are expected at 1584 and 1567 cm-1 respectively in D2O. The peak frequencies depend strongly on the environment of the individual amino acids. Theoretical calculations by Scherega et al29 showed the ionizable groups of the two Asp’s in HP35 to have an average charge of ~ -1.0 at pD =3.7, whereas the charges on Glu45 and Glu72 are ~ -0.5 and ~ -0.2 respectively. The 2D-IR spectrum shows the diagonal peaks at 1589 and 1581 cm-1 to be more intense than those at 1574 and 1564 cm-1, the former high frequency pair being attributed to the ionizable carboxylate side chain of Asp and the latter to that of Glu. This is further supported by the data shown in Figure 3(d) where the lower frequency cross peaks between TFA and the side chain COOH are more intense than the higher frequency ones. As reported by Barth et al28, the COOH side chain transitions from Asp and Glu appear at 1713 and 1706 cm-1 respectively in D2O.
Although the cross-peaks between the carboxylate groups and the main amide-I band are clearly observed in the 2D-IR spectrum, their assignment to specific carboxylate diagonal peaks requires comparisons with theory as described in the next section. However, an elementary consideration of the dipole-dipole coupling between the carboxylate groups and amide-I modes gives a qualitative idea of the extent delocalization. For example, the Asp 44 side-chain carboxylate has its strongest dipole-dipole coupling with the amide-I mode from its own backbone −CONH- group. Its dipole-dipole couplings with other amide-I modes are negligible. The Asp 46, Glu 45 and Glu 72 side-chain carboxylates were found to be most strongly coupled with the amides formed from Ser 43 and Asp 46, Asp 44 and Glu 45, and Asn 68 and Glu 72 respectively. This simple result, suggesting that the carboxylate modes are mainly delocalized onto the most nearby backbone modes, promises that a detailed analysis of the cross peaks between the respective COO- groups and the main amide-I band would provide information about the local structure of the peptide. The simulation of the cross peaks involving carboxylates represents a main objective of the spectral theory given in the next section.
The diagonal peak at 1660 cm-1 most probably represents the amide-I transitions of the amino acids from non-helical regions of the protein. These residues are fewer in number compared with the helical residues accounting for their intensity of the diagonal peak at 1660 cm-1 being only 20% of that of the main band in the 2D-IR spectrum. Diagonal peaks in the region 1700-1730 cm-1 are not at all prominent though their cross peaks (Figure 4(d)) can be seen. This result suggests that a minor fraction of the acid form is also present in the sample solution in neat D2O.
Temperature Dependence of the 2D-IR spectrum
The helices of HP35 become more disordered as the temperature is raised and the protein unfolds. The new diagonal peak at 1680 cm-1 is a signature of these disordered structures and the peak at 1660 cm-1 becomes more pronounced for similar reasons. At elevated temperatures, the main band transitions at 1643 and 1630 cm-1 at 85°C are decreased to 55% and 40% of their initial amplitude at room temperature and the cross-section of the carboxylate side chain band decreases. There is a corresponding increase in the region ~ 1700-1730 cm-1 that we suggest arises from increased exposure to solvent of ionizable carboxylate groups thereby shifting the equilibrium to the acid side.
5. Hamiltonian construction
Simulations of the Infrared response of the Villin Heapiece subdomain, were performed using the effective vibrational Hamiltonian described bellow. We have included 39 vibrational modes: the 34 amide-I modes incorporated between the residues Leu42 and Phe76, the 4 carboxylic/carboxylate modes corresponding to the side chains of the residues Asp44, Glu45, Asp46 and Glu72 and the C-Terminal carboxylic/carboxylate Phe76. Using the bosonic creation and annihilation operator of a vibrational exciton Bi† and Bi, the model Hamiltonian is
| (1) |
where ωi(t) is the fundamental frequency of the local mode i, Jij is the coupling between the mode i and the mode j and Δi is the anharmonicity. The indices i=1,…,34 denote the 34 amide-I vibrations, i=35,…,39 designates the 5 carboxylic/carboxylate modes. The coupling with the electric field E(t) of the laser pulses is
| (2) |
with μi(t) the transition-dipole of the ith vibrational mode i.
Several models have been used in the past to simulate the vibrational parameters and their corresponding fluctuations. In order to establish a link between structure fluctuations and the Hamiltonian DFT maps were recently introduced to connect ab-initio calculations and MD coordinates.30-38 The electrostatic parameters represent the adiabatic interaction between intramolecular high frequency vibrations and slow structural motions. Many simulations, using several parameterization schemes have been employed for the amide-I mode.30-36 M. Cho and coworkers parameterized the amide-I vibration by identifying the electrostatic potential at 4 coordinates corresponding to the atoms C, O, N and H of the amide bond.30 An anharmonic vibrational Hamiltonian for the amide I, II, III, and A modes of NMA has been recast in terms of 19 components of an external electric field and its first and second derivative tensors evaluated at a single point.33 Other parameterizations using the electrostatic field and its gradients at several points have been developed.31,34,36 In all these parametrizations the electrostatic potential is sampled around the atoms involved in the vibrational mode. Experimental tests of such maps have been reported for larger peptides.39 Similar electrostatic maps have been developed for the OH stretch of H2O and the HOD molecule.37,38
We have used the CHO4 electrostatic map to simulate the fundamental frequency fluctuation of the amide-I modes of the Villin Headpiece subdomain.44,45 The amide-I transition-dipole and the intraband coupling are used as defined by the Torii and Tasumi transition-dipole coupling (TDC) model.46 The coupling between nearest-neighbor amide-I modes is given by the Torii and Tasumi dihedral angles map.46 The amide-I mode anharmonicity is fixed to the measured value of -16 cm-1.48
Similar parameterization of the carboxylic/carboxylate vibrational group is not available. We have developed a new electrostatic map for the carboxylic and carboxylate vibrational modes fundamental frequency and transition-dipole. This will be described bellow. Using the computed transition-dipole, the carboxylic and carboxylate intraband couplings and the carboxylic/amide-I and carboxylate/amide-I interband couplings are also computed by the TDC model. Finally, the acetic acid anharmonicity is fixed at -16 cm-1 and the acetate anharmonicity at -24 cm-1.
6. Parameterization of the carboxylic acid and carboxylate vibrational modes
In the following simulations we used acetic acid in its ionized and acid forms as models for the vibrational frequency parameters of the ionizable sidechains of the Villin Headpiece subdomain.
Frequency and transition-dipole parameterization of the acetic acid vibrations
To describe the anharmonic acetic acid vibrational dynamics we assumed that the carbonyl normal mode in solution is close to the gas-phase normal mode and we neglected its anharmonic couplings to other normal modes. As a result the Hamiltonian describing the carbonyl vibration is expanded to fourth order in the single carbonyl normal mode coordinate Q:
| (3) |
and the dipole is similarly expanded as
| (4) |
Here M and P correspond respectively to the reduced mass and conjugate momentum of the normal mode Q. All potential parameters depend parametrically on the electrostatic field E(r) generated by the surrounding molecules. To obtain the dependence on the parameters of the electrostatic field, we used 100 water clusters containing the acetic acid molecule from an MD simulation. The MD structure of acetic acid is replaced by the minimized DFT gas-phase structure and the water molecules by point charges (TIP3P model). Electronic structure calculations were performed by taking 25 random < 0.1 Å displacements along Q. The intramolecular parameters V0, V1, V2, V3 and V4 were then extracted using a linear least square fitting (LLSF). The same methodology was applied to obtain the permanent dipole μ0 and the transition-dipole μ1. For each molecular cluster, the energy of the lowest quantum number states were found by numerical diagonalization of H including levels up to n=20. In this manner we obtained the frequency difference ω10[E(r)] between the ground state and the first excited state and the corresponding transition-dipole μ10[E(r)]. The fundamental frequency and the corresponding transition-dipole were then expanded linearly in terms of a finite number of electrostatic parameters. For the acetic acid vibration, we choose 12 parameters, Ex, Ey, Exx, Eyy, Ezz and Exy calculated at the location of both the C and O1 atoms, with Ea being the electrostatic field in the a direction and Eab its derivative with respect to b.
| (5) |
with i=x,y,z,xx,yy,zz,xy and j=C,O1. The parameters , Cij, and Dij, reported in Table 1 of appendix A, were obtained by a linear least square fitting on the 100 configurations. Eq. 5 gives a very good correlation between the DFT frequency and the electrostatic map (see Figure 8(a)).
Figure 8. Correlation maps.

DFT/MAP correlation plots for (a) Acetic acid and (b) acetate.
Frequency and transition-dipole parametrization of the acetate vibration
The acetate ion contains two strongly coupled CO vibrations yielding a symmetric, Qs, and an antisymmetric, Qa, stretching mode. We found the harmonic gas-phase frequency for the symmetric vibration to be 1348 cm-1 and the antisymmetric vibration to be 1635 cm-1. Simulation of the antisymmetric vibration region must take into account its coupling with the symmetric mode. We therefore used a vibrational Hamiltonian that contains both modes:
| (6) |
where i,j,k,l=a,s. To compute the intramolecular potential, 50 random < 0.1 Å deformations are generated in the xy plane. The 15 parameters in Eq. 6 are extracted by linear least square fitting. For each of 400 water cluster configurations, numerical diagonalization of the Hamiltonian leads to the antisymmetric stretch fundamental frequencies and the corresponding transition-dipoles. To parameterize both quantities we expand them using 33 electrostatic parameters : Ex, Exx, Eyy, Ezz, Eyz, Exxx, Exyy, Exzz and Exyz, computed on the atom C and Ex, Ey, Exx, Eyy, Ezz, Exy, Exxx, Eyyy, Exyy, Exxy, Exzz and Eyzz computed on both atoms O1 and O2. A similar expansion to Eq. 5 was used and the corresponding coefficients are reported on Table 2 in appendix A. This parameterization leads to the DFT/MAP correlation shown on Figure 8(b).
7. IR response simulation
We used a Direct Nonlinear Exciton Propagation (NEP) approach to simulate the linear and nonlinear IR.40 Similar to other approaches41, the excitons are propagated numerically under a time-dependent Hamiltonian H(t) (Eq. 1). However, the quasi-particle Nonlinear Exciton Equation (NEE)42,43 picture is retained. Unlike the sum-over-state (SOS) picture, it is not necessary to compute different Liouville.41,43 Strong cancellation between the different pathways is naturally built in and the signal is computed directly. Using this methodology we have computed separately the rephasing signal (kI) and the nonrephasing (kII). The final signal corresponding to the sum of both contributions. In order to get a better agreement between theory and experiment and to compensate for errors in the DFT calculations of the vibrational frequencies, 5 parameters were adjusted in our simulations: the central frequencies of the carboxylate, carboxylic acid and amide-I modes, an overall scale factor 0<η<1 for the couplings Jij(t) which represents the effect of the surrounding water and a dephasing parameter Γ which represents additional relaxation process not included explicitly in the model.
Calculation of the Linear Absorption Spectra
We included in the simulation the TFA absorption (see Sample Section) by adding a Lorentizian of fwhm 8.4 cm-1 homogeneous linewidth centered around 1673 cm-1. The simulated absorption spectrum for the FI and the FN trajectories are shown in Figure 9. The open circles correspond to the experiment in neat D2O. The experimental spectrum in Figure 2 shows optical density in the carboxylate as well as in the carboxylic band indicating that the peptide has those different states in equilibrium. The simulations assume that the peptide can have one of two states: With all the carboxylate groups either fully ionized or fully neutral. To compare with the experiment statistical mixtures of FI and FN (labeled as FI+FN) in Figure 9, are chosen with FI/FN ratio of 2:1. The FI infrared absorption shows three main peaks: the main amide I band and two bands corresponding to the carboxylate vibrations located at 1648 cm-1, 1581 cm-1 and 1608 cm-1 respectively. The experimental spectrum shows broader bands than those computed, indicating that some relaxation processes are not included in the simulation.
Figure 9. Simulated linear absorption spectrum of the Villin headpiece (HP36) at 27° C.
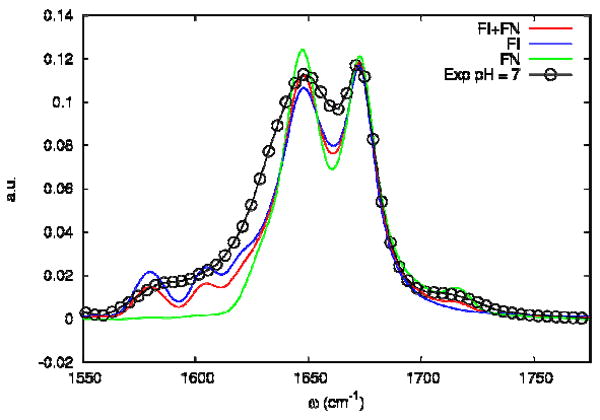
Simulated linear absorption of FI (blue), FN (green) trajectories and a 2:1 FI/FN mixture (red). The coupling scaling factor η is fixed to 0.4 and Γ=0. The open circles are from the experiment in neat D2O.
To trace the origin of the two peaks in the carboxylate absorption region we have computed the projected density of states ρi(ω)
| (8) |
whereΨi,λ is the component of the eigenstate λ on the site i and ωλ are the corresponding eigenfrequencies of the hamiltonian H (Eq. 1). ρi (ω) displayed in Figure 10, shows that the two absorption bands correspond to different amino-acids with the low frequency band characterizing the glutamic acid while the high frequency band corresponds to both aspartic acid and the C-terminal acid.
Figure 10. Density of states.
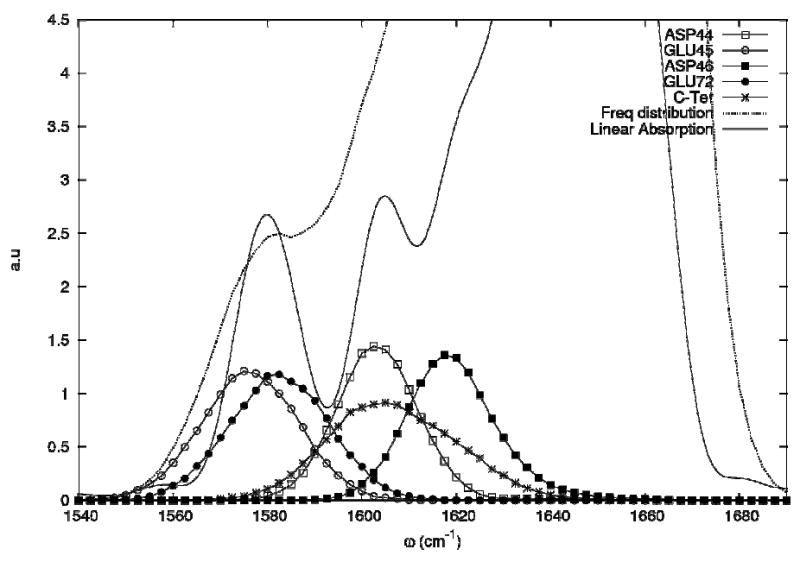
Projected density of states of the carboxylate side chains. The total density of states is the dotted line.
Figure 11 shows that the coupling scaling factor η hardly affects the absorption. In the next Section, we show that this is not the case for the nonlinear photon echo signal. Increasing Γ to 5.5 cm-1 improves the agreement with experiment. The absorption of the UI trajectory is displayed in Figure 12. The TFA lorentzian linewidth was increased to 10.6 cm-1 to mimic the variation with temperature as seen in the experiment.
Figure 11. The influence of η and Γ on the simulated linear absorption spectrum of Villin headpiece (HP36) at 27°C.
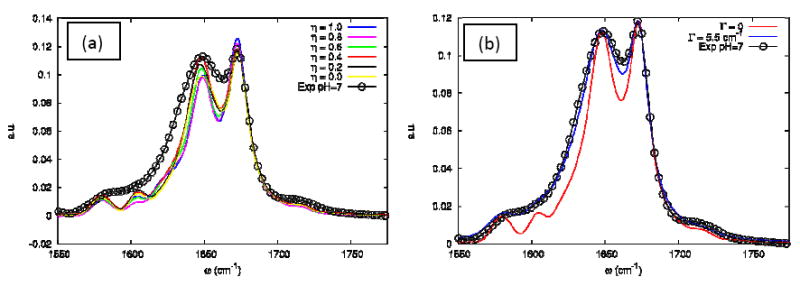
(a) The influence of the η coupling scale on the simulated linear absorption of the FN+FI configuration (as defined in text) at Γ=0. (b) The influence of the Γ dephasing parameter on the simulated linear absorption of the FN+FI at η=0.4. The open circles are from the experiment in neat D2O at 23°C.
Figure 12. Simulated linear IR spectrum at 85° C.

Simulated linear absorption of the unfolded (UI) configuration. The coupling scaling factor J is fixed at 0.4. The open circles are from the experiment in neat D2O at 23°C.
2D-IR Photon echo simulations
The 2D-IR photon echo simulations were carried out for FI, FN and UI. In contrast with the absorption, variations in the scaling factor from η =0 to η =1 (Figure 13) are strong. For η =1, the diagonal of 2D signal shows three well resolved bands corresponding to two carboxylate bands and the amide-I band. For smaller coupling (η ≤0.4) the high frequency carboxylate band tends to merge with the amide-I. The case η=0.4 is in best agreement with the experiments.
Figure 13. Coupling dependence of the simulated 2D-IR spectrum at 27°C.
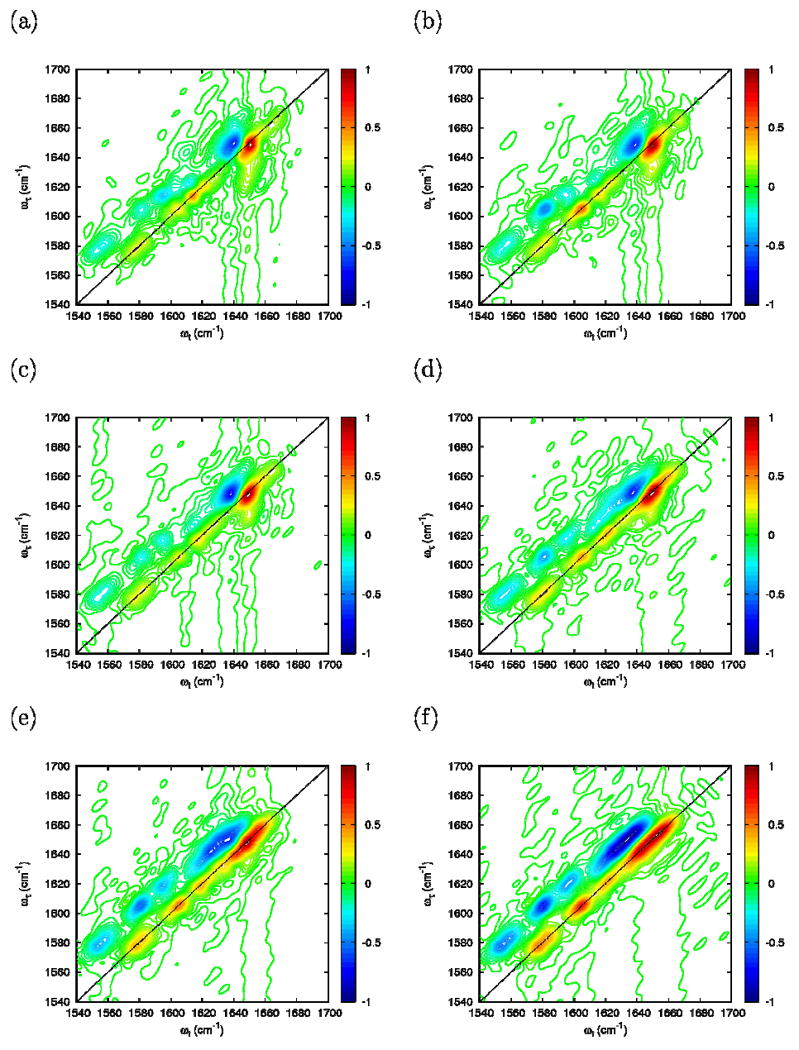
Simulated photon echo using the folded FI configuration at Γ=0: (a) η=1; (b) η=0.8; (c) η=0.6; (d) η=0.4; (e) η=0.2; and (f) η=0.0.
The 2D-IR photon echo signals for the 2:1 ratio of the FI/FN 2D-IR (FI+FN) are displayed in Figure 14a. The expanded scale of the cross peak region between the carboxylate and the amide-I bands, displayed in Figure. 14(b), agrees well with the experimental identification of cross-peaks in this region. Increasing Γ to 5.5 cm-1, the long vertical and horizontal tails (Figure 14c) characteristic of an exponential decay overlap with the carboxylate/amide-I crosspeak region and mask the corresponding signal amplitude. Those tails are not observed experimentally indicating that the actual relaxation is not dominated by a simple exponential dephasing process.
Figure 14. Dependence of simulated 2D-IR spectrum on temperature and dephasing.
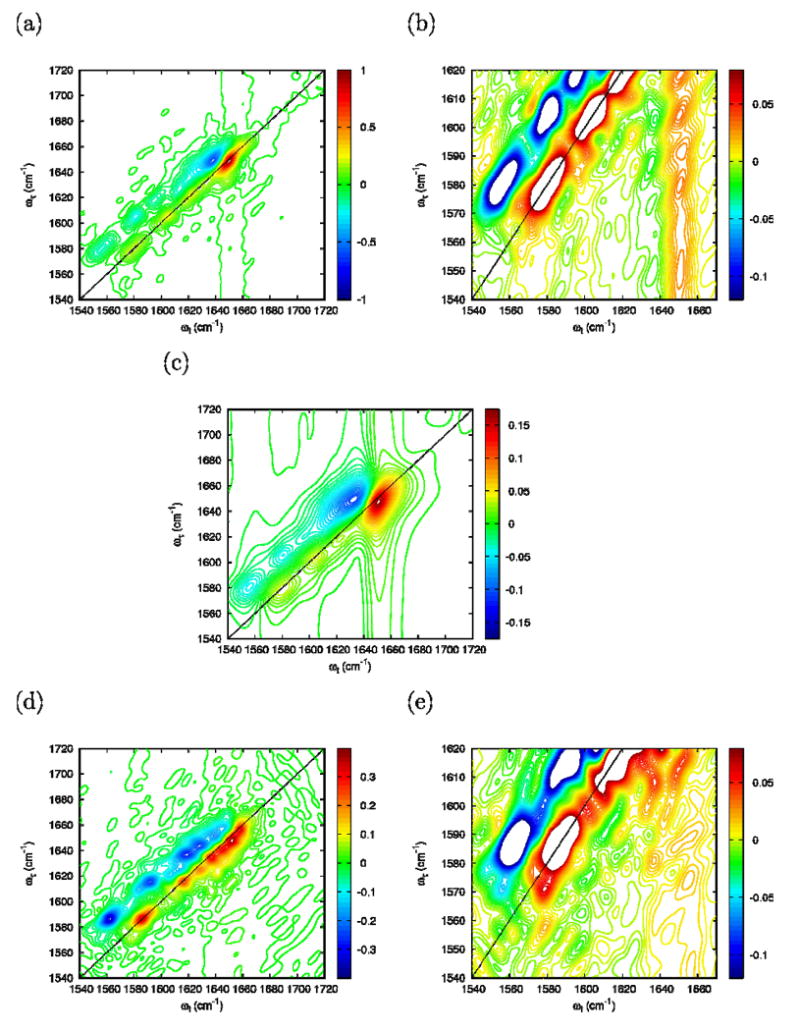
Simulated photon echo at 27° C of a 2:1 FI/FN mixture at η=0.4: (a) Full frequency range, Γ=0; (b) Closeup of the carboxylate/amide-I cross peak region, Γ=0; (c) Full frequency range, Γ=5.5 cm-1. Simulated photon echo at 85° C of the UI configuration at η=0.4 and Γ=0: (d) Full frequency range; (e) Close-up of the carboxylate/amide-I cross peak region.
The simulated 2D-IR of the UI trajectory is shown on Figure 14(d) and the close-up of the carboxylate/amide-I crosspeak region is displayed in Figure. 14(e). In the unfolded state, both the carboxylate and the amide-I bands are broader. In the carboxylate/amide-I crosspeak region the signal amplitude becomes much smaller than in the folded state, again in agreement with experiment.
The delocalization of the vibrational modes for the folded FI and the unfolded UI configurations is made clear from the maps of the average coupling shown in Figure 15 recall that 1 to 34 correspond to the amide-I modes and 35 to 39 correspond to the carboxylate modes. In the amide-I / amide-I coupling, the nearest neighbor coupling is dominant for both the folded and unfolded configurations. Figure 15(a) shows the signature of the three α-helices of the Villin Headpiece subdomain through their n / n+3 coupling which is known to favor the delocalization of the excitons along a single spine of α-helices.47 For both FI and UI configurations the carboxylate / carboxylate coupling is weaker compared with the amide-I / amide-I coupling, indicating that the carboxylate vibrations are more isolated. The coupling between the carboxylate and the amide-I vibration depends strongly on the peptide structure and the side chain. In the folded state, the C-Terminal carboxylate group (number 39 in Figure 15) is coupled to the nearest amide-I unit located at the end of the peptide (number 35 in Figure 15). The side chain Glu72 (number 38) is mainly coupled to the amide-I unit located between the amino-acids Glu72 and Lys73. The carboxylate side chain of Glu45 (number 36 in Figure 15) shows the weakest coupling to amide-I units. The side chain ASP44 (number 35) is mainly coupled to the amide-I units located between Asp44 and Glu45 and between Thr54 and Arg55 which is a tertiary structure contact. Finally the side chain (Asp46) is coupled to several amide-I units ranging from Leu42 to Phe47. In contrast, the unfolded state does not show any significant coupling between amide-I and carboxylate. And the cross peaks between the carboxylate bands and main main-I band are significantly reduced.
Figure 15.

The average coupling amongst amide-I and carboxylate vibrational modes for: (a) the folded FI; and (b) the unfolded UI configurations. The backbone residues are labeled 1-34 and the carboxylates 35-39.
8. Comparison between experiments and simulations
Both 2D-IR experiments and simulations show significant coupling between the carboxylate side chains and the amide states of Villin headpiece. Four cross peaks between the carboxylate groups and the main amide-I band are clearly observed in the 2D-IR spectrum near ωt =1540 cm-1 and ωτ = 1560-1600 cm-1. The diagonal peaks from the carboxylates are not clearly distinguishable. Vibrational response simulations of a 2:1 F1/FN mixture predicted two separated diagonal bands in the frequency range 1560-1600 cm-1; the higher frequency band corresponds to the aspartates and the C–terminal carboxylate, while the lower frequency band corresponds to the glutamates. The two diagonal bands give rise to cross peaks with the amide-I band near 1640 cm-1. Our density of states calculations predicted the Asp44 and Asp46 to have higher mean frequency compared with Glu45 and Glu72 respectively. 2D-IR spectrum shows a 50% decrease in the signal amplitudes of these cross peaks at 85°C; the four cross peaks can still be clearly distinguished. The cross-peak region shows a larger decrease in intensity and becomes indistinct at 85°C in the simulated photon echo spectrum. The diagonal features of the experimental 2D spectrum at 85°C show 40% residual signal from the folded states as compared with that at 23°C, whereas the simulation at 85°C were performed on the unfolded protein, equilibrated at 527°C. The residual folded states present in the experiment are likely to be the source of the distinguishable cross peaks between the carboxylate side chains and the amide-I band in the 2D-IR spectrum.
9. Conclusions
The carboxylate side-chains were found to have significant coupling with the main amide-I band and give rise to distinct cross-peaks with amide-I transitions. These negatively charged side-chains spectrally overlap with the 13C=16O and 13C=18O isotopically edited amide-I transition frequency region. Thus additional analysis and spectral assignment will be needed in interpreting protein isotopomers containing Asp and Glu. Simulations of the 2D-IR optical response of the Villin Headpiece subdomain showed these side-chains significantly couple to only a few amide-I modes among all the amino acid residues, which makes them very useful as spectroscopic markers, providing information about the local structural behavior of the protein. The carboxylate absorption range of the villin headpiece is composed of two separated bands corresponding respectively to the two amino-acids, Asp and Glu. The higher frequency band corresponding to the aspartic acid and the C-terminal carboxylate are both significantly mixed with the amide-I band. It was necessary to use a scaling factor of η=0.4 for the coupling in order to reproduce the experimental results. Non exponential relaxation process not included in the simulation, will be required to explain the observed broadening. Both experiment and simulation find that the folded state of the Villin headpiece subdomain has cross peaks between the carboxylate and amide-I bands that are significantly diminished by unfolding.
Acknowledgments
The research was supported by the NIH Grant GM12592, by NSF and by instrumentation through the Resource NIH P41 RR001348. S. M. greatly acknowledges the support of The National Institute of Health, Grant GM59230, and the National Science Foundation, Grant CHE-0745892. C. F. and S. M. would like to thank Prof. D. Tobias, Dr. D. Abramavicius and Dr. W. Zhuang for helpful discussions.
Appendix A. Acetic acid and acetate molecule electrostatic map coefficients
Table 1.
Acetic acid carbonyl vibration electrostatic map coefficients.
|
|
1794.99 |
|
-0.273784 |
|
0.034589 |
|
0.001108 | ||||
| Cx,C | 7061.95 |
|
1.073082 |
|
-0.216676 |
|
-0.332509 | ||||
| Cy,C | -161.19 |
|
-0.188739 |
|
-0.544033 |
|
0.559513 | ||||
| Cxx,C | 4401.51 |
|
1.66013 |
|
0.912052 |
|
0.582458 | ||||
| Cyy,C | -8319.04 |
|
-0.313005 |
|
1.131204 |
|
1.665374 | ||||
| Czz,C | -2686.97 |
|
0.739752 |
|
1.130211 |
|
1.525385 | ||||
| Cxy,C | 577.7 |
|
-0.597171 |
|
-0.72804 |
|
0.929922 | ||||
| Cx,O1 | -3084.59 |
|
0.411037 |
|
0.200399 |
|
0.475283 | ||||
| Cy,O1 | 313.7 |
|
0.307642 |
|
0.805647 |
|
-0.573463 | ||||
| Cxx,O1 | 703.1 |
|
1.078939 |
|
0.920538 |
|
0.896748 | ||||
| Cyy,O1 | -224.45 |
|
0.873689 |
|
1.061465 |
|
1.091423 | ||||
| Czz,O1 | -1322.81 |
|
1.015866 |
|
1.090813 |
|
1.099215 | ||||
| Cxy,O1 | -286.06 |
|
-0.250912 |
|
-0.280752 |
|
0.528865 |
Table 2.
Acetate molecule asymmetric carbonyl vibration electrostatic map coefficients.
|
|
1641.13 |
|
0.011625 |
|
0.382309 |
|
0.000523 | ||||
| Cx,C | -9369.28 |
|
-0.282794 |
|
1.985792 |
|
0.610575 | ||||
| Cxx,C | -9346.53 |
|
-5.243465 |
|
4.936492 |
|
-0.191843 | ||||
| Cyy,C | 1711.93 |
|
4.891628 |
|
-1.0319 |
|
1.909363 | ||||
| Czz,C | 592.38 |
|
-4.335272 |
|
3.484305 |
|
-0.365647 | ||||
| Cxy,C | -83.13 |
|
0.143076 |
|
0.056743 |
|
-1.3309 | ||||
| Cxxx,C | 4630.01 |
|
0.208477 |
|
1.058037 |
|
0.416076 | ||||
| Cxyy,C | -13330.66 |
|
3.030343 |
|
1.239544 |
|
2.565149 | ||||
| Cxzz,C | 2966.15 |
|
0.711041 |
|
0.680399 |
|
0.727763 | ||||
| Cxyz,C | 196.62 |
|
0.022373 |
|
-0.158278 |
|
-0.792099 | ||||
| Cx,O1 | 6434.73 |
|
0.274243 |
|
-1.168619 |
|
-0.300579 | ||||
| Cy,O1 | 160.83 |
|
-3.480055 |
|
1.241321 |
|
-0.938871 | ||||
| Cxx,O1 | -2172.37 |
|
0.059112 |
|
1.64456 |
|
0.897237 | ||||
| Cyy,O1 | 1557.63 |
|
3.471973 |
|
-0.272564 |
|
1.558936 | ||||
| Czz,O1 | 1494.8 |
|
0.114831 |
|
1.247511 |
|
0.656936 | ||||
| Cxy,O1 | -3920.65 |
|
1.471899 |
|
-0.209534 |
|
0.580431 | ||||
| Cxxx,O1 | 144.34 |
|
1.343968 |
|
0.924385 |
|
1.077781 | ||||
| Cyyy,O1 | -290.91 |
|
0.531879 |
|
1.290794 |
|
0.875888 | ||||
| Cxyy,O1 | 61.73 |
|
0.452601 |
|
1.152418 |
|
0.869541 | ||||
| Cxxy,O1 | 990.11 |
|
0.980082 |
|
0.88304 |
|
0.957939 | ||||
| Cxzz,O2 | -351.33 |
|
1.406842 |
|
0.853096 |
|
1.103958 | ||||
| Cyzz,O2 | -214.98 |
|
1.457727 |
|
0.780095 |
|
1.13968 | ||||
| Cx,O2 | 6434.73 |
|
0.274243 |
|
-1.168619 |
|
-0.300579 | ||||
| Cy,O2 | -160.83 |
|
3.480055 |
|
-1.241321 |
|
0.938871 | ||||
| Cxx,O2 | -2172.37 |
|
0.059112 |
|
1.64456 |
|
0.897237 | ||||
| Cyy,O2 | 1557.63 |
|
3.471973 |
|
-0.272564 |
|
1.558936 | ||||
| Czz,O2 | 1494.8 |
|
0.114831 |
|
1.247511 |
|
0.656936 | ||||
| Cxy,O2 | 3920.65 |
|
-1.471899 |
|
0.209534 |
|
-0.580431 | ||||
| Cxxx,O2 | 144.34 |
|
1.343968 |
|
0.924385 |
|
1.077781 | ||||
| Cyyy,O2 | 290.91 |
|
-0.531879 |
|
-1.290794 |
|
-0.875888 | ||||
| Cxyy,O2 | 61.73 |
|
0.452601 |
|
1.152418 |
|
0.869541 | ||||
| Cxxy,O2 | -990.11 |
|
-0.980082 |
|
-0.88304 |
|
-0.957939 | ||||
| Cxzz,O2 | -351.33 |
|
1.406842 |
|
0.853096 |
|
1.103958 | ||||
| Cyzz,O2 | 214.98 |
|
-1.457727 |
|
-0.780095 |
|
-1.13968 |
References
- 1.McKnight CJ, Doering DS, Matsudaira PT, Kim PS. J Mol Biol. 1996;260:126–134. doi: 10.1006/jmbi.1996.0387. [DOI] [PubMed] [Google Scholar]
- 2.McKnight CJ, Matsudaira PT, Kim PS. Nat Struct Biol. 1997;4:180–184. doi: 10.1038/nsb0397-180. [DOI] [PubMed] [Google Scholar]
- 3.Frank BS, Vardar D, Buckley DA, McKnight CJ. Protein Sci. 2002;11:680–687. doi: 10.1110/ps.22202. [DOI] [PMC free article] [PubMed] [Google Scholar]
- 4.Kubelka J, Eaton WA, Hofrichter J. J Mol Biol. 2003;329:625–630. doi: 10.1016/s0022-2836(03)00519-9. [DOI] [PubMed] [Google Scholar]
- 5.Kubelka J, Hofrichter J, Eaton WA. Curr Opin Struct Biol. 2004;14:76–88. doi: 10.1016/j.sbi.2004.01.013. [DOI] [PubMed] [Google Scholar]
- 6.Kubelka J, Henry ER, Cellmer T, Hofrichter J, Eaton WA. Proc Natl Acad Sci U S A. 2008;105:18655–18662. doi: 10.1073/pnas.0808600105. [DOI] [PMC free article] [PubMed] [Google Scholar]
- 7.Chiu TK, Kubelka J, Herbst-Irmer R, Eaton WA, Hofrichter J, Davies DR. Proc Natl Acad Sci U S A. 2005;102:7517–7522. doi: 10.1073/pnas.0502495102. [DOI] [PMC free article] [PubMed] [Google Scholar]
- 8.Laskowski M, Scheraga HA. J Am Chem Soc. 1954;76:6305–6319. [Google Scholar]
- 9.Hamm P, Hochstrasser RM. Ultrafast Infrared and Raman Spectroscopy. 2001:273. [Google Scholar]
- 10.Ge NH, Zanni MT, Hochstrasser RM. J Phys Chem A. 2002;106:962–972. [Google Scholar]
- 11.Fang C, Wang J, Charnley AK, Barber-Armstrong W, Smith AB, Decatur SM, Hochstrasser RM. Chem Phys Lett. 2003;382:586–592. [Google Scholar]
- 12.Cabaniss SE, McVey IF. Spectroc Acta Pt A-Molec Biomolec Spectr. 1995;51:2385–2395. [Google Scholar]
- 13.Cabaniss SE, Leenheer JA, McVey IF. Spectroc Acta Pt A-Molec Biomolec Spectr. 1998;54:449–458. [Google Scholar]
- 14.Humbert B, Alnot M, Quiles F. Spectroc Acta Pt A-Molec Biomolec Spectr. 1998;54:465–476. [Google Scholar]
- 15.Binev IG, Vassileva-Boyadjieva P, Binev YI. J Mol Struct. 1998;447:235–246. [Google Scholar]
- 16.Keresztury G, Istvan K, Sundius T. J Phys Chem A. 2005;109:7938–7945. doi: 10.1021/jp044792l. [DOI] [PubMed] [Google Scholar]
- 17.Max JJ, Chapados C. J Phys Chem A. 2004;108:3324–3337. [Google Scholar]
- 18.Tang YF, Grey MJ, McKnight J, Palmer AG, Raleigh DP. J Mol Biol. 2006;355:1066–1077. doi: 10.1016/j.jmb.2005.10.066. [DOI] [PubMed] [Google Scholar]
- 19.Kim YS, Wang J, Hochstrasser RM. J Phys Chem B. 2005;109:7511–7521. doi: 10.1021/jp044989d. [DOI] [PubMed] [Google Scholar]
- 20.Data from NIST Standard Reference Database 69, June 2005 Release: NIST Chemistry WebBook [Google Scholar]
- 21.Kale L, Skeel R, Bhandarkar M, Brunner R, Gursoy A, Krawetz N, Phillips J, Shinozaki A, Varadarajan K, Schulten K. J Comput Phys. 1999;151:283–312. [Google Scholar]
- 22.Brooks BR, Bruccoleri RE, Olafson BD, States DJ, Swaminathan S, Karplus MJ. J Comput Chem. 1983;4:187. [Google Scholar]
- 23.Darden T, York D, Pedersen L. J Chem Phys. 1993;98:10089–10092. [Google Scholar]
- 24.Essmann U, Perera L, Berkowitz ML, Darden T, Lee H, Pedersen LG. J Chem Phys. 1995;103:8577–8593. [Google Scholar]
- 25.Tu K, Tobias DJ, Klein ML. Biophys J. 1995;69:2558–2562. doi: 10.1016/S0006-3495(95)80126-8. [DOI] [PMC free article] [PubMed] [Google Scholar]
- 26.Feller SE, Zhang YH, Pastor RW, Brooks BR. J Chem Phys. 1995;103:4613–4621. [Google Scholar]
- 27.Frisch MJ, T GW, Schlegel HB, Scuseria GE, Robb MA, Cheeseman JR, Montgomery JA, Jr, Vreven T, Kudin KN, Burant JC, Millam JM, Iyengar SS, Tomasi J, Barone V, Mennucci B, Cossi M, Scalmani G, Rega N, Petersson GA, Nakatsuji H, Hada M, Ehara M, Toyota K, Fukuda R, Hasegawa J, Ishida M, Nakajima T, Honda Y, Kitao O, Nakai H, Klene M, Li X, Knox JE, Hratchian HP, Cross JB, Bakken V, Adamo C, Jaramillo J, Gomperts R, Stratmann RE, Yazyev O, Austin AJ, Cammi R, Pomelli C, Ochterski JW, Ayala PY, Morokuma K, Voth GA, Salvador P, Dannenberg JJ, Zakrzewski VG, Dapprich S, Daniels AD, Strain MC, Farkas O, Malick DK, Rabuck AD, Raghavachari K, Foresman JB, Ortiz JV, Cui Q, Baboul AG, Clifford S, Cioslowski J, Stefanov BB, Liu G, Liashenko A, Piskorz P, Komaromi I, Martin RL, Fox DJ, Keith T, Al-Laham MA, Peng CY, Nanayakkara A, Challacombe M, Gill PMW, Johnson B, Chen W, Wong MW, Gonzalez C, Pople JA. Gaussian 03,Revision C.02. Gaussian, Inc.; Wallingford CT: 2004. [Google Scholar]
- 28.Barth A, Zscherp C. Quarterly Reviews of Biophysics. 2003;35:369–430. doi: 10.1017/s0033583502003815. [DOI] [PubMed] [Google Scholar]
- 29.Ripoll DR, Vila JA, Scheraga HA. J Mol Bio. 2004;339:915–925. doi: 10.1016/j.jmb.2004.04.002. [DOI] [PubMed] [Google Scholar]
- 30.Ham S, Kim JH, Lee H, Cho MH. J Chem Phys. 2003;118:3491–3498. [Google Scholar]
- 31.Bour P, Keiderling TA. J Chem Phys. 2003;119:11253–11262. [Google Scholar]
- 32.Jansen TL, Knoester J. J Chem Phys. 2006:124. doi: 10.1063/1.2148409. [DOI] [PubMed] [Google Scholar]
- 33.Hayashi T, Zhuang W, Mukamel S. J Phys Chem. 2005;109:9747–9759. doi: 10.1021/jp052324l. [DOI] [PubMed] [Google Scholar]
- 34.Schmidt JR, Corcelli SA, Skinner JL. J Chem Phys. 2004;121:8887–8896. doi: 10.1063/1.1791632. [DOI] [PubMed] [Google Scholar]
- 35.Watson TM, Hirst JD. Mol Phys. 2005;103:1531–1546. [Google Scholar]
- 36.Bloem R, Dijkstra AG, Jansen TLC, Knoester J. J Chem Phys. 2008:129. doi: 10.1063/1.2961020. [DOI] [PubMed] [Google Scholar]
- 37.Paarmann A, Hayashi T, Mukamel S, Miller RJD. J Chem Phys. 2008:128. doi: 10.1063/1.2919050. [DOI] [PMC free article] [PubMed] [Google Scholar]
- 38.Auer BM, Skinner JL. J Chem Phys. 2008:128. doi: 10.1063/1.2925258. [DOI] [PubMed] [Google Scholar]
- 39.Wang JP, Zhuang W, Mukamel S, Hochstrasser R. J Phys Chem. 2008;112:5930–5937. doi: 10.1021/jp075683k. [DOI] [PMC free article] [PubMed] [Google Scholar]
- 40.Falvo C, Palmieri B, Mukamel S. 2008 November; In preparation. [Google Scholar]
- 41.Jansen TL, Knoester J. J Phys Chem B. 2006;110:22910–22916. doi: 10.1021/jp064795t. [DOI] [PubMed] [Google Scholar]
- 42.Mukamel S, Abramavicius D. Chem Rev. 2004;104:2073–2098. doi: 10.1021/cr020681b. [DOI] [PubMed] [Google Scholar]
- 43.Abramavicius D, Palmieri B, Yang L, Voronine D, Mukamel S. Chem Rev. 2008 in press. [Google Scholar]
- 44.Kwac K, Cho MH. J Chem Phys. 2003;119:2256–2263. [Google Scholar]
- 45.Kwac K, Cho MH. J Chem Phys. 2003;119:2247–2255. [Google Scholar]
- 46.Torii H, Tasumi M. J Raman Spectrosc. 1998;29:81–86. [Google Scholar]
- 47.Falvo C, Pouthier V. J Chem Phys. 2005:123. doi: 10.1063/1.2101569. [DOI] [PubMed] [Google Scholar]
- 48.Hamm P, Lim M, Hochstrasser RM. J Phys Chem B. 1998;12:6123–6138. [Google Scholar]