

Abstract
Oxidative cell death is an important contributing factor in neurodegenerative diseases. Using HT22 mouse hippocampal neuronal cells as a model, we sought to demonstrate that mitochondria are crucial early targets of glutamate-induced oxidative cell death. We showed that when HT22 cells were transfected with shRNA for knockdown of the mitochondrial superoxide dismutase (SOD2), these cells became more susceptible to glutamate-induced oxidative cell death. The increased susceptibility was accompanied by increased accumulation of mitochondrial superoxide and loss of normal mitochondrial morphology and functions at early time points following glutamate exposure. However, overexpression of SOD2 in these cells reduced mitochondrial superoxide level, protected its morphology and functions, and provided resistance against glutamate-induced oxidative cytotoxicity. The change in the sensitivity of these SOD2-altered HT22 cells was neurotoxicant-specific, because the cytotoxicity of hydrogen peroxide was not altered in these cells. In addition, selective knockdown of the cytosolic SOD1 in cultured HT22 cells did not appreciably alter their susceptibility to either glutamate or hydrogen peroxide. These findings show that the mitochondrial SOD2 plays a critical role in protecting neuronal cells from glutamate-induced oxidative stress and cytotoxicity. These data also indicate that mitochodria are important early targets of glutamate-induced oxidative neurotoxicity.
Keywords: Glutamate, SOD2, Oxidative stress, Neuronal cell death, HT22
INTRODUCTION
Glutamate is an endogenous excitatory neurotransmitter, and it was estimated that this neurotransmitter is utilized by as many as one-third of the synapses in the central nervous system [1]. At high concentrations, glutamate is neurotoxic, and glutamate-induced neuronal death is believed to be an important contributing factor in the development of various neurodegenerative diseases, including Parkinson’s disease (PD) and Alzheimer’s disease (AD) [1, 2]. Glutamate can induce cytotoxicity via two different pathways. One of the pathways is mediated by the ionotropic glutamate receptors [3, 4], which triggers Ca2+ fluxes and leads to cell death by alteration of calcium homeostasis and subsequently accumulation of reactive oxygen species (ROS). The other pathway involves the inhibition by extracellular glutamate (when present at high concentrations) of cystine uptake mediated by the glutamate/cystine antiporter, which subsequently results in low intracellular glutathione (GSH) levels and culminates in oxidative stress and cell death [5–7]. HT22 cells, an immortalized mouse hippocampal cell line, have become a widely-used in vitro model in recent years for studying the oxidative stress-induced neuronal cell death [7], partly because these cells lack ionotropic glutamate receptor and thus effectively exclude the compounding cell death pathway mediated by the ionotropic glutamate receptor. In this neuronal oxidative stress model, high concentrations of extracellular glutamate cause intracellular GSH depletion and increase ROS production [5, 8]. Oxidative neuronal cytotoxicity is mediated by the mitogen-activated protein kinase (MAPK) signaling pathways [9–11] and apoptosis inducing factor (AIF) [12, 13]. Antioxidants such as vitamin E, N-acetyl-cysteine, and polyphenolic bioflavonoids can effectively prevent cells from oxidative neuronal death in this cell line [11, 13–15].
One of the major antioxidant enzymes in eukaryotes is the superoxide dismutase (SOD), which catalyzes the conversion of superoxide anions to hydrogen peroxide [16]. There are three different SOD isoforms found in mammals. The copper/zinc SOD (Cu/ZnSOD or SOD1) is a cytosolic enzyme coded by the Sod1 gene, and it is the predominant SOD in most cells and tissues, accounting for 70–80 % of the total cellular SOD activity [16]. The manganase superoxide dismutase (MnSOD or SOD2) is a key mitochondrial antioxidant enzyme coded by the Sod2 gene [16]. Extracellular copper/zinc SOD (SOD3), a minor SOD coded by the Sod3 gene, is only expressed in a limited number of tissues (lung, kidney, and fat tissue) [17]. Genetic inactivation of SOD2 in mice results in heart and liver complications, metabolic acidosis, and early neonatal death [18]. As opposed to the severe phenotype of the homozygous Sod2−/− mutant mice, animals lacking either SOD1 [19] or SOD3 [20] develop normally for at least the first year of their life.
A number of researchers have recently suggested that mitochondria were at the center of the neuronal oxidative stress and also oxidant-induced neuronal death [21–23]. In the present study, therefore, we sought to demonstrate that mitochondria are crucial initial targets of glutamate-induced oxidative cell death by investigating the neuroprotective functions of the mitochondrial SOD2 in oxidative stress-induced cell death in HT22 mouse hippocampal cells.
MATERIALS AND METHODS
Chemicals and reagents
Dullbecco’s modified Eagle’s medium (DMEM), fetal bovine serum (FBS), and trypsin-EDTA solution (containing 0.5 g/L trypsin and 0.2 g/L EDTA) were purchased from Sigma-Aldrich (St. Louis, MO). The antibiotics solution (containing 10,000 U/mL penicillin and 10 mg/mL streptomycin) was obtained from Gibco (Invitrogen, Grand Island, NY).
Cell culture conditions and assay of cell viability
Glutamate-sensitive HT22 murine hippocampal neuronal cells were a gift from Dr. David Schubert (Salk Institute, La Jolla, CA), and they were maintained in DMEM supplemented with 10% (v/v) FBS and antibiotics (penicillin-streptomycin) and incubated at 37°C under 5% CO2. Cells were subcultured once every 2 days. Cells were seeded in 96-well plates at a density of 5000 cells per well, and were treated with glutamate or hydrogen peroxide for 24 h. The stock solution of glutamate (1 M in DMEM without serum) was diluted in the culture medium immediately before addition to each well at the desired final concentrations, and hydrogen peroxide was freshly diluted in culture medium in each experiment.
For assessment of cell viability, the MTT assays were used. Ten μL MTT (at 5 mg/mL) was added to each well at a final concentration of 500 μg/mL, and the mixture was further incubated for 1 h, and the liquid in the wells was removed thereafter. DMSO (100 μL) was then added to each well, and the absorbance was read with a UV max microplate reader (Molecular Device, Palo Alto, CA) at 560 nm. The relative cell viability was expressed as percentage of the control cells that were not treated with glutamate or hydrogen peroxide.
Western blotting
For Western blotting, cells were washed first with phosphate-buffered saline (PBS), and then they were suspended in 100 μL of the lysis buffer (containing 20 mM Tris-HCl, 150 mM NaCl, 1 mM EDTA, 1% Triton X-100, protease inhibitor cocktail, 2 mM Na3VO4, and 10 mM NaF, pH 7.5). The amount of proteins was determined using the Bio-Rad protein assay (Bio-Rad, Hercules, CA). An equal amount of proteins was loaded in each lane. The proteins were separated by 12% SDS-polyacrylamide gel electrophoresis (SDS-PAGE) and electrically transferred to a polyvinylidene difluoride membrane (Bio-Rad). After blocking the membrane with 5% skim milk, SOD1 and SOD2 proteins were immunodetected using the rabbit anti-mouse SOD1 and SOD2 antibodies (obtained from Santa Cruz Biotechnology, Santa Cruz, CA). GAPDH was detected as a loading control using the anti-GAPDH antibody (obtained from Cell Signaling Technology, Beverly, MA). The horseradish peroxidase (HRP)-conjugated anti-rabbit IgG was applied as the secondary antibody, and the bands were detected using the Amersham ECL plus Western blotting detection reagents (GE Healthcare, Piscataway, NJ).
Construction of stable SOD2 knockdown HT22 cells
shRNA plasmids selectively targeting the mouse SOD1 and SOD2 were purchased from Santa Cruz Biotechnology (Santa Cruz, CA). A scrambled non-targeting shRNA plasmid was used as the negative control. These plasmids carried the puromycin resistance gene for the ease of isolating the shRNA plasmid DNA-transfected cells. Transfection of shRNA plasmids at the 100-nM final concentration was carried out using Lipofectamine 2000 (Invitrogen) according to the protocols provided by the manufacturers.
Transfection with small interfering RNA (siRNA) for SOD1 in HT22 cells
siRNA selectively targeting the mouse SOD1 was purchased from Santa Cruz Biotecnology. A scrambled non-targeting siRNA was used as the negative control. HT22 cells were seeded at 1 × 10⁵ cells/well in 6-well plate and reached a density of 30–50% confluence at the time of transfection. Transfection of the siRNA for SOD1 (100-nM) or the negative control siRNA was done by using Lipofectamine 2000 according to the protocols provided by the manufactures. Transfected cells were cultured for 48 h before harvesting and further analyses. The efficiency of the siRNA knockdown of SOD1 protein expression was determined by Western blot analysis with a specific antibody.
Stable expression of the SOD2/GFP fusion protein
The pEGFP-N1/SOD2 plasmid was a generous gift provided by Dr. Sonia Flores, at the Division of Pulmonary Sciences and Critical Care Medicine, University of Colorado, Denver, CO. HT22 cells were transfected with the pEGFP-N1/SOD2 plasmid as described by Connor et al. [24] using Lipofectamine 2000. Although the pEGFP-N1/SOD2 plasmid had a neomycin-resistant gene, HT22 cells were also strongly resistant to neomycin. Therefore, we could not use neomycin for selection of transfected cells. To establish the stably-transfected cells, we collected the GFP-positive cells using FACS Aria (BD Bioscience, San Jose, CA). After three times of cell sorting, the population of GFP-positive cells was increased to approximately 77%. Then, the transfected cells were seeded in 96-well culture plate at 1 cell per well. After 2-week culture, single colony was harvested for determination of the SOD2GFP fusion protein level by Western blotting.
Analysis of mitochondrial membrane potential
After treatment with glutamate, cells were harvested by trypsinization and washed once with PBS (pH 7.4). After centrifugation, cells were stained with 3,3′-dihexyloxacarbocyanine iodide [DiOC6(3); Molecular Probes, Eugene, OR] for analysis of the mitochondrial membrane potential (MMP). Cells were resuspended in 1 mL culture medium containing 25 nM of DiOC6(3) and incubated at 37°C for 15 min. After centrifugation, cells were resuspended in PBS. Flow cytometric analysis was performed using the BD LSR II (BD Bioscience).
Measurement of mitochondrial superoxide formation
After glutamate or hydrogen peroxide treatment, cells were stained with MitoSOX Red (Molecular probes) according to the protocols provided by the manufacturers. The digital images were taken under a fluorescence microscope (AXIO, Carl Zeiss Corporation, Germany). To quantify the amount of mitochondrial superoxide, flow cytometric analysis (BD LSR II) was performed. MitoSOX Red was excited by laser at 488 nm and data collected at 585/42 nm (FL2) as described earlier [25].
Analysis of SOD activity
Mitochondrial fraction was isolated from the cytosolic fraction using the Mitochondria/Cytosol Fractionation Kit (Bio Vision, Mountain View, CA). The amount of proteins was determined using the Bio-Rad protein assay (Bio-Rad). The SOD activity was determined using Superoxide Dismutase Activity Assay Kit (Bio Vision). Relative SOD activity was normalized by protein amount and shown as ratio to 100 % which is the SOD activity in control cells.
Analysis of total GSH and ATP levels
Control HT22 cells and SOD2/GFP high expression HT22 cells were treated with 4 mM glutamate for 8 h. Intracellular total GSH and ATP levels were determined using the ApoGSH™ glutathione colorimetric detection kit and the ApoSENSOR™ cell viability assay kit (Bio Vision), respectively. Total GSH and ATP levels were normalized by protein amount and shown as ratio to the levels in control cells (set at 100%).
Transmission electron microscopy (TEM) analysis of cells
For transmission electron microscopy analysis, cells were harvested using trypsin-EDTA and fixed in 2% glutaraldehyde for 4 h, and centrifuged to form pellets. Sample preparation was carried out according to a method described previously [26]. Briefly, the pellets were rinsed in 0.1 M cacodylate buffer (purchased from Electron Microscopy Sciences (EMS), Hatfield, PA) and post-fixed in 1% osmium tetroxide (EMS). Cell pellets were dehydrated through a graded series of ethanol and then passed through a propylene oxide twice and lastly placed in propylene oxide/Embed 812 resin (EMS) overnight for infiltration, and then polymerized in a 60°C oven overnight. Then sections were cut on a Leica UCT ultra microtome at 80 nm using a Diatome diamond knife. Sections were contrasted with uranyl acetate and Sato’s lead citrate (EMS), and viewed and photographed on a JEOL 100CXII TEM at 60 KV (J.E.O.L. Ltd., Tokyo, Japan).
Reproducibility of experiments and statistical analysis
All of the data and experiments described in the present study were repeated multiple times, and only one set of the representative data was shown. The data were mostly presented as mean ± S.D. Statistics were analyzed with one-way ANOVA and multiple comparisons with Dunnett’s test (SPSS software), and values of P < 0.05 were considered to be statistically significant.
RESULTS
Induction of neuronal cell death in HT22 cells by glutamate and hydrogen peroxide
The treatment of HT22 cells with glutamate lasted 24 h, unless otherwise noted. We confirmed that glutamate decreased cell viability (MTT assay) in a concentration-dependent manner, with IC50 values of approximately 3 mM (Fig. 1A). The intracellular ROS accumulation (using the H2-DCF-DA staining method) following glutamate treatment of HT22 cells has been reported earlier [6, 13]. In the present study, we chose to further examine the mitochondrial superoxide generation using the mitochondria-specific superoxide indicator MitoSOX Red. Treatment with 4 mM and 8 mM glutamate for 8 h significantly increased the mitochondrial superoxide levels in a dose-dependent manner (Fig. 1C). The reason that the cells were treated with glutamate for 8 h was based on an earlier observation showing that the induction of oxidative stress in this model was preceded by a reduction of intracellular GSH, which took several hours to occur [27]. To quantify the dose-dependent changes in the accumulation of mitochondrial superoxide, flow cytometric analysis of the stained cells was also performed. As shown in Fig. 1D, the amount of mitochondrial superoxide was increased after glutamate treatment in a concentration-dependent manner; the quantitative data showing the changes of mean fluorescence intensity are shown in Fig. 1E.
Figure 1. Induction of neuronal cell death in cultured HT22 cells by glutamate and hydrogen peroxide.

A and B. HT22 cells were treated with glutamate or hydrogen peroxide, respectively, at indicated concentrations for 24 h, and the cell viability was determined using the MTT assay. N = 5 for each group. Vertical error bars indicate standard deviation (S.D.). The experiment was repeated more than three times, and similar results were observed. A representative data set is shown. C. HT22 cells were treated with 4 or 8 mM glutamate for 8 h or with 500 μM hydrogen peroxide for 3 h. Cells were then stained with 5 μM MitoSOX Red (a mitochondrial superoxide indicator), and visualized using a fluorescence microscope. D and E. Quantitative data of the mitochondrial superoxide levels in glutamate-treated HT22 cells. Analysis was done by a flow cytometer.
The cytotoxicity of hydrogen peroxide (62.5–1000 μM) in cultured HT22 cells was also determined for comparison. Hydrogen peroxide dose-dependently inhibited the viability of HT22 cells, with an IC50 of approximately 400 μM (Fig. 1B). Treatment with 500 μM hydrogen peroxide for 3 h did not significantly increase the mitochondrial superoxide levels (Fig. 1C), which is very different from what was seen with glutamate.
Effect of SOD1 and SOD2 on glutamate-induced or hydrogen peroxide-induced oxidative cytotoxicity in HT22 cells
Knockdown approach
To characterize the protective role of SOD1 and SOD2 in glutamate-induced or hydrogen peroxide-induced oxidative stress in HT22 cells, we first prepared HT22 stable sub-lines with a selective knockdown of SOD1 or SOD2 using shRNA plasmids. To determine the proficiency of shRNA plasmids in selectively suppressing SOD1 or SOD2 expression, their protein levels were determined in transfected cells. As shown in Fig. 2A and 2B (Western blot data), the SOD1 protein expression was partially but selectively knocked down by approximately 50% in the SOD1 shRNA-transfected cells; similarly, the SOD2 protein was also partially but selectively knocked down (by approximately 30%) in the SOD2 shRNA-transfected cells. We also measured the SOD enzymatic activities in both cytosolic and mitochondrial fractions in these cells. As shown in Fig. 2C, the cytosolic SOD activity (namely, the SOD1 activity) was decreased by approximately 50% in the SOD1 shRNA-transfected cells, while the mitochondrial SOD activity (namely, the SOD2 activity) was decreased by 25% in the SOD2 shRNA-transfected cells.
Figure 2. Effect of SOD1 or SOD2 knockdown on the death of HT22 cells induced by glutamate or hydrogen peroxide.

A. HT22 cells were stably transfected with the SOD1 or SOD2 shRNA plasmid or with a scrambled non-targeting shRNA plasmid as described in Materials and Methods. Cell extracts were prepared and subjected to Western blotting of SOD1 and SOD2. Membranes were stripped and re-probed for GAPDH as a loading control. Shown are results from a representative experiment. B. Protein level was quantified using the Scion image software (Scion Corporation, Frederick, MD) and normalized as the ratio to GAPDH. C. Mitochondrial and cytosolic fractions were isolated from control cells as well as SOD1- and SOD2-knock down cells. The SOD enzymatic activity in each fraction was measured and normalized as a ratio relative to the control activity. D and E. Control and SOD-knockdown cells were treated with glutamate (D) or hydrogen peroxide (E), respectively, at indicated concentrations for 24 h. F. HT22 cells were transfected with the SOD1 siRNA or with a scrambled non-targeting siRNA as described in Materials and Methods. Cell extracts were prepared and subjected to Western blotting of SOD1 and SOD2. Membranes were stripped and re-probed for GAPDH as a loading control. Protein levels were quantified and normalized as the ratio to GAPDH. G and H. HT22 cells were transfected with scrambled siRNA or SOD1 siRNA. Forty-eight h later, cells were treated with glutamate (G) or hydrogen peroxide (H), respectively, at indicated concentrations for 24 h. Cell viability was determined using the MTT assay. Vertical error bars indicate standard deviation (S.D.), with N = 5 for each treatment group. The experiment was repeated over three times, and similar observations were made (a representative data set is shown). * P < 0.01, **P < 0.001.
Although the reduction of the final SOD1 or SOD2 protein levels in the transfected HT22 cells was relatively small, these small reductions had a very different effect on the sensitivity of these cells to glutamate-induced cytotoxicity. Cells with a partial SOD2 knockdown (~30% reduction) became markedly more sensitive to glutamate-induced cytotoxicity, but little or no change was seen with the SOD1-knockdown cells (Fig. 2D). In contrast, no significant difference was seen in the sensitivity to hydrogen peroxide-induced cytotoxicity between the control HT22 cells and cells with SOD1 or SOD2 knockdown (Fig. 2E). These results indicated that SOD2, but not SOD1, played a vital role in the protection against glutamate-induced oxidative stress, whereas neither enzyme played a significant role in altering hydrogen peroxide-induced oxidative cytotoxicity.
Because SOD1 expression level usually was much higher than the SOD2 level (Fig. 2A), it was suspected that a 50% reduction of the SOD1 level might not be sufficient to make a major difference in the cytosolic antioxidant capacity. Therefore, additional experiments were performed to suppress SOD1 expression further by using the small interfering RNA (siRNA). The SOD1 protein level in SOD1 siRNA-transfected cells was suppressed by 82.6 ± 1.3% compared with control siRNA-transfected cells (Fig. 2F). However, even with this more drastic reduction of SOD1 levels, we still did not see a significant difference in cell viability between the control siRNA- and SOD1 siRNA-transfected cells following treatment with either glutamate or hydrogen peroxide (Fig. 2G and 2H).
Overexpression approach
Next, we further determined the protective role of SOD2 in glutamate-induced oxidative stress using the SOD2 overexpression approach. It was shown earlier that the SOD2GFP fusion protein was localized in the mitochondria and retained its catalytic activity [24]. Prior to fluorescence-activated cell sorting, we confirmed the expression of the SOD2GFP fusion protein in the HT22 cells using Western blotting. As shown in Fig. 3A, HT22 cell sub-lines with low and high SOD2GFP expression were established. In these cells, SOD1 expression levels were not altered. Next, we confirmed the localization of the SOD2GFP protein using the fluorescence microscopy. As shown in Fig. 3B–3E, SOD2GFP-expressed cells were shown in green, along with Hoechst33342 staining for the nucleus and Mitotracker Red staining for the mitochondria. We found that SOD2GFP and Mitotracker Red were co-localized, thus confirming its localization in the mitochondria. Further, we measured the SOD activity in the cytosolic and mitochondrial fractions. The mitochondrial SOD activity (mainly SOD2 activity) was approximately doubled in the SOD2 expressing cells compared with that in control cells (Fig. 3F). However, the cytosolic SOD activity (mainly SOD1 activity) in the control and SOD2-overexpressing cells were not changed. When these HT22 cell sub-lines were treated with 4 or 6 mM glutamate for 24 h, the SOD2 high-expressing cells were significantly more resistant to glutamate-induced oxidative stress and cell death (Fig. 3G and 3H). In comparison, cells with low SOD2GFP expression only prevented them against the cytotoxicity induced by 2 mM glutamate, but not by higher concentrations of glutamate. Interestingly, these sub-lines of HT22 cells did not alter their sensitivity to hydrogen peroxide-induced oxidative cytotoxicity (Fig. 3I). Since glutamate treatment is known to deplete the intracellular GSH in HT22 cells [5–7, 27], we thus also investigated the effect of SOD2 on the intracellular GSH levels. As shown in Fig. 3J, the intracellular total GSH levels after glutamate treatment were decreased by approximately 80% compared to the vehicle treatment in both control and SOD2-overexpressing cells (Fig. 3J), but the reduction of ATP levels in glutamate-treated cells was completely abolished in SOD2-overexpressing cells (Fig. 3K).
Figure 3. Effect of SOD2 overexpression on glutamate- and hydrogen peroxide-induced cell death in HT22 cells.

A. Western blot analysis of extracts from cells transfected with the control vector or SOD2 expression vector. B–E. Cells with high SOD2 expression were stained with 500 nM MitoTracker Red and 500 nM Hoechst33342 for 20 min. Cells were visualized using a fluorescence microscope (B. SOD2GFP. C. MitoTracker Red. D. Hoechst33342. E. Merged image of three colors). F. Mitochondrial and cytosolic fractions were isolated from control cells and cells with high SOD2 expression. SOD enzymatic activity in each fraction was measured and normalized as the ratio to the control cells. G. Morphological changes of cells with low or high SOD2 expression following treatment with 6 mM glutamate for 24 h. H and I. Cells with low or high SOD2 expression were treated with glutamate (H) or hydrogen peroxide (I) at indicated concentrations for 24 h. Cell viability was determined using the MTT assay. J. Control cells and cells with high SOD2 expression were treated with 4 mM glutamate for 8 h. Total GSH levels were measured and normalized as the ratio to the non-treated cells. K. Control cells and cells with high SOD2 expression were treated with 4 mM glutamate for 8 h. ATP levels were measured and normalized as the ratio to the non-treated cells. Vertical error bars indicate standard deviation (S.D.), with N = 5 for each treatment group. The experiment was repeated over three times, and similar observations were made (a representative data set is shown). * P < 0.05, **P < 0.01.
Effect of SOD1 and SOD2 on mitochondrial superoxide, function and morphology in glutamate-treated HT22 cells
As shown in Fig. 4A, SOD2-knockdown cells had higher superoxide levels compared to control cells after treatment with 4 mM glutamate for 8 h. The quantitative data showing the changes of mitochondrial superoxide levels in SOD2-knockdown cells treated with 2 mM glutamate are shown in Fig. 4B. As expected, mitochondrial superoxide generation in cells over-expressing SOD2 was markedly diminished compared to control cells after treatment with 8 mM glutamate (Fig. 4C). In comparison, there was no appreciable difference between the control and SOD1-knockdown cells.
Figure 4. Effect of SOD expression levels on mitochondrial superoxide generation.

(A) HT22 cells with stable knockdown of SOD1 or SOD2 were treated with 4 mM glautamate for 8 h, and then stained with MitoSOX Red. Mitochondrial superoxide generation was visualized using a fluorescence microscope. (B) HT22 cells with stable knockdown of SOD1 or SOD2 were treated with 2 mM glautamate for 8 h, and then stained with MitoSOX Red. Quantitative analysis of mitochondrial superoxide was carried out using a flow cytometer. (C) HT22 cells with SOD2 high-expression were treated with 8 mM glutamate for 8 h, and then stained with MitoSOX Red. Mitochondrial superoxide generation was visualized using a fluorescence microscope. The experiment was repeated three times, and similar results were obtained (a representative data set was shown). Vertical error bars indicate standard deviation (S.D.), with N = 3 for each treatment group.
To determine the role of SOD2 in protecting mitochondrial function after treatment with glutamate, cells with selective SOD1 or SOD2 knockdown were treated with 4 mM glutamate for 12 h and then stained with DiOC6(3) for determination of mitochondrial membrane potential (MMP). MMP in SOD2-knockdown cells was significantly reduced after glutamate treatment compared to the control and SOD1-knockdown cells (Fig. 5A).
Figure 5. Effect of SOD1 or SOD2 knockdown on glutamate-induced mitochondrial dysfunction in HT22 cells.

A. Cells stably transfected with the SOD1 or SOD2 shRNA plasmid were treated with 4 mM glutamate. After 12-h incubation, cells were stained with DiOC6(3) and then mitochondrial membrane potential (MMP) was determined using a flow cytometer. Shown are results from a representative experiment. B–H. HT22 cells were treated with glutamate at indicated concentrations for 12 h before examination by transmission electron microscopy. B, C, and D. TEM images for the control shRNA plasmid-transfected HT22 cells. E. TEM image for SOD2-knockdown HT22 cells. F. TEM for SOD2 high expression cells. G and H. Enlarged TEM images of the intracellular organelles in the regions outlined with a box in panels B and E, respectively
Lastly, we also examined mitochondrial morphological changes using the transmission electron microscopy. In control HT22 cells, noticeable changes in mitochondrial morphology were detected after treatment with 2 mM glutamate (Fig. 5C), but after treatment with 4 mM glutamate, mitochondria became swollen and lost cristae (Fig. 5D; filled arrowhead). In SOD2-knockdown cells, mitochondria were significantly damaged even after treatment with 2 mM glutamate (Fig. 5E). On the other hand, mitochondria in SOD2-overexpressing cells were still intact and retained the cristae following 4 mM glutamate treatment (Fig. 5F; Open arrowhead). Enlarged mitochondria images from panels B and E were shown in panel G (as intact mitochondria) and panel H (as damaged mitochondria), respectively. These results showed that SOD2, but not SOD1, played a crucial role in protection of mitochondria against glutamate-induced oxidative stress.
DISSCUSSION
Recent animal studies showed that SOD2+/− heterozygous knockout mice coupled with amyloid precursor protein (APP) overexpression have markedly higher levels of accumulation of the brain β-amyloid (Aβ) peptide and Aβ plaques compared to SOD2+/+ mice [28]. Moreover, SOD2 reduction is also associated with an accelerated onset of APP/Aβ-dependent behavioral alterations [29]. These studies suggested an important protective role of the mitochondrial SOD2 in the development of Alzheimer’s disease. In the present study, we provided definitive evidence showing that the mitochondrial SOD2 plays a critical role in protecting HT22 neuronal cells against glutamate-induced oxidative toxicity. Specifically, we showed that selective knockdown of the mitochondrial SOD2 rendered these cells markedly more susceptible to glutamate-induced oxidative toxicity. The increased susceptibility was accompanied by an increased accumulation of the mitochondrial superoxide as well as the loss of normal mitochondrial morphology and functions at early time points following glutamate treatment. In addition, we also showed that selective overexpression of SOD2 in HT22 cells resulted in a strong reduction of mitochondrial superoxide levels, protection of its morphology and functions, and a strong resistance against glutamate-induced oxidative stress and cell death. In comparison, selective knockdown of the cytosolic SOD1 did not alter the susceptibility to glutamate-induced cell death.
Mitochondrial superoxide is produced as a byproduct of the oxidative phosphorylation [30, 31]. It is estimated that approximately 1–3% of mitochondrial oxygen consumed is incompletely reduced, which subsequently results in the formation of superoxide anion, a predominant formation of reactive oxygen species (ROS) in the mitochondria [30, 31]. There is mounting evidence suggesting that elevated mitochondrial superoxide production is a contributing factor in neurodegenerative diseases such as Parkinson’s disease, Alzheimer’s disease, and amyotrophic lateral sclerosis [23, 32]. For instance, oxidative damage was found to be a common early event in the brain of Alzheimer’s disease patients, well before the onset of significant pathology and clinical symptoms [33, 34]. In addition, an earlier study showed that melatonin prevented HT22 cells from glutamate-induced neurotoxicity through its strong antioxidant action in the mitochondria [35]. Similarly, coenzyme Q10 (MitoQ), a mitochondrial-targeting antioxidant that can modulate ROS-induced mitochondrial permeability change, was also found to have a strong protective effect in several in vitro and in vivo models of oxidative neurodegeneration [36]. The results of our present study of the mitochondrial SOD2 provided another line of evidence in support of a critical role of the mitochondrial superoxide in glutamate-induced oxidative neurotoxicity.
Earlier studies showed that glutamate at high concentrations will inhibit cystine uptake mediated by the glutamate/cystine antiporter, which subsequently results in low intracellular GSH levels, thereby promoting oxidative stress and cell death [5–7]. The results of our present study show that a drastic reduction of the total cellular GSH level likely is not a major cause of cell death. We found that while the total GSH level in SOD2-overespressing HT22 cells was similarly reduced by approximately 80% as seen in the control cells following glutamate treatment (Fig. 3J), the SOD2-overexpressing cells survived well whereas the control cells were mostly killed. The observation on cell viability is in line with an earlier study demonstrating that only 5–10% of the maximal ROS production is caused by GSH depletion, whereas the major source of ROS is from the mitochondrial electron transport chain [27].
As depicted in Fig. 6, it is hypothesized that SOD2, but not SOD1, can rapidly catalyze the conversion from more harmful mitochondrial superoxide to less harmful hydrogen peroxide. Because the accumulation of mitochondrial superoxide is more harmful than the accumulation of hydrogen peroxide, the neuroprotective effect of selective overexpression of the mitochondrial SOD2 is thus attributable to the accelerated conversion of the mitochondrial superoxide to the less reactive hydrogen peroxide. Because the total GSH level is markedly reduced due to inhibition of cystine uptake, glutathione peroxidase (GPx) pathway may not contribute importantly as usual to the conversion of hydrogen peroxide to water. It is expected that the heme oxygenase 1 (HO-1) pathway may play an important role in the detoxification of hydrogen peroxide. HO-1 is a mitochondrial enzyme, and a recent study showed that this enzyme was induced in HT22 cells following exposure to hydrogen peroxide [37]. Mechanistically, the neuroprotective effect of the mitochondrial HO-1 is mediated via the formation of biliverdin and bilirubin during heme degradation, both of which can serve as scavengers of the mitochondrial ROS [38, 39]. In support of the suggested neuroprotective role of HO-1, an earlier study showed that induction of HO-1 played a critical role in protection of neuronal cells against acute oxidative stress induced by hydrogen peroxide or 4-hydroxynonenal [37]. Besides the HO-1 pathway, another mitochondrial pathway that may also contribute to the detoxification of hydrogen peroxide is the catalase pathway [40]. However, since catalase is only present in the mitochondria of some tissues [40], further studies are needed to ascertain the role of this pathway in the detoxification of the mitochondrial hydrogen peroxide.
Figure 6. A putative scheme depicting the mitochondrial superoxide detoxification pathways in SOD2-overexpressing HT22 neuronal cells.
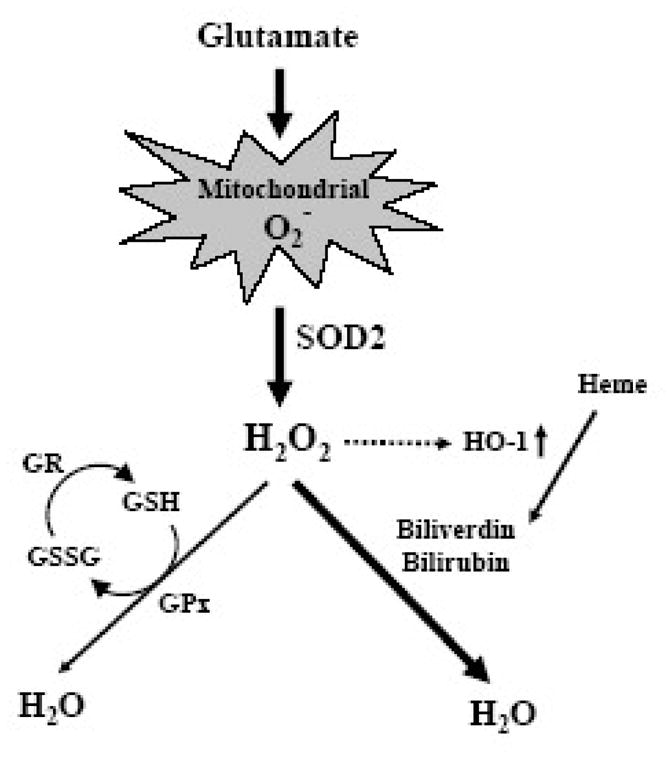
SOD2, but not SOD1, mediates the conversion of the highly cytotoxic mitochondrial superoxide (O2−) to hydrogen peroxide (H2O2). Hydrogen peroxide can be further detoxified by different pathways. Because the total glutathione (GSH) level is markedly reduced following glutamate treatment, it is likely that the glutathione peroxidase (GPx) pathway may not contribute importantly as usual to the conversion of hydrogen peroxide to water. In comparison, the mitochondrial HO-1 pathway is expected to play a more important role in detoxifying hydrogen peroxide. HO-1 inactivates hydrogen peroxide indirectly via the formation of biliverdin and bilirubin, both of which can serve as effective ROS scavengers. Notably, an earlier study [37] reported that HO-1 is inducible following exposure to hydrogen peroxide, thus suggesting that the HO1 pathway may play a critical role in the protection against glutamate-induced neuronal damage. The abbreviations used: GSSG, oxidized form of glutathione; GR, glutathione reductase.
Different from glutamate-induced changes, exposure of HT22 cells to hydrogen peroxide did not markedly induce superoxide accumulation and damage in the mitochondria. This distinct difference likely is because the exogenously-added hydrogen peroxide mostly targets proteins and lipids in the cytosolic compartment, as observed in an earlier study showing that the highest levels of protein oxidation following hydrogen peroxide exposure were seen in the cytosol [41].
In summary, the results of our present study showed that the mitochondrial SOD2, but not the cytosolic SOD1, plays a crucial role in protecting neuronal cells against glutamate-induced oxidative stress and death in HT22 cells. The marked difference in the neuroprotective ability of the mitochondrial SOD2 vs the cytosolic SOD1 suggests that mitochondrial oxidative stress is a critical early event in glutamate-induced neuronal cytotoxicity, ultimately resulting in oxidative neuronal death. These observations also suggest that selective induction of the mitochondrial SOD2 in the nervous system may represent an effective therapeutic strategy against oxidative stress-induced neuronal death.
Acknowledgments
1. This work was supported, in part, by a grant from the National Institutes of Health (Grant No. ES15242).
2. We would like to thank Dr. Joyce Slusser for technical assistance with the flow cytometric analysis.
ABBREVIATIONS
- SOD
superoxide dismutase
- ROS
reactive oxygen species
- GSH
glutathione
- MMP
mitochondrial membrane potential
- GLU
glutamate
- shRNA
short-hairpin RNA
- siRNA
small interfering RNA
- PD
Parkinson’s disease
- AD
Alzheimer’s disease
- GFP
green fluorescent protein
- TEM
transmission electron microscopy
- HO-1
heme oxygenase 1
Footnotes
Publisher's Disclaimer: This is a PDF file of an unedited manuscript that has been accepted for publication. As a service to our customers we are providing this early version of the manuscript. The manuscript will undergo copyediting, typesetting, and review of the resulting proof before it is published in its final citable form. Please note that during the production process errors may be discovered which could affect the content, and all legal disclaimers that apply to the journal pertain.
References
- 1.Coyle JT, Puttfarcken P. Oxidative stress, glutamate, and neurodegenerative disorders. Science. 1993;262:689–695. doi: 10.1126/science.7901908. [DOI] [PubMed] [Google Scholar]
- 2.Blandini F, Porter RH, Greenamyre JT. Glutamate and Parkinson’s desease. Mol Neurobiol. 1996;12:73–94. doi: 10.1007/BF02740748. [DOI] [PubMed] [Google Scholar]
- 3.Choi DW. Glutamate neurotoxicity and diseases of nervous system. Neuron. 1988;1:623–634. doi: 10.1016/0896-6273(88)90162-6. [DOI] [PubMed] [Google Scholar]
- 4.Choi DW. Exitotoxic cell death. J Neurobiol. 1992;23:1261–1276. doi: 10.1002/neu.480230915. [DOI] [PubMed] [Google Scholar]
- 5.Tan S, Wood M, Maher P. Oxidative stress induces a form of programmed cell death with characteristics of both apoptosis and necrosis in neuronal cells. J Neurochem. 1998;71:95–105. doi: 10.1046/j.1471-4159.1998.71010095.x. [DOI] [PubMed] [Google Scholar]
- 6.Murphy TH, Miyamoto M, Sastre A, Schnaar RL, Coyle JT. Glutamate toxicity in a neuronal cell line involves inhibition of cystine transport leading to oxidative stress. Neuron. 1989;2:1547–1558. doi: 10.1016/0896-6273(89)90043-3. [DOI] [PubMed] [Google Scholar]
- 7.Maher P, Davis JB. The role of monoamine metabolism in oxidative glutamate toxicity. J Neurosci. 1996;16:6394–6401. doi: 10.1523/JNEUROSCI.16-20-06394.1996. [DOI] [PMC free article] [PubMed] [Google Scholar]
- 8.Tan S, Schubert D, Maher P. Oxytosis: A novel form of programmed cell death. Curr Top Med Chem. 2001;1:497–506. doi: 10.2174/1568026013394741. [DOI] [PubMed] [Google Scholar]
- 9.Stanciu M, Wang Y, Kentor R, Burke N, Watkins S, Kress G, Reynolds I, Klann E, Angiolieri MR, Johnson JW, DeFranco DB. Persistent activation of ERK contributes to glutamate-induced oxidative toxicity in a neuronal cell line and primary cortical neuron cultures. J Biol Chem. 2001;275:12200–12206. doi: 10.1074/jbc.275.16.12200. [DOI] [PubMed] [Google Scholar]
- 10.Choi BH, Hur EM, Lee JH, Jun DJ, Kim KT. Protein kinase Cdelta-mediated proteasomal degradation of MAP kinase phosphatase-1 contributes to glutamate-induced neuronal cell death. J Cell Sci. 2006;119:1329–1340. doi: 10.1242/jcs.02837. [DOI] [PubMed] [Google Scholar]
- 11.Suh HW, Kang S, Kwon KS. Curcumin attenuates glutamate-induced HT22 cell death by suppressing MAP kinase signaling. Mol Cell Biochem. 2007;298:187–194. doi: 10.1007/s11010-006-9365-6. [DOI] [PubMed] [Google Scholar]
- 12.Zhang Y, Bhavnani BR. Glutamate-induced apoptosis in neuronal cells is mediated via caspase-dependent and independent mechanisms involving calpain and caspase-3 proteases as well as apoptosis inducing factor (AIF) and this process is inhibited by equine estrogens. BMC Neurosci. 2006;7:49. doi: 10.1186/1471-2202-7-49. [DOI] [PMC free article] [PubMed] [Google Scholar]
- 13.Fukui M, Song JH, Choi JY, Choi HJ, Zhu BT. Mechanism of glutamate-induced neurotoxicity in HT22 mouse hippocampal cells. Eur J Pharmacol. 2009;617:1–11. doi: 10.1016/j.ejphar.2009.06.059. [DOI] [PubMed] [Google Scholar]
- 14.Ishige K, Schubert D, Sagara Y. Flavonoids protect neuronal cells from oxidative stress by three distinct mechanisms. Free Radic Biol Med. 2001;30:433–446. doi: 10.1016/s0891-5849(00)00498-6. [DOI] [PubMed] [Google Scholar]
- 15.Behl C. Vitamin E protects neurons against oxidative cell death in vitro more effectively than 17-beta estradiol and induces the activity of the transcription factor NF-kappaB. J Neural Transm. 2000;107:393–407. doi: 10.1007/s007020070082. [DOI] [PubMed] [Google Scholar]
- 16.Halliwell B, Gutteridge JMC. Protection against oxidants in biological systems: the superoxide theory of oxygen toxicity. In: Halliwell B, Gutteridge JMC, editors. Free Radical in Biology and medicine. Oxford, UK: Clarendon; 1995. pp. 86–187. [Google Scholar]
- 17.Ookawara T, Imazeki N, Matsubata O, Kizaki T, Oh-Ishi S, Nakao C, Sato Y, Ohno H. Tissue distribution of immunoreactive mouse extracellular superoxide dismutase. Am J Physiol Cell Physiol. 1998;275:840–847. doi: 10.1152/ajpcell.1998.275.3.C840. [DOI] [PubMed] [Google Scholar]
- 18.Melov S, Coskun P, Patel M, Tuinsta R, Cottrell B, Jun AS, Zastawny TH, Dizdaroglu M, Goodman SI, Huang TT, Miziorko H, Epstein CJ, Wallace DC. Mitochondrial disease in superoxide dismutase 2 mutant mice. Proc Natl Acad Sci USA. 1999;96:846–851. doi: 10.1073/pnas.96.3.846. [DOI] [PMC free article] [PubMed] [Google Scholar]
- 19.Reaume AG, Elliott JL, Hoffman EK, Kowall NW, Ferrante RJ, Siwek DF, Wilcox HM, Flood DG, Beal MF, Brown RJ, Scott RW, Snider WD. Motor neurons in Cu/Zn superoxide dismutase-deficient mice develop normally but exhibit enhanced cell death after axonal injury. Nat Genet. 1996;1:43–47. doi: 10.1038/ng0596-43. [DOI] [PubMed] [Google Scholar]
- 20.Carlson LM, Jonsson J, Edlund T, Marklund SL. Mice lacking extracellular superoxide dismutase are more sensitive to hyperoxia. Proc Natl Acad Sci USA. 1995;92:6264–6268. doi: 10.1073/pnas.92.14.6264. [DOI] [PMC free article] [PubMed] [Google Scholar]
- 21.Andersen JK. Oxidative stress in neurodegeneration: Cause or consequence? Nat Med. 2004;10:S18–S25. doi: 10.1038/nrn1434. [DOI] [PubMed] [Google Scholar]
- 22.Niizuma K, Endo H, Chan PH. Oxidative stress and mitochondrial dysfunction as determinants of ischemic neuronal death and survival. J Neurochem. 2009;109:133–138. doi: 10.1111/j.1471-4159.2009.05897.x. [DOI] [PMC free article] [PubMed] [Google Scholar]
- 23.Lin MT, Beal MF. Mitochondrial dysfunction and oxidative stress in neurodegenerative diseases. Nature. 2006;443:787–795. doi: 10.1038/nature05292. [DOI] [PubMed] [Google Scholar]
- 24.Connor KM, Subbaram S, Regan KJ, Nelson KK, Mazurkiewicz JE, Bartholomew PJ, Aplin AE, Tai YT, Aguirre-Ghiso J, Flores SC, Melendez A. Mitochondrial H2O2 regulates the angiogenic phenotype via PTEN oxidation. J Biol Chem. 2005;280:16916–16924. doi: 10.1074/jbc.M410690200. [DOI] [PubMed] [Google Scholar]
- 25.Mukhopadhyay P, Rajesh M, Yoshihiro K, Haskó G, Pacher P. Simple quantitative detection of mitochondrial superoxide production in live cells. Biochem Biophys Res Commun. 2007;358:203–208. doi: 10.1016/j.bbrc.2007.04.106. [DOI] [PMC free article] [PubMed] [Google Scholar]
- 26.Hanaichi T, Sato T, Iwamoto T, Malavasi-Yamashiro J, Hoshino M, Mizuno N. A stable lead by modification of Sato’s method. J Electron Microsc. 1986;35:304–306. [PubMed] [Google Scholar]
- 27.Tan S, Sagara Y, Liu Y, Maher P, Schubert D. The regulation of reactive oxygen species production during programmed cell death. J Cell Biol. 1998;141:1423–1432. doi: 10.1083/jcb.141.6.1423. [DOI] [PMC free article] [PubMed] [Google Scholar]
- 28.Li F, Calingasan NY, Yu F, Mauck WM, Toidze M, Almeida CG, Takahashi RH, Carlson GA, Flint Beal M, Lin MT, Gouras GK. Increased plaque burden in brains of APP mutant MnSOD heterozygous knockout mice. J Neurochem. 2004;89:1308–1312. doi: 10.1111/j.1471-4159.2004.02455.x. [DOI] [PubMed] [Google Scholar]
- 29.Esposito L, Raber J, Kekonius L, Yan F, Yu GQ, Bien-Ly N, Puoliväli J, Scearce-Levie K, Masliah E, Mucke L. Reduction in mitochondrial superoxide dismutase modulates Alzheimer’s disease-like pathology and accelerates the onset of behavioral changes in human amyloid precursor protein transgenic mice. J Neurosci. 2006;26:5167–179. doi: 10.1523/JNEUROSCI.0482-06.2006. [DOI] [PMC free article] [PubMed] [Google Scholar]
- 30.Chance B, Sies H, Boveris A. Hydroperoxide metabolism in mammalian organs. Physiol Rev. 1979;59:527–605. doi: 10.1152/physrev.1979.59.3.527. [DOI] [PubMed] [Google Scholar]
- 31.Kudin AP, Bimpong-Buta NY, Vielhaber S, Elger CE, Kunz WS. Characterization of Superoxide-producing Sites in Isolated Brain Mitochondria. J Biol Chem. 2004;279:4127–4135. doi: 10.1074/jbc.M310341200. [DOI] [PubMed] [Google Scholar]
- 32.Sompol P, Ittarat W, Tangpong J, Chen Y, Doubinskaia I, Batinic-Haberle I, Abdul HM, Butterfield DA, St Clair DK. A neuronal model of Alzheimer’s disease: an insight into the mechanisms of oxidative stress-mediated mitochondrial injury. Neuroscience. 2008;153:120–130. doi: 10.1016/j.neuroscience.2008.01.044. [DOI] [PMC free article] [PubMed] [Google Scholar]
- 33.Nunomura A, Perry G, Aliev G, Hirai K, Takeda A, Balraj EK, Jones PK, Ghanbari H, Wataya T, Shimohama S, Chiba S, Atwood CS, Petersen RB, Smith MA. Oxidative damage is the earliest event in Alzheimer disease. J Neuropathol Exp Neurol. 2001;60:759–767. doi: 10.1093/jnen/60.8.759. [DOI] [PubMed] [Google Scholar]
- 34.Smith MA, Perry G, Richey PL, Sayre LM, Anderson VE, Beal MF, Kowall N. Oxidative damage in Alzheimer’s. Nature. 1996;382:120–121. doi: 10.1038/382120b0. [DOI] [PubMed] [Google Scholar]
- 35.Herrera F, Martin V, García-Santos G, Rodriguez-Blanco J, Antolín I, Rodriguez C. Melatonin prevents glutamate-induced oxytosis in the HT22 mouse hippocampal cell line through an antioxidant effect specifically targeting mitochondria. J Neurochem. 2007;100:736–746. doi: 10.1111/j.1471-4159.2006.04228.x. [DOI] [PubMed] [Google Scholar]
- 36.Armstrong JS. Mitochondrial medicine: Pharmacological targeting of mitochondria in disease. Br J Pharmacol. 2007;151:1154–65. doi: 10.1038/sj.bjp.0707288. [DOI] [PMC free article] [PubMed] [Google Scholar]
- 37.Kaizaki A, Tanaka S, Ishige K, Numazawa S, Yoshida T. The neuroprotective effect of heme oxygenase (HO) on oxidative stress in HO-1 siRNA-tansfected HT22 cells. Brain Res. 2006;1108:39–44. doi: 10.1016/j.brainres.2006.06.011. [DOI] [PubMed] [Google Scholar]
- 38.Otterbein LE, Choi AM. Heme oxygenase: colors of defense against cellular stress. Am J Physiol Lung Cell Mol Physiol. 2000;279:1029–1037. doi: 10.1152/ajplung.2000.279.6.L1029. [DOI] [PubMed] [Google Scholar]
- 39.Stocker R, Yamamoto Y, McDonagh AF, Glazer AN, Ames BN. Bilirubin is an antioxidant of possible physiological importance. Science. 2000;235:1043–1045. doi: 10.1126/science.3029864. [DOI] [PubMed] [Google Scholar]
- 40.Salvi M, Battaglia V, Brunati AM, La Rocca N, Tibaldi E, Pietrangeli P, Marcocci L, Mondovì B, Rossi CA, Toninello A. Catalase takes part in rat liver mitochondria oxidative stress defense. J Biol Chem. 2007;282:24407–24415. doi: 10.1074/jbc.M701589200. [DOI] [PubMed] [Google Scholar]
- 41.Jung T, Engels M, Kaiser B, Poppek D, Grune T, Grune T. Intracellular distribution of oxidized proteins and proteasome in HT22 cells during oxidative stress. Free Radic Biol Med. 2006;40:1303–1312. doi: 10.1016/j.freeradbiomed.2005.11.023. [DOI] [PubMed] [Google Scholar]