Abstract
The arterial pulse has historically been an essential source of information in the clinical assessment of health. With current sphygmomanometric and oscillometric devices, only the peak and trough of the peripheral arterial pulse waveform are clinically used. Several limitations exist with peripheral blood pressure. First, central aortic pressure is a better predictor of cardiovascular outcome than peripheral pressure. Second, peripherally obtained blood pressure does not accurately reflect central pressure because of pressure amplification. Lastly, antihypertensive medications have differing effects on central pressures despite similar reductions in brachial blood pressure. Applanation tonometry can overcome the limitations of peripheral pressure by determining the shape of the aortic waveform from the radial artery. Waveform analysis not only indicates central systolic and diastolic pressure but also determines the influence of pulse wave reflection on the central pressure waveform. It can serve as a useful adjunct to brachial blood pressure measurements in initiating and monitoring hypertensive treatment, in observing the hemodynamic effects of atherosclerotic risk factors, and in predicting cardiovascular outcomes and events. Radial artery applanation tonometry is a noninvasive, reproducible, and affordable technology that can be used in conjunction with peripherally obtained blood pressure to guide patient management. Keywords for the PubMed search were applanation tonometry, radial artery, central pressure, cardiovascular risk, blood pressure, and arterial pulse. Articles published from January 1, 1995, to July 1, 2009, were included in the review if they measured central pressure using radial artery applanation tonometry.
ABI = ankle brachial index; Aix = augmentation index; AP = augmentation pressure; ARB = angiotensin II receptor blocker; AT = applanation tonometry; CAD = coronary artery disease; CIMT = carotid intima-media thickness; DD = diastolic dysfunction; ET = ejection time; HLD = hyperlipidemia; HR = heart rate; LV = left ventricular; OSA = obstructive sleep apnea; PP = pulse pressure; PWV = pulse wave velocity; SBP = systolic blood pressure; SHS = Strong Heart Study; Tr = time to reflection
Applanation tonometry (AT) is a noninvasive, reproducible, and accurate representation of the aortic pressure waveform.1 Measurement of the aortic waveform can provide clinically useful information beyond brachial-measured blood pressure. A trove of information can be gleaned from the shape, amplitude, and duration of the waveform that provides insights into the diagnosis and management of many disease states, including hypertension, coronary artery disease (CAD), obstructive sleep apnea (OSA), diabetes, and diastolic dysfunction (DD). This review aims to provide the clinician with an understanding of the central pressure waveform and its application to patient management. PubMed was searched for all articles referencing radial artery AT from January 1, 1995, to July 1, 2009. The following keywords were used in the search: applanation tonometry, radial artery, central pressure, cardiovascular risk, blood pressure, and arterial pulse. Articles were included in the report if they used AT from the radial and not the carotid artery in their analysis.
HISTORICAL PERSPECTIVE ON PULSE WAVE ANALYSIS
The physical examination of the human arterial pulse by healers and medical professionals has historically been important in assessing health. Descriptions from Egypt in the Edwin Smith Papyrus dating to 1600 bc contain references to the examination of the pulse.2 In 6th century bc Chinese medicine, the palpation of the pulse was the only part of the physical examination that a male physician could perform on a female patient, provided that he was separated from her by a bamboo curtain.3
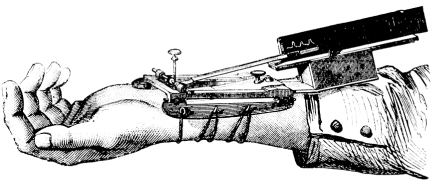
Modern recording of the pulse waveform became possible through the invention of the sphygmograph by Etienne Jules Marey in 1860 (Figure 1).4 The introduction of cardiac catheterization by Werner Forssman in 1929 further added valuable data to the correlation between central vascular pressures and the peripheral pulse waveform. Cournand and Ranges successfully placed catheters in the right atrium in living humans, paving the way for physiologic exploration of the cardiopulmonary system.5 Earl H. Wood and Edwin J. Kroeker laid the foundation for the concept of the vascular tree responding to the pressure wave from each heart beat in a classic frequency amplitude response curve.6 They also observed that amplification of blood pressure from the aorta to the periphery occurs as a result of an increase in systolic pressure and that the reflection of the cardiac pressure impulse at the level of the peripheral vasculature shapes the peripheral and central pulse waveforms.7
FIGURE 1.
Sphygmograph by Etienne Jules Marey in 1860.
LIMITATIONS OF PERIPHERAL PRESSURE
With the advent of sphygmomanometry after Scipione Riva-Rocci in the late 19th century, physicians focused only on the pressure waveform peak (systole) and trough (diastole) and ignored the rest of the arterial pressure waveform. Several limitations exist with peripheral blood pressures obtained with either a sphygmomanometer or an oscillometric device. First, central pressures seem to be a more accurate predictor of cardiovascular events than peripheral pressures.8-10 Second, despite similar reductions in peripheral blood pressure, cardiovascular outcomes may differ between different classes of antihypertensive medications, and this difference could be due to their variable effects on central pressure.11-14 Finally, peripheral systolic pressures, primarily measured from the brachial artery, do not represent pressure as recorded in the aorta and central arteries because of peripheral amplification.15,16 For example, several reports in large populations have demonstrated a 60% to 70% overlap in central pressures between groups classified by current hypertension guidelines.15,16 This overlap can be explained by the observation that brachial–central pressure differences vary by 1 to 33 mm Hg.15,17 Another example of peripheral amplification is spurious systolic hypertension of youth, in which extreme peripheral amplification leads to an elevated isolated systolic pressure despite normal central pressures.18
RADIAL ARTERY AT
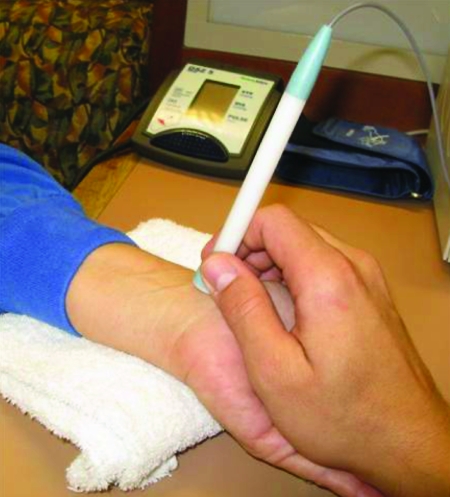
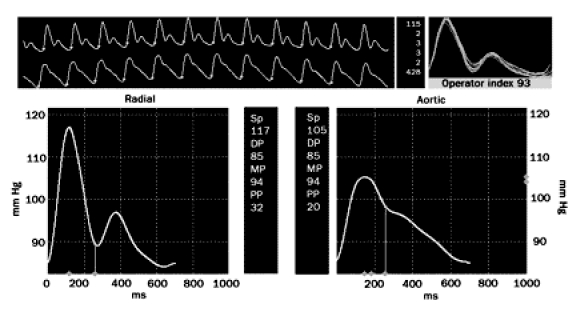
The limitations of peripheral blood pressure measurements may be overcome with AT. Tonometry of the radial artery provides an accurate, reproducible, noninvasive assessment of the central pulse pressure (PP) waveform. Tonometry means “measuring of pressure,” whereas applanation means “to flatten.” Radial artery AT is performed by placing a hand-held tonometer (strain gauge pressure sensor) over the radial artery and applying mild pressure to partially flatten the artery (Figure 2). The radial artery pressure is then transmitted from the vessel to the sensor (strain gauge) and is recorded digitally. A mathematical formula using a fast Fourier transformation has resulted in a Food and Drug Administration–approved algorithm that permits derivation and calculation of central pressure indices from a peripheral brachial blood pressure and concomitant recording of a PP wave with radial tonometry (Figure 3).19 Transfer functions are fairly accurate in predicting central pressures.19-21 Measurements of central pressures with AT are easily reproducible even in the hands of novices.22,23 Radial artery AT, as opposed to carotid artery evaluation, is more comfortable for the patient and is easier to use in the clinical setting.24
FIGURE 2.
Applanation tonometry is performed by placing a pressure sensor over the radial artery. Pictured is the SphygmoCor device (AtCor Medical, Sydney, Australia).
FIGURE 3.
Radial artery applanation tonometry recording of a 41-yr-old man. The upper long panel shows the radial pressure waveform above the derived central pressure waveform. The bottom left panel demonstrates a magnified radial arterial waveform. Systolic and diastolic pressures are 117/85 mm Hg. The bottom right panel provides a magnified derived central pressure waveform. Central pressure is 105/85 mm Hg.
CENTRAL PRESSURE WAVEFORM
Understanding AT requires comprehension of pressure waveform physiology. The pressure wave contour in any artery is the result of the summation of the forward transmission of the cardiac pressure impulse and a backward reflection generated by the peripheral vascular system at the interface between large arteries and resistance vessels (arteries and arterioles). The reflected wave has high velocities and is reflected back to the central arteries during the same ejection cycle of the heart. Pressure recorded anywhere in the arterial system is thus the sum of the forward wave and the reflected wave and is dependent on 3 factors: the amplitude and duration of ventricular ejection, the amplitude of the reflected wave, and the velocity of the reflected wave from the periphery.
These 3 key parameters are influenced by several important factors. Central systolic blood pressure (SBP) increases with age. Before age 50 years the increase in central SBP is primarily due to greater wave reflection amplitude; however, after age 50 years pulse wave velocity (PWV) increases, leading to augmentation of central SBP.25 A slower heart rate (HR) leads to a longer ejection time (ET), increasing the likelihood that the reflected wave will return earlier during the cardiac cycle, thereby augmenting systole. Conversely, an elevated HR has a faster ejection period, and the reflected wave returns later in the cardiac cycle.26 Small stature leads to an earlier return of the reflected wave because points of reflection in the vascular tree are closer to the aorta. With increased height, the wave reflection sites are farther from the aorta, and the reflected wave returns at a later point in the cardiac cycle.27,28 Lower diastolic pressure, reflecting lower systemic vascular resistance, reduces the magnitude of wave reflection. Women have more augmentation of central pressure via the reflected wave than men; however, men have a faster PWV.27
PULSE WAVE VELOCITY
Although not part of the routine measurement of radial AT, the concept of PWV should be familiar to all clinicians. Pulse wave velocity is described by the Moens-Korteweg equation derived in the 1920s that relates PWV to vessel distensibility: c0 = √Eh/2Rρ, where c0 is the wave speed, E is Young modulus in the circumferential direction, h is wall thickness, R is vessel radius, and ρ is the density of fluid. Aortic PWV is usually measured between the carotid and femoral artery. Normal values in the typical middle-aged adult are 4 m/s in the ascending aorta, 5 m/s in the abdominal aorta and carotids, 7 m/s in the brachial artery, and 8 m/s in the iliac arteries.29 Factors that cause less distensibility (“stiffness”) of the vessel lead to a faster PWV. Advancing age also leads to a faster PWV.25 Atherosclerotic risk factors lead to vascular remodeling, creating arterial “stiffness” within the aorta and other large arteries.30 Pulse wave velocity increases proportionally to the number of cardiovascular risk factors present.31 It is associated with fitness level,32 cardiovascular events,33 and mortality in patient populations with end-stage renal disease,9 diabetes,34 and metabolic syndrome,35 as well as in healthy elderly adults.36
PATHOPHYSIOLOGY OF WAVE REFLECTION
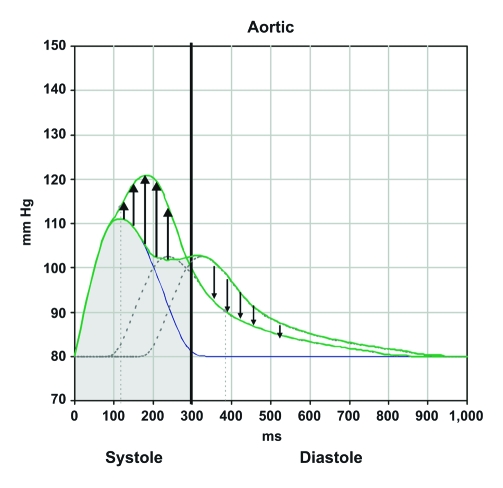
Wave reflection is an integral part of the central pulse waveform. The interface between the larger arteries and resistance vessels will instantaneously reflect the incoming cardiac pressure pulse wave. A pressure wave returning during the systolic ejection period due to an increased PWV, a more proximal site of wave reflection, or prolonged ET will likely augment systole (Figure 4). Systolic augmentation leads to increased cardiac loading and over time may lead to left ventricular (LV) hypertrophy, systolic or diastolic heart failure, left atrial strain and enlargement, and atrial fibrillation as well as atrial fibrillation–associated thromboembolic disease. Absence of diastolic augmentation could potentially aggravate myocardial ischemia. Conversely, decreased PWV, more distal reflecting sites, and a shorter ET may result in a reflected wave that augments the diastolic component of the central pressure waveform. The arrival of this reflected wave in diastole augments coronary arterial blood flow and decreases LV systolic workload. Hypertension management should focus on treatments that decrease the amplitude of the returning wave, slow the velocity of wave reflection, and/or increase the distance between the aorta and sites of reflection.
FIGURE 4.
Reflection of the pulse wave during the systolic period leads to an increase in left ventricular workload (black upward arrows) and a decrease in the diastolic pressure (black downward arrows). Reflection of the pulse wave during the diastolic period leads to a decrease in ventricular workload and an increase in diastolic pressures.
CENTRAL PRESSURE MEASUREMENTS
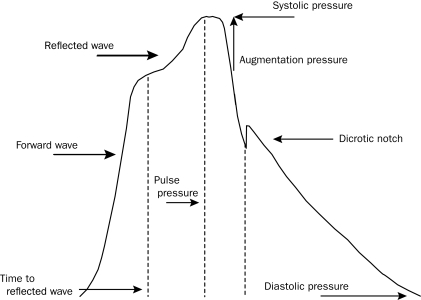
Derivation of the central pressure waveform by AT allows the measurement of central pressures. Central SBP, diastolic blood pressure, and PP can easily be determined by measuring the peak and trough of the central pressure waveform. Augmentation of the central pressure can be quantified as the amount of pressure added to the systolic pressure peak based on the reflected wave. This pressure is referred to as augmentation pressure (AP) (Figure 5). The ratio of the AP to the central PP (systolic-diastolic pressure) is referred to as the augmentation index (Aix) and is expressed as a percentage. This measurement represents the percentage of central PP that is constituted by the AP. For ease of comparison for different HRs, the Aix is often reported normalized to an HR of 75 beats/min. Ejection time can also be calculated by defining the distance from the onset of the pulse wave to the dicrotic notch on the descending side of the waveform. Time to reflection (Tr) is defined as the time between the onset of the pulse waveform and the onset of the reflected systolic central waveform.
FIGURE 5.
Central pulse pressure waveform. Systolic and diastolic pressures are the peak and trough of the waveform. Augmentation pressure is the additional pressure added to the forward wave by the reflected wave. Augmentation index is the ratio between augmentation pressure and central pulse pressure. The dicrotic notch represents closure of the aortic valve and is used to calculate ejection duration. Time to wave reflection is calculated at the point of rise in the initial ejection wave to the onset of the reflected wave. The reflected wave in this central pressure waveform results in augmentation of systolic flow.
NORMAL CENTRAL PRESSURE VALUES
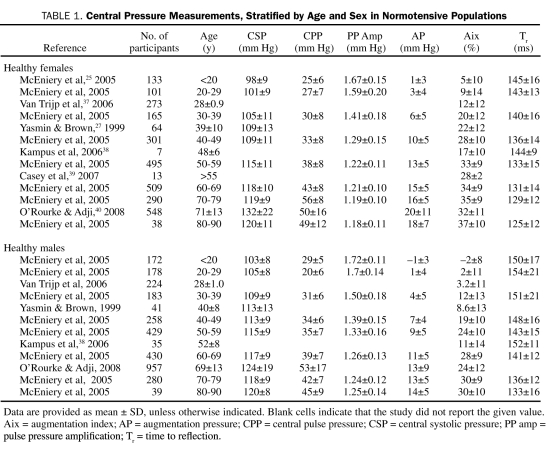
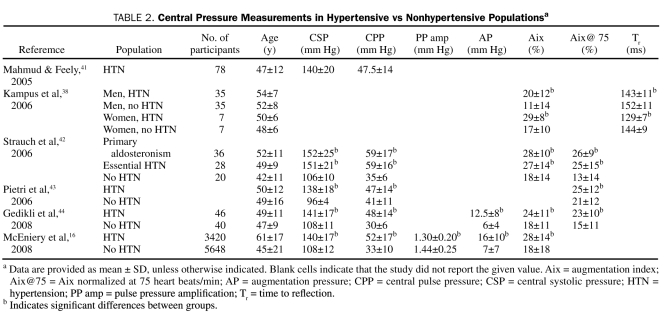
The current limitation with measuring central pressures via radial artery AT is that neither the age-, sex-, and ethnicity-specific reference ranges nor the specific central pressure treatment targets have been well defined. Central pressure measurements by radial artery AT are rarely described according to age and sex in healthy populations (Table 1) or between hypertensive and nonhypertensive populations (Table 2).
TABLE 1.
Central Pressure Measurements, Stratified by Age and Sex in Normotensive Populations
TABLE 2.
Central Pressure Measurements in Hypertensive vs Nonhypertensive Populationsa
For its age- and sex-specific reference ranges, AtCor Medical applanation tonometer software (AtCor Medical, West Ryde, New South Wales, Australia) uses measurements from 4001 healthy, normotensive participants in the Anglo-Cardiff Collaboration Trial.25 Overall, mean ± SD central SBP increases with age, is lower in women than men until the sixth decade of life, and reaches a maximum of 120±8 mm Hg in men and 120±11 mm Hg in women. Central PP is higher in women after the fifth decade of life. Both AP and Aix increase with age in both sexes; however, unlike central SBP, they are higher in women than men for a given age group. For healthy people, initiation of blood pressure–lowering strategies may be considered in patients older than 40 years when central SBP is greater than 121 mm Hg (both sexes) and central PP is more than 50 mm Hg in women and 45 mm Hg in men. Increases and trends in AP or Aix of 1 SD above the mean may alert the clinician to vascular changes associated with atherosclerotic risk factors.
CLINICAL OUTCOMES
Radial artery AT may be more predictive of clinical cardiovascular events than peripheral cuff pressures. In the CAFE (Conduit Artery Function Evaluation) study,11 hypertensive patients taking atenolol with or without thiazide had more cardiovascular events compared with those taking amlodipine with or without perindopril, despite similar reductions in brachial systolic pressure and PP.11 Differences in central pressures may have been responsible for the discrepancies in cardiovascular outcomes (atenolol: central SBP, 125.5 mm Hg; central PP, 46.4 mm Hg; amlodipine: central SBP, 121.2 mm Hg; central PP, 43.4 mm Hg; P<.001). Analysis of participants in the SHS (Strong Heart Study)45 demonstrated that a central PP of greater than 50 mm Hg, not brachial PP, was an independent predictor of cardiovascular outcomes, regardless of age, sex, or diabetic status. Analysis of a different SHS cohort revealed that mean ± SD central SBP and central PP differed significantly between groups with and without cardiovascular events (event group: central SBP, 127±22 mm Hg; central PP, 48±18 mm Hg; no event group: central SBP, 121±17 mm Hg; central PP, 41±15 mm Hg; P<.001).8 Furthermore, central PP was strongly associated with carotid intimamedia thickness (CIMT), plaque score, and vascular mass and was a stronger predictor of cardiovascular events than brachial PP (hazard ratio, 1.15 per 10 mm Hg; χ2=13.4; P<.001 vs hazard ratio, 1.10; χ2=6.9; P=.008).
Central pressures may predict cardiovascular outcomes in select populations. In SAFFIHRE (Study of Atrial Fibrillation in High Risk Elderly), central, not peripheral, blood pressure predicted the incidence of atrial fibrillation in 800 elderly participants (>65 years) with a mean ± SD follow-up of greater than 1.5±1.1 years.46 In participants undergoing coronary angiography, increasing tertiles of Aix corrected for a HR of 75 beats/min (−19% to 18%, 19% to 25%, and 26% to 53%) were associated with an increased incidence of death, myocardial infarction, and stent restenosis.47 Scores on Aix correlate with the Framingham risk score in young women.37 Young black men have greater Aix and greater mean ± SD central SBP compared with young white men (blacks: 112±2 mm Hg; whites: 107±1 mm Hg; P=.029), despite similar brachial blood pressures between the 2 racial groups.48 Discrepant cardiovascular outcomes between ethnic groups49 may be partially explained by central pressure differences.
ANTIHYPERTENSIVE THERAPY
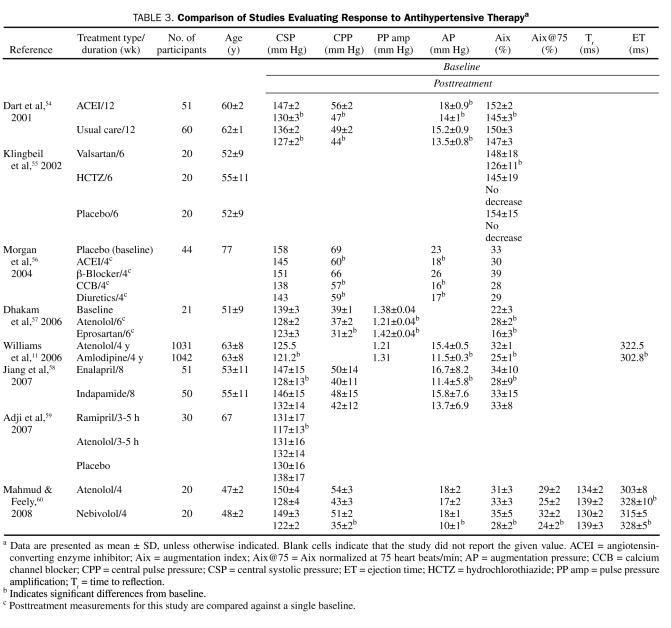
Radial artery AT is a valuable addition to brachial blood pressure in the management of hypertension. Central hemodynamic effects differ depending on the class of antihypertensive medication prescribed, perhaps explaining why certain drugs reduce cardiovascular event rates despite a similar reduction in brachial blood pressure compared with other antihypertensive agents.50-53 Vasodilators may be superior to other antihypertensive agents in normalizing central pressures (Table 3). In the CAFE study, the amlodipine with or without perindopril treatment arm had lower central SBP and PP than the atenolol with or without thiazide treatment arm as measured by radial artery AT (central SBP difference, −4.3 mm Hg; P<.0001; central PP difference, −3.0 mm Hg, P<.001).11 The effects on Aix, AP, and ET also differed significantly between the β-blocker and calcium channel blocker groups. Jiang et al58 demonstrated significant differences in central SBP with 8 weeks of therapy in patients treated with either an angiotensin-converting enzyme inhibitor or thiazide diuretic because of decreased augmentation in the angiotensin-converting enzyme inhibitor arm (mean ± SD central SBP, 128±13 mm Hg vs 132 ±14 mm Hg; P<.01).58 Furthermore, Aix was not significantly changed from baseline in the diuretic group, suggesting a neutral effect on reflection sites. Klingbeil et al55 demonstrated a significant decrease in mean ± SD Aix with an angiotensin II receptor blocker (ARB) vs a thiazide diuretic (ARB, −22%±1%; thiazide, −3%±11%; P<.01). Despite similar reductions in brachial pressure, eprosartan reduced mean ± SD central SBP and mean ± SD Aix more than atenolol (SBP, 123±3 mm Hg vs 128±2 mm Hg; P<.05; Aix, −6%±2% vs 7%±2%; P<.001). In the short term, mechanotransductive shear forces on the central vascular beds are worrisome and warrant continued study. Angiotensin-converting enzyme inhibitors, ARBs, dihydropyridine calcium channel blockers, and β-blockers with vasodilating properties appear to have a more favorable effect on central pressures than nonvasodilating β-blockers and possibly diuretic agents. Arteriolar vasodilators promote relaxation of smooth muscle cells in muscular arteries, thereby reducing reflected wave amplitude and moving reflective sites more distally. These effects delay the return of the reflected wave in the cardiac cycle, leading to less systolic augmentation.13 Atenolol, and perhaps other nondilating β-blockers, may increase peripheral vascular resistance as a result of decreased cardiac output or unopposed α1-adrenergic receptor stimulation. Increased peripheral resistance increases the amplitude of the reflected wave, resulting in central SBP augmentation. β-Blockers also increase ET, thereby lengthening the window of time for the reflected wave to fall within the systolic ejection period. Two recent trials comparing atenolol with amlodipine61 or losartan62 showed similar reductions in brachial blood pressure, but the atenolol arms were associated with more cardiovascular events. Radial artery AT measurements, if confirmed by more outcome data, suggest that the use of arteriolar vasodilators in the appropriate clinical setting should be considered as a very good initial choice in antihypertensive therapy.
TABLE 3.
Comparison of Studies Evaluating Response to Antihypertensive Therapya
OBSTRUCTIVE SLEEP APNEA
Sleep-disordered breathing, the most common form of which is OSA, is an important entity in resistant hypertension. Obstructive sleep apnea may exert its detrimental effects by perturbations of central pressures well before peripheral increases in blood pressure or other related cardiovascular phenomena such as arrhythmias become apparent to clinicians.63,64 Noda et al65 showed a higher AP and Aix in those with than in those without OSA (AP: 9.0±4.1 mm Hg vs 6.4±3.4 mm Hg; P<.001; Aix: 23.5%±8.7% vs 18.6%±9.0%; P=.020). Reduction of AP and Aix was noted in those treated with continuous positive airway pressure (AP, 11.7±2.1 mm Hg to 5.7±3.2 mm Hg; P<.001; Aix, 25.7%±10.4% to 16.1%±8.1%; P=.005). Mean ± SD central SBP also decreased from 133±10 mm Hg to 120±13 mm Hg (P=.008). Radial artery AT could hence be valuable as a measure of response to therapy in patients with OSA.
INCREASED LV MASS
Excess LV mass is a result of LV loading and indicates end organ effects of elevated blood pressure. Sharman et al66 divided study participants into tertiles by LV mass index; the mean ± SD pressures in the highest tertile were as follows: central PP, 53 mm Hg; central SBP, 119±13 mm Hg; AP, 8.3±5.5 mm Hg; and amplification of PP, 1.28±0.15 mm Hg.
Measuring AP, Aix, and pulse amplification in response to blood pressure therapy may assist a clinician in following up patients who are experiencing regression of LV mass under therapy. For 46 hypertensive study participants, reductions in AP and Aix better predicted LV mass reduction than did brachial blood pressure measurements (AP: 18.5±9.9 mm Hg to 12.7±6.9 mm Hg; P<.001; Aix: 33.3%±9.1% to 30.3%±11.3%; P=.047).67 Hashimoto et al68 demonstrated that PP amplification (ratio of brachial PP to central PP) was a better predictor of LV mass regression than home blood pressure monitoring (pulse amplification, 122%±12% to 127%±16%; P=.02).
DIASTOLIC DYSFUNCTION
Radial artery AT may alert a clinician to those at risk of DD. In those with untreated hypertension, mean ± SD Aix was 146%±23% in those with DD compared with 136%±20% in those without DD (P=.007). In an elderly cohort (mean age, 75 years) stratified by severity of DD, those with grade 2 to 4 DD had a mean ± SD central PP of 53±12 mm Hg, a mean ± SD AP of 17.2±6.5 mm Hg, and a mean ± SD Aix of 25.0%±7.1%.69 In this cohort, central PP had the strongest correlations with indexed left atrial volume, a good marker of chronic LV filling pressures (r=0.29; P<.001). In 271 unselected patients undergoing coronary angiography, mean ± SD AP was 19.4±8.9 mm Hg in those with definite DD (no DD: 10.7±6.8; P<.001).70
CORONARY ARTERY DISEASE
The central pressure waveform may indicate the presence and severity of CAD. Sharman et al15 compared the central pressures of 229 patients with known or suspected CAD and 222 healthy volunteers. Mean ± SD measurements of central SBP, central PP, and PP amplification were significantly higher in those with than in those without CAD (central SBP, 124±21 mm Hg vs 113±14 mm Hg; P<.05; central PP, 49±17 mm Hg vs 38±10 mm Hg; P<.05; PP amplification, 1.29±0.15 mm Hg vs 1.35±0.17 mm Hg; P<.05). In 465 symptomatic men undergoing coronary angiography, a 7-fold increase in the odds ratio for CAD existed between the lowest and highest Aix quartiles (−24% to 9% vs 29% to 60%).30 In this cohort of patients younger than 60 years, significant differences were noted in Aix, AP, and Tr in groups with CAD vs those without CAD (Aix, 22.4%±11.6% vs 5.4%±11.6%; P=.0005; AP, 8.6±5.5 mm Hg vs 5.1±5.0 mm Hg; P=.002; Tr, 139.9±11.9 ms vs 144.3±16.3 ms; P=.05). Aix was also a predictor of CAD in patients with chronic kidney disease undergoing coronary angiography (CAD, 23.4%±5.4%; no CAD, 17.9%±5.6%; P<.05).71 An Aix cutoff of 17% had a sensitivity of 87% and a specificity of 70% for predicting obstructive CAD.
PERIPHERAL VASCULAR DISEASE
The central pressure waveform may also identify a population at risk of peripheral vascular disease. In the SHS trial,8 central PP was a stronger marker of extracoronary atherosclerosis than brachial PP. Aix is associated with an abnormal CIMT (>0.7 mm) and an abnormal ankle brachial index (ABI) (<0.94) (CIMT >0.7 mm: mean ± SD Aix, 24%±17%; CIMT <0.7 mm: mean ± SD Aix, 17%±16%; P<.03; ABI <0.94: mean ± SD Aix, 23% ±18%; ABI >0.94: mean ± SD Aix, 18%±13%; P<.05).72 In 4159 randomly selected patients in Denmark, Aix had the same predictive power for severe atherosclerosis as ABI or C-reactive protein levels using receiver operating characteristic analysis (area under the curve, 0.56; 95% confidence interval, 0.53-0.60; P=.001).73 In 475 adults without a history of cardiovascular disease, a 1 SD increase in Aix was associated with an odds ratio of 1.79 for having an abnormal ABI.74 In 88 predominantly African American patients undergoing transesophageal echocardiography, Aix, not central PP or aortic PWV, was associated with aortic atherosclerosis (r=0.35; P=.002).75
DIABETES
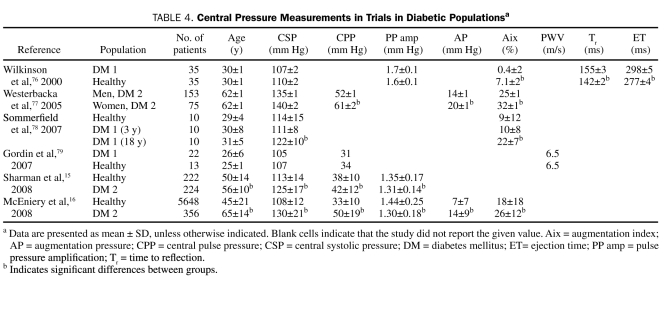
In diabetic patients, radial artery AT may indicate changes in measurements of central pressure before measurements of peripheral blood pressure (Table 4).80,81 Compared with healthy persons, patients with type 2 diabetes exhibit higher mean ± SD central SBP (125±17 mm Hg vs 113±14 mm Hg; P<.05) and central PP (42±12 mm Hg vs 38±10 mm Hg; P<.05) and lower mean ± SD PP amplification (1.31±0.14 mm Hg vs 1.35±0.17 mm Hg; P<.001).15 Young patients (mean ± SD age, 30±1 years) with type 1 diabetes have been shown to have an elevated mean ± SD Aix (7.1%±1.6% vs 0.4%±2.0%; P=.011) compared with age-matched controls, despite similar peripheral and central pressures.76 In patients with diabetes, mean ± SD ET and Tr are greater than in those without diabetes (ET, 298±5 ms vs 277±4 ms; P=.001; Tr, 155±3 ms vs 142±2 ms; P=.003). In patients with type 2 diabetes, increased AP correlates with an increased duration of diabetes.77 Central SBP and Aix differ significantly in patients with type 1 diabetes depending on the duration of disease (central SBP at 3 years, 111±8 mm Hg; central SBP at 18 years, 122±10 mm Hg; P=.047; Aix at 3 years, 10.0%±8.3%; Aix at 18 years, 21.8%±6.9%; P<.002).78 Certainly, early recognition of unfavorable central vascular changes in patients with diabetes may lead to the timely addition of vasodilators to the patient's treatment regimen before changes in brachial pressure are noted.
TABLE 4.
Central Pressure Measurements in Trials in Diabetic Populationsa
HYPERLIPIDEMIA
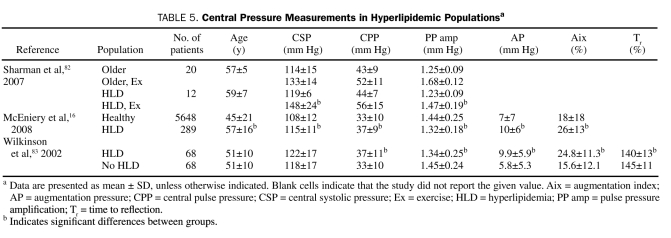
Hyperlipidemia (HLD) may lead to augmented central SBP (Table 5). Patients with elevated total and low-density lipoprotein cholesterol levels have been shown to have increased central SBP, AP, Aix, and Tr.83 Similar results were obtained by McEniery et al,16 who demonstrated significant central pressure differences in study participants with (n=289) and without (n=5648) HLD (Table 5). In another report of 213 healthy volunteers, increasing triglyceride levels within the normal range were associated with increasing Aix (β=0.19; P=.009).84 Compared with age-matched controls, patients with HLD had a blunted decrease in Aix and a higher central SBP during exercise (decrease in Aix for those with vs those without HLD: 29%±8% to 20%±11% vs 27%±8% to 7%±7%; P<.001; increase in central SBP in those with vs those without HLD: 119±6 mm Hg to 148±24 mm Hg vs 114±15 mg Hg to 133±14 mm Hg; P<.05).82
TABLE 5.
Central Pressure Measurements in Hyperlipidemic Populationsa
Statins may reverse central pressure abnormalities associated with HLD. In patients with known CAD, Lekakis et al72 demonstrated that those taking statins had a lower central SBP, AP, and Aix than those who were not. However, in a recent report, atorvastatin therapy in treated hypertensive patients did not change central pressures after 3.5 years of follow-up.85 The lack of effect may have been due to the low atorvastatin dose (10 mg) and to the only modestly elevated baseline cholesterol levels in the overall population.
TOBACCO USE
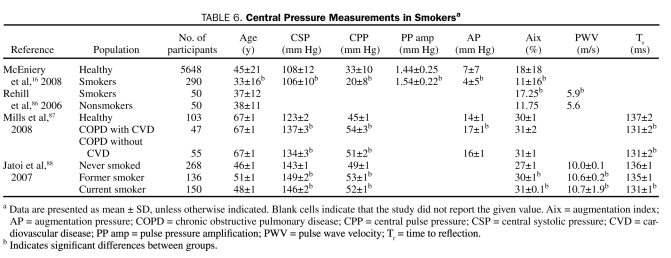
Tobacco smoking is a well-known risk factor for the development of CAD, and some of its effects may be due to vascular remodeling that leads to changes in the reflected wave (Table 6). Jatoi et al88 demonstrated differences in central SBP, Aix, and Tr among current, former, and never smokers. When 50 smokers were compared with 50 age- and sex-matched controls, smokers had a higher Aix (17.3% [95% confidence interval, −8.5% to 40%] vs 11.8% [95% confidence interval, −22% to 35.5%]; P=.004) with no difference in PWV.86 Chronic obstructive pulmonary disease is associated with a higher central SBP and AP and a shorter Tr compared with age-matched controls.87 After 4 weeks of smoking cessation, Aix decreases significantly.86,88
TABLE 6.
Central Pressure Measurements in Smokersa
LIMITATIONS OF RADIAL ARTERY AT
Although radial artery AT has a sound physiologic basis and hence exciting potential in the arena of clinical medicine, published treatment and outcome data for it are less complete than for brachial blood pressure. Currently, many physicians are unaware of this technology; this review is meant to remedy this lack of awareness. Another limitation is that general transfer functions, which are tools to estimate central pressures, have a range of error. However, the range of error is less than that for standard brachial cuff pressure with a sphygmomanometer or an oscillometric device, and therefore general transfer functions represent clinically sound data.89
With radial tonometry, as with any blood pressure measurement, strict adherence to standard processes is necessary to ensure that clinically sound data are obtained. Blood pressure should be measured according to the guidelines set forth in the Seventh Report of the Joint National Committee on Prevention, Detection, Evaluation, and Treatment of High Blood Pressure.90 Because vasoactive supplements, decongestants, caffeine, nicotine, or exercise can influence vascular reactivity, HR, and blood pressure, they should be avoided before blood pressure measurement so as not to invalidate the results.
CONCLUSION
Radial artery AT shows exciting promise as an adjunct measurement to peripherally obtained blood pressure. With radial artery AT, a clinician is able to bypass the amplification of peripheral pressure and not only obtain aortic pressure but also visualize the entire central pulse waveform. Measurements obtained from the central waveform can provide guidance about the need for and response to antihypertensive therapy. Although target values for radial artery AT are not well defined, age- and sex-specific ranges for central pressure measurements in normotensive individuals are known. Furthermore, a central SBP of approximately 124 mm Hg or greater and a central PP of 50 mm Hg or greater are associated with a higher risk of cardiovascular events and mortality. Radial artery AT can also be used to monitor regression of increased LV mass and to assess the effects of continuous positive airway pressure on central pressure measurements. Measurements of Aix, AP, PP amplification, and ET may identify patients who are at higher risk of CAD, DD, and peripheral vascular disease. Furthermore, central pressure measurements show the effects of vascular risk factors (eg, diabetes, OSA, tobacco use) before brachial pressure measurements do. Although limitations exist with AT, we are confident that pulse wave analysis will increasingly be used in conjunction with peripheral blood pressure recordings to manage and monitor treatment response in the clinical setting.
Supplementary Material
REFERENCES
- 1.O'Rourke MF, Seward JB. Central arterial pressure and arterial pressure pulse: new views entering the second century after Korotkov. Mayo Clin Proc. 2006;81(8):1057-1068 [DOI] [PubMed] [Google Scholar]
- 2.Breasted JH. The Edwin Smith Surgical Papyrus Vol 1 Chicago, IL: University of Chicago Press; 1930:105 [Google Scholar]
- 3.Acierno L. The History of Cardiology 1 ed.Taylor and Francis; 1994:758 [Google Scholar]
- 4.Snellen HA. E.J. Marey and Cardiology: Physiologist and Pioneer of Technology (1830-1904) Rotterdam, The Netherlands: Kooyker Scientific Publications; 1980. [Google Scholar]
- 5.Cournand A, Ranges A. Catheterization of the right auricle in man. Proc Soc Exp Biol Med. 1941;46:462-466 [Google Scholar]
- 6.Kroeker EJ, Wood EH. Beat-to-beat alterations in relationship of simultaneously recorded central and peripheral arterial pressure pulses during Valsalva maneuver and prolonged expiration in man. J Appl Physiol. 1956;8(5):483-494 [DOI] [PubMed] [Google Scholar]
- 7.Kroeker EJ, Wood EH. Comparison of simultaneously recorded central and peripheral arterial pressure pulses during rest, exercise and tilted position in man. Circ Res. 1955;3(6):623-632 [DOI] [PubMed] [Google Scholar]
- 8.Roman MJ, Devereux RB, Kizer JR, et al. Central pressure more strongly relates to vascular disease and outcome than does brachial pressure: the Strong Heart Study. Hypertension 2007;50(1):197-203 [DOI] [PubMed] [Google Scholar]
- 9.London GM, Blacher J, Pannier B, Guerin AP, Marchais SJ, Safar ME. Arterial wave reflections and survival in end-stage renal failure. Hypertension 2001;38(3):434-438 [DOI] [PubMed] [Google Scholar]
- 10.Safar ME, Blacher J, Pannier B, et al. Central pulse pressure and mortality in end-stage renal disease. Hypertension 2002;39(3):735-738 [DOI] [PubMed] [Google Scholar]
- 11.Williams B, Lacy PS, Thom SM, et al. Differential impact of blood pressure-lowering drugs on central aortic pressure and clinical outcomes: principal results of the Conduit Artery Function Evaluation (CAFE) study. Circulation 2006;113(9):1213-1225 [DOI] [PubMed] [Google Scholar]
- 12.Dahlof B, Devereux RB, Kjeldsen SE, et al. Cardiovascular morbidity and mortality in the Losartan Intervention For Endpoint reduction in hypertension study (LIFE): a randomised trial against atenolol. Lancet 2002;359(9311):995-1003 [DOI] [PubMed] [Google Scholar]
- 13.London GM, Asmar RG, O'Rourke MF, Safar ME. Mechanism(s) of selective systolic blood pressure reduction after a low-dose combination of perindopril/indapamide in hypertensive subjects: comparison with atenolol. J Am Coll Cardiol. 2004;43(1):92-99 [DOI] [PubMed] [Google Scholar]
- 14.O'Rourke MF, Nichols WW. Effect of ramipril on cardiovascular events in high-risk patients [letter]. N Engl J Med. 2000;343(1):64-65 [PubMed] [Google Scholar]
- 15.Sharman JE, Stowasser M, Fassett RG, Marwick TH, Franklin SS. Central blood pressure measurement may improve risk stratification. J Hum Hypertens. 2008;22:838-844 [DOI] [PubMed] [Google Scholar]
- 16.McEniery CM, Yasmin, McDonnell B, et al. Central pressure: variability and impact of cardiovascular risk factors: the Anglo-Cardiff Collaborative Trial II. Hypertension 2008;51(6):1476-1482 [DOI] [PubMed] [Google Scholar]
- 17.Nakamura M, Sato K, Nagano M. Estimation of aortic systolic blood pressure in community-based screening: the relationship between clinical characteristics and peripheral to central blood pressure differences. J Hum Hypertens. 2005;19(3):251-253 [DOI] [PubMed] [Google Scholar]
- 18.O'Rourke MF, Vlachopoulos C, Graham RM. Spurious systolic hypertension in youth. Vasc Med. 2000;5(3):141-145 [DOI] [PubMed] [Google Scholar]
- 19.Chen CH, Nevo E, Fetics B, et al. Estimation of central aortic pressure waveform by mathematical transformation of radial tonometry pressure: validation of generalized transfer function. Circulation 1997;95(7):1827-1836 [DOI] [PubMed] [Google Scholar]
- 20.Karamanoglu M, O'Rourke MF, Avolio AP, Kelly RP. An analysis of the relationship between central aortic and peripheral upper limb pressure waves in man. Eur Heart J. 1993;14(2):160-167 [DOI] [PubMed] [Google Scholar]
- 21.Pauca AL, O'Rourke MF, Kon ND. Prospective evaluation of a method for estimating ascending aortic pressure from the radial artery pressure waveform. Hypertension 2001;38(4):932-937 [DOI] [PubMed] [Google Scholar]
- 22.Crilly M, Coch C, Clark H, Bruce M, Williams D. Repeatability of the measurement of augmentation index in the clinical assessment of arterial stiffness using radial applanation tonometry. Scand J Clin Lab Invest. 2007;67(4):413-422 [DOI] [PubMed] [Google Scholar]
- 23.Crilly M, Coch C, Bruce M, Clark H, Williams D. Repeatability of central aortic blood pressures measured non-invasively using radial artery applanation tonometry and peripheral pulse wave analysis. Blood Press 2007;16(4):262-269 [DOI] [PubMed] [Google Scholar]
- 24.Adji A, Hirata K, O'Rourke MF. Clinical use of indices determined non-invasively from the radial and carotid pressure waveforms. Blood Press Monit. 2006;11(4):215-221 [DOI] [PubMed] [Google Scholar]
- 25.McEniery CM, Yasmin, Hall IR, Qasem A, Wilkinson IB, Cockcroft JR. Normal vascular aging: differential effects on wave reflection and aortic pulse wave velocity: the Anglo-Cardiff Collaborative Trial (ACCT). J Am Coll Cardiol. 2005;46(9):1753-1760 [DOI] [PubMed] [Google Scholar]
- 26.Spodick DH, Kumar S. Left ventricular ejection period. Measurement by atraumatic techniques: results in normal young men and comparison of methods of calculation. Am Heart J. 1968;76(1):70-73 [DOI] [PubMed] [Google Scholar]
- 27.Yasmin, Brown MJ. Similarities and differences between augmentation index and pulse wave velocity in the assessment of arterial stiffness. QJM 1999;92(10):595-600 [DOI] [PubMed] [Google Scholar]
- 28.Wilkinson IB, Mohammad NH, Tyrrell S, et al. Heart rate dependency of pulse pressure amplification and arterial stiffness. Am J Hypertens. 2002;15(1, pt 1):24-30 [DOI] [PubMed] [Google Scholar]
- 29.Zambanini A, Cunningham SL, Parker KH, Khir AW, McG Thom SA, Hughes AD. Wave-energy patterns in carotid, brachial, and radial arteries: a noninvasive approach using wave-intensity analysis. Am J Physiol Heart Circ Physiol. 2005;289(1):H270-H276 [DOI] [PubMed] [Google Scholar]
- 30.Weber T, Auer J, O'Rourke MF, et al. Arterial stiffness, wave reflections, and the risk of coronary artery disease. Circulation 2004;109(2):184-189 [DOI] [PubMed] [Google Scholar]
- 31.Lehmann ED, Hopkins KD, Rawesh A, et al. Relation between number of cardiovascular risk factors/events and noninvasive Doppler ultrasound assessments of aortic compliance. Hypertension 1998;32(3):565-569 [DOI] [PubMed] [Google Scholar]
- 32.Vaitkevicius PV, Fleg JL, Engel JH, et al. Effects of age and aerobic capacity on arterial stiffness in healthy adults. Circulation 1993;88(4, pt 1):1456-1462 [DOI] [PubMed] [Google Scholar]
- 33.Boutouyrie P, Tropeano AI, Asmar R, et al. Aortic stiffness is an independent predictor of primary coronary events in hypertensive patients: a longitudinal study. Hypertension 2002;39(1):10-15 [DOI] [PubMed] [Google Scholar]
- 34.Cruickshank K, Riste L, Anderson SG, Wright JS, Dunn G, Gosling RG. Aortic pulse-wave velocity and its relationship to mortality in diabetes and glucose intolerance: an integrated index of vascular function? Circulation 2002;106(16):2085-2090 [DOI] [PubMed] [Google Scholar]
- 35.Kim YK. Impact of the metabolic syndrome and its components on pulse wave velocity. Korean J Intern Med. 2006;21(2):109-115 [DOI] [PMC free article] [PubMed] [Google Scholar]
- 36.Sutton-Tyrrell K, Najjar SS, Boudreau RM, et al. Elevated aortic pulse wave velocity, a marker of arterial stiffness, predicts cardiovascular events in well-functioning older adults. Circulation 2005;111(25):3384-3390 [DOI] [PubMed] [Google Scholar]
- 37.Van Trijp MJ, Uiterwaal CS, Bos WJ, Oren A, Grobbee DE, Bots ML. Noninvasive arterial measurements of vascular damage in healthy young adults: relation to coronary heart disease risk. Ann Epidemiol. 2006;16(2):71-77 [DOI] [PubMed] [Google Scholar]
- 38.Kampus P, Muda P, Kals J, et al. The relationship between inflammation and arterial stiffness in patients with essential hypertension. Int J Cardiol. 2006;112(1):46-51 [DOI] [PubMed] [Google Scholar]
- 39.Casey DP, Pierce GL, Howe KS, Mering MC, Braith RW. Effect of resistance training on arterial wave reflection and brachial artery reactivity in normotensive postmenopausal women. Eur J Appl Physiol. 2007;100(4):403-408 [DOI] [PubMed] [Google Scholar]
- 40.O'Rourke MF, Adji A. Basis for the use of central blood pressure measurement in office clinical practice. J Am Soc Hypertens. 2008;2(1):28-38 [DOI] [PubMed] [Google Scholar]
- 41.Mahmud A, Feely J. Aldosterone-to-renin ratio, arterial stiffness, and the response to aldosterone antagonism in essential hypertension. Am J Hypertens. 2005;18(1):50-55 [DOI] [PubMed] [Google Scholar]
- 42.Strauch B, Petrak O, Wichterle D, Zelinka T, Holaj R, Widimsky J., Jr Increased arterial wall stiffness in primary aldosteronism in comparison with essential hypertension. Am J Hypertens. 2006;19(9):909-914 [DOI] [PubMed] [Google Scholar]
- 43.Pietri P, Vyssoulis G, Vlachopoulos C, et al. Relationship between low-grade inflammation and arterial stiffness in patients with essential hypertension. J Hypertens. 2006;24(11):2231-2238 [DOI] [PubMed] [Google Scholar]
- 44.Gedikli O, Ozturk S, Yilmaz H, et al. Relationship between arterial stiffness and myocardial damage in patients with newly diagnosed essential hypertension. Am J Hypertens. 2008;21(9):989-993 [DOI] [PubMed] [Google Scholar]
- 45.Roman MJ, Devereux RB, Kizer JR, et al. Abstract 6203: central pulse pressure ≥50 mmHg predicts adverse cardiovascular outcome: the Strong Heart Study. Circulation 2008;118:S_1157 [Google Scholar]
- 46.Tsang TS, Verzosa GC, Barnes ME, et al. Abstract 3163: central pulse pressure as a robust predictor of first atrial fibrillation: Study Of Atrial Fibrillation In High Risk Elderly (SAFFIHRE). Circulation 2008;118:S_1106 [Google Scholar]
- 47.Weber T, Auer J, O'Rourke MF, et al. Increased arterial wave reflections predict severe cardiovascular events in patients undergoing percutaneous coronary interventions. Eur Heart J. 2005;26(24):2657-2663 [DOI] [PubMed] [Google Scholar]
- 48.Heffernan KS, Jae SY, Wilund KR, Woods JA, Fernhall B. Racial differences in central blood pressure and vascular function in young men. Am J Physiol Heart Circ Physiol. 2008;295(6):H2380-H2387 [DOI] [PubMed] [Google Scholar]
- 49.Bibbins-Domingo K, Pletcher MJ, Lin F, et al. Racial differences in incident heart failure among young adults. N Engl J Med. 2009;360(12):1179-1190 [DOI] [PMC free article] [PubMed] [Google Scholar]
- 50.Jamerson K, Weber MA, Bakris GL, et al. Benazepril plus amlodipine or hydrochlorothiazide for hypertension in high-risk patients. N Engl J Med. 2008;359(23):2417-2428 [DOI] [PubMed] [Google Scholar]
- 51.Weinsaft JW. Effect of ramipril on cardiovascular events in high-risk patients [letter]. N Engl J Med. 2000;343(1):64 [DOI] [PubMed] [Google Scholar]
- 52.Kjeldsen SE, Dahlof B, Devereux RB, et al. Effects of losartan on cardiovascular morbidity and mortality in patients with isolated systolic hypertension and left ventricular hypertrophy: a Losartan Intervention for Endpoint Reduction (LIFE) substudy. JAMA 2002;288(12):1491-1498 [DOI] [PubMed] [Google Scholar]
- 53.Wing LM, Reid CM, Ryan P, et al. A comparison of outcomes with angiotensin-converting–enzyme inhibitors and diuretics for hypertension in the elderly. N Engl J Med. 2003;348(7):583-592 [DOI] [PubMed] [Google Scholar]
- 54.Dart AM, Reid CM, McGrath B. Effects of ACE inhibitor therapy on derived central arterial waveforms in hypertension. Am J Hypertens 2001;14(8, pt 1):804-810 [DOI] [PubMed] [Google Scholar]
- 55.Klingbeil AU, John S, Schneider MP, Jacobi J, Weidinger G, Schmieder RE. AT1-receptor blockade improves augmentation index: a double-blind, randomized, controlled study. J Hypertens 2002;20(12):2423-2428 [DOI] [PubMed] [Google Scholar]
- 56.Morgan T, Lauri J, Bertram D, Anderson A. Effect of different antihypertensive drug classes on central aortic pressure. Am J Hypertens. 2004;17(2):118-123 [DOI] [PubMed] [Google Scholar]
- 57.Dhakam Z, McEniery CM, Yasmin, Cockcroft JR, Brown MJ, Wilkinson IB. Atenolol and eprosartan: differential effects on central blood pressure and aortic pulse wave velocity. Am J Hypertens. 2006;19(2):214-219 [DOI] [PubMed] [Google Scholar]
- 58.Jiang XJ, O'Rourke MF, Zhang YQ, He XY, Liu LS. Superior effect of an angiotensin-converting enzyme inhibitor over a diuretic for reducing aortic systolic pressure. J Hypertens. 2007;25(5):1095-1099 [DOI] [PubMed] [Google Scholar]
- 59.Adji A, Hirata K, Hoegler S, O'Rourke MF. Noninvasive pulse waveform analysis in clinical trials: similarity of two methods for calculating aortic systolic pressure. Am J Hypertens. 2007;20(8):917-922 [DOI] [PubMed] [Google Scholar]
- 60.Mahmud A, Feely J. Beta-blockers reduce aortic stiffness in hypertension but nebivolol, not atenolol, reduces wave reflection. Am J Hypertens. 2008;21(6):663-667 [DOI] [PubMed] [Google Scholar]
- 61.Dahlof B, Sever PS, Poulter NR, et al. Prevention of cardiovascular events with an antihypertensive regimen of amlodipine adding perindopril as required versus atenolol adding bendroflumethiazide as required, in the Anglo-Scandinavian Cardiac Outcomes Trial-Blood Pressure Lowering Arm (ASCOT-BPLA): a multicentre randomised controlled trial. Lancet 2005;366(9489):895-906 [DOI] [PubMed] [Google Scholar]
- 62.Devereux RB, Dahlof B, Gerdts E, et al. Regression of hypertensive left ventricular hypertrophy by losartan compared with atenolol: the Losartan Intervention for Endpoint Reduction in Hypertension (LIFE) trial. Circulation 2004;110(11):1456-1462 [DOI] [PubMed] [Google Scholar]
- 63.Drager LF, Bortolotto LA, Figueiredo AC, Silva BC, Krieger EM, Lorenzi-Filho G. Obstructive sleep apnea, hypertension, and their interaction on arterial stiffness and heart remodeling. Chest 2007;131(5):1379-1386 [DOI] [PubMed] [Google Scholar]
- 64.Jelic S, Bartels MN, Mateika JH, Ngai P, DeMeersman RE, Basner RC. Arterial stiffness increases during obstructive sleep apneas. Sleep 2002;25(8):850-855 [PubMed] [Google Scholar]
- 65.Noda A, Nakata S, Fukatsu H, et al. Aortic pressure augmentation as a marker of cardiovascular risk in obstructive sleep apnea syndrome. Hypertens Res. 2008;31(6):1109-1114 [DOI] [PubMed] [Google Scholar]
- 66.Sharman JE, Fang ZY, Haluska B, Stowasser M, Prins JB, Marwick TH. Left ventricular mass in patients with type 2 diabetes is independently associated with central but not peripheral pulse pressure. Diabetes Care 2005;28(4):937-939 [DOI] [PubMed] [Google Scholar]
- 67.Hashimoto J, Imai Y, O'Rourke MF. Indices of pulse wave analysis are better predictors of left ventricular mass reduction than cuff pressure. Am J Hypertens. 2007;20(4):378-384 [DOI] [PubMed] [Google Scholar]
- 68.Hashimoto J, Imai Y, O'Rourke MF. Monitoring of antihypertensive therapy for reduction in left ventricular mass. Am J Hypertens. 2007;20(11):1229-1233 [DOI] [PubMed] [Google Scholar]
- 69.Abhayaratna WP, Barnes ME, O'Rourke MF, et al. Relation of arterial stiffness to left ventricular diastolic function and cardiovascular risk prediction in patients ≥65 years of age. Am J Cardiol. 2006;98(10):1387-1392 [DOI] [PubMed] [Google Scholar]
- 70.Weber T, Auer J, O'Rourke MF, Punzengruber C, Kvas E, Eber B. Prolonged mechanical systole and increased arterial wave reflections in diastolic dysfunction. Heart 2006;92(11):1616-1622 [DOI] [PMC free article] [PubMed] [Google Scholar]
- 71.Covic A, Haydar AA, Bhamra-Ariza P, Gusbeth-Tatomir P, Goldsmith DJ. Aortic pulse wave velocity and arterial wave reflections predict the extent and severity of coronary artery disease in chronic kidney disease patients. J Nephrol. 2005;18(4):388-396 [PubMed] [Google Scholar]
- 72.Lekakis JP, Ikonomidis I, Protogerou AD, et al. Arterial wave reflection is associated with severity of extracoronary atherosclerosis in patients with coronary artery disease. Eur J Cardiovasc Prev Rehabil. 2006;13(2):236-242 [DOI] [PubMed] [Google Scholar]
- 73.Eldrup N, Sillesen H, Prescott E, Nordestgaard BG. Ankle brachial index, C-reactive protein, and central augmentation index to identify individuals with severe atherosclerosis. Eur Heart J. 2006;27(3):316-322 [DOI] [PubMed] [Google Scholar]
- 74.Khaleghi M, Kullo IJ. Aortic augmentation index is associated with the ankle-brachial index: a community-based study. Atherosclerosis 2007;195(2):248-253 [DOI] [PMC free article] [PubMed] [Google Scholar]
- 75.Qureshi G, Brown R, Salciccioli L, et al. Relationship between aortic atherosclerosis and non-invasive measures of arterial stiffness. Atherosclerosis 2007;195(2):e190-e194 [DOI] [PubMed] [Google Scholar]
- 76.Wilkinson IB, MacCallum H, Rooijmans DF, et al. Increased augmentation index and systolic stress in type 1 diabetes mellitus. QJM 2000;93(7):441-448 [DOI] [PubMed] [Google Scholar]
- 77.Westerbacka J, Leinonen E, Salonen JT, et al. Increased augmentation of central blood pressure is associated with increases in carotid intima-media thickness in type 2 diabetic patients. Diabetologia 2005;48(8):1654-1662 [DOI] [PubMed] [Google Scholar]
- 78.Sommerfield AJ, Wilkinson IB, Webb DJ, Frier BM. Vessel wall stiffness in type 1 diabetes and the central hemodynamic effects of acute hypoglycemia. Am J Physiol Endocrinol Metab. 2007;293(5):E1274-E1279 [DOI] [PubMed] [Google Scholar]
- 79.Gordin D, Ronnback M, Forsblom C, Heikkila O, Saraheimo M, Groop PH. Acute hyperglycaemia rapidly increases arterial stiffness in young patients with type 1 diabetes. Diabetologia 2007;50(9):1808-1814 [DOI] [PubMed] [Google Scholar]
- 80.Henry RM, Kostense PJ, Spijkerman AM, et al. Arterial stiffness increases with deteriorating glucose tolerance status: the Hoorn Study. Circulation 2003;107(16):2089-2095 [DOI] [PubMed] [Google Scholar]
- 81.Schram MT, Henry RM, van Dijk RA, et al. Increased central artery stiffness in impaired glucose metabolism and type 2 diabetes: the Hoorn Study. Hypertension 2004;43(2):176-181 [DOI] [PubMed] [Google Scholar]
- 82.Sharman JE, McEniery CM, Dhakam ZR, Coombes JS, Wilkinson IB, Cockcroft JR. Pulse pressure amplification during exercise is significantly reduced with age and hypercholesterolemia. J Hypertens. 2007;25(6):1249-1254 [DOI] [PubMed] [Google Scholar]
- 83.Wilkinson IB, Prasad K, Hall IR, et al. Increased central pulse pressure and augmentation index in subjects with hypercholesterolemia. J Am Coll Cardiol. 2002;39(6):1005-1011 [DOI] [PubMed] [Google Scholar]
- 84.Aznaouridis K, Vlachopoulos C, Dima I, Ioakeimidis N, Stefanadis C. Triglyceride level is associated with wave reflections and arterial stiffness in apparently healthy middle-aged men. Heart 2007;93(5):613-614 [DOI] [PMC free article] [PubMed] [Google Scholar]
- 85.Williams B, Lacy PS, Cruickshank JK, et al. Impact of statin therapy on central aortic pressures and hemodynamics: principal results of the Conduit Artery Function Evaluation-Lipid-Lowering Arm (CAFE-LLA) Study. Circulation 2009;119(1):53-61 [DOI] [PubMed] [Google Scholar]
- 86.Rehill N, Beck CR, Yeo KR, Yeo WW. The effect of chronic tobacco smoking on arterial stiffness. Br J Clin Pharmacol. 2006;61(6):767-773 [DOI] [PMC free article] [PubMed] [Google Scholar]
- 87.Mills NL, Miller JJ, Anand A, et al. Increased arterial stiffness in patients with chronic obstructive pulmonary disease: a mechanism for increased cardiovascular risk. Thorax 2008;63(4):306-311 [DOI] [PubMed] [Google Scholar]
- 88.Jatoi NA, Jerrard-Dunne P, Feely J, Mahmud A. Impact of smoking and smoking cessation on arterial stiffness and aortic wave reflection in hypertension. Hypertension 2007;49(5):981-985 [DOI] [PubMed] [Google Scholar]
- 89.O'Brien E, Waeber B, Parati G, Staessen J, Myers MG. Blood pressure measuring devices: recommendations of the European Society of Hypertension. BMJ 2001;322(7285):531-536 [DOI] [PMC free article] [PubMed] [Google Scholar]
- 90.The Seventh Report of the Joint National Committee on Prevention, Detection, Evaluation, and Treatment of High Blood Pressure (JNC 7). National Heart, Lung, and Blood Institute Web site http://www.nhlbi.nih.gov/guidelines/hypertension Accessed March 29, 2010 [PubMed]
Associated Data
This section collects any data citations, data availability statements, or supplementary materials included in this article.


