

Abstract
Objectives
Lower socioeconomic status is associated with short or long sleep duration and sleep disturbance (e.g., sleep apnea), which are all related to increased mortality risk. General sleep complaints, however, which may better approximate symptoms as they are experienced, have not been examined in a large population sample.
Methods
Sample consisted of n=159,856 participants from the Behavioral Risk Factor Surveillance System, representing 36 states/regions across the US. Sleep complaints were measured with a telephone survey item that assessed “trouble falling asleep,” “staying asleep” or “sleeping too much.” Data analysis utilized hierarchical logistic regression and Rao-Schott chi-square.
Results
Asian respondents reported the least complaints, and Hispanic/Latino and Black/African-American individuals reported fewer complaints than Whites. Lower income and educational attainment was associated with more sleep complaints. Employment was associated with less sleep complaints and unemployment with more. Married individuals reported the least sleep complaints. Significant interactions with race/ethnicity indicate that the relationship between sleep complaints and marital status, income and employment differs among groups for men, and the relationship with education differs among groups for women.
Conclusions
Rates of sleep complaints in African-American, Hispanic/Latino and Asian/Other groups were similar to Whites. Lower socioeconomic status was associated with higher rates of sleep complaint.
Keywords: Sleep, population, sleep quality, socioeconomic factors, ethnicity
INTRODUCTION
Sleep in humans, like eating, represents a biological imperative that is expressed in a manner driven by social factors. But research on the social determinants of sleep has been dwarfed by laboratory-based studies examining the effects of sleep deprivation and sleep disorders. The pertinence of nightly sleep attainment on multiple daytime health outcomes including mortality is increasingly being reported1-2. Thus, addressing the social determinants of sleep is a highly relevant topic.
The Institute of Medicine recently reported that the public health ramifications of sleep are under-recognized by society. The economic burden of restricted/impaired sleep has been conservatively estimated at $107 billion3. Evaluating socioeconomic disparities in sleep is therefore an important step toward 1) highlighting inequality in a grossly overlooked but important domain of health behaviors, 2) understanding how habitual sleep is influenced, and 3) targeting higher-risk groups for future interventions. The impact of sleep behavior on health outcomes constitutes a rapidly growing literature4-6, as is our understanding of social inequalities in health.
The associations between sleep quantity/quality and both demographic and socioeconomic factors have been increasingly reported in the literature. They have reported that, in general, groups with lower socioeconomic status (SES) report less sleep duration and/or lower sleep quality7-8.
In Japan, Sekine and colleagues9 surveyed 3684 Japanese civil servants working in local government. SES was assessed by the grade of employment on the assumption that higher grade translated to a higher income. This is likely to be the case, though Japanese organizations operate on a seniority-based wage system and, therefore, grade may not reflect income as accurately as in the United States. The main findings included a social inequality in men in terms of sleep, physical and mental health. Higher-grade employees had better sleep and better physical and mental health. Adjusting for differences in sleep, the differences between high and low employment grades in physical and mental health were reduced by 20-40%. These results suggest that social inequalities in sleep may influence social inequalities in physical and mental health. The selection sample of subjects (Japanese civil servants) and the seniority-based wage system limit extrapolation to the United States.
Adams conducted an analysis to investigate the relationship between socioeconomic position and sleep quantity in the UK10. Using the Omnibus survey, 1473 (647 men, 826 women) subjects were studied. The odds for reporting mid-range (healthy) sleep showed an overall decrease with decreasing socioeconomic position, however, it was not statistically significant. The author concludes that little evidence exists that more deprived people obtain less sleep. It is important to note the following: the response rate in the survey was 54%, reporting of sleep was based on a question that coded rest and sleep in the same category. Many respondents could have been scoring rest or inability to sleep in the same category as sleep, thereby overestimating true sleep.
Several American studies have explored this relationship as well. Moore and colleagues11 studied 1139 subjects aged 18 to 89 years old recruited from Detroit city and 3 neighboring counties in a cross-sectional study. Sleep quality mediated the relationship between income and health.
Hale12 analyzed subjects aged between 25 and 64 years old from four cross-sectional time-use studies conducted in 1965, 1975, 1985, and 1999. Sleep duration, measured in trichotomous fashion (short, mid-range, and long sleep), correlated with marriage and education in that individuals who were married or educated were more likely to experience mid-range sleep (which is associated with reduced health risks13). Income was not assessed in this analysis.
Lauderdale and colleagues14 analyzed data from the CARDIA study, which collected subjective and objective sleep from 669 middle-aged adults in Chicago. They found that sex and race (White or Black) was related to sleep duration, with the most sleep reported by White women and the least by Black men. This finding persisted even after adjusting for other demographic and socioeconomic variables. Income in this study was significantly related to sleep quality.
A recent, large study of 110,441 Americans was reported by Krueger and Friedman15. This study, like that by Hale, classified adults as either short, normal (7 or 8 hours) or long sleepers (with short and long sleepers being groups at higher risk). Regarding race, both short and long sleep was associated with being Black, while short sleep was also more likely in those who were “Other, Non-Hispanic” or Hispanic (not Mexican-American), and long sleep was more likely in Mexican-Americans and foreign-born respondents. Overall, the findings on race suggest that the role of race in sleep is complex. Regarding socioeconomic variables, less sleep was associated with more work hours and both long and short sleep were associated with less education and income.
Despite important contributions, the current SES-sleep literature has many limitations. First, many of these studies explored samples that were limited regarding geographical location16-18 and population characteristics9, 19. Second, most of these studies may not have included samples large enough to detect subtle differences. Third, some studies did not examine men and women separately18, although sleep complaints are experienced differently in men than women. Finally, the primary outcome of most of these studies has been sleep duration12, 15, 18, 20, which may fail to capture sleep complaints.
In this study, we explore the influence of socioeconomic factors on self-reported sleep complaints in the largest US sample to address this question. In doing so, we also provide insight into the population characteristics of sleep complaints in a nationally representative sample. The distribution of sleep complaints was examined at several strata for age, ethnicity, education, marital status, employment status and income, in an attempt to describe population patterns of sleep complaints. Multivariate models were fit to determine the likelihood of reported sleep complaints across all of these factors, simultaneously adjusting for all other variables.
Based on prior literature, we anticipated that there would be significant demographic and socioeconomic influences on habitual sleep quantity and quality. Additionally, we hypothesized that gender would lead to differential vulnerability to sleep complaints, as data suggest that women are more likely to report sleep complaints21. We sought to further explore this by analyzing the Centers for Disease Control Behavioral Risk Factor Surveillance System (BRFSS) dataset. The BRFSS offers a unique opportunity to examine the societal burden of sleep disorders. The large sample size, study methodology, and geographical and demographic diversity within the sample make the BRFSS unique among epidemiologic surveys.
METHODS
Data Source
The participants of this study were from the 2006 Behavioral Risk Factor Surveillance System (BRFSS)22. The BRFSS is a state-based, random-digit-dialed telephone interview survey of non-institutionalized adults aged ≥18 years from all over United States conducted every year. It is the world’s largest telephone survey, designed to monitor health-related behaviors in the general population.
For this study, participants were respondents who had answered a question on sleep complaints (SC): “Over the last 2 weeks, how many days have you had trouble falling asleep or staying asleep or sleeping too much?” Answers ranged from 0-14. Nevertheless, the distribution of this variable was bimodal, with peaks at 0 and 14. A total of 128,296 respondents reported 0, 1, or 2 nights of disturbance per 14 nights, and 21,970 reported 12, 13 or 14 nights of disturbance. Thus, 81% of the sample reported very few or very many complaints.
Because of this, we dichotomized SC into two categories: those who report SC ≥6 days in 2 weeks and those who report <6 days of complaints. This is consistent with other classification approaches where a frequency of three or more events per week has been used23. It could be argued that a different cut point is more clinically relevant. But we could have set a lower threshold, with as little as 3 nights in 2 weeks resulting in classification of SC. This would only add an additional 10% of the sample into the SC classification. Thus, although we chose the more conservative estimate of SC in the population, a less conservative estimate would not have resulted in much change to the overall pattern of results.
Demographic variables included self-reported gender, age, race/ethnicity (White, Black/African American, Hispanic/Latino, Asian/Other, and Multiracial), and marital status (married, never married, part of an unmarried couple, divorced, widowed, separated). Socioeconomic factors included education (less than high school, high school graduate, some college, college graduate), income level (<$10,000 pre-tax income per year, $10,000-$15,000, $15,000-$20,000, $20,000-$25,000, $25,000-$35,000, $35,000-$50,000, $50,000-$75,000, >$75000), and employment status (employed, self-employed, retired, student, homemaker, unemployed <1 year, unemployed >1 year, unable to work).
Statistical Analyses
Complete-case analysis was implemented; thus, only participants who provided complete data were included for analysis. Percentages of respondents indicating SC across demographic variables and socioeconomic factors were calculated and differences in reported SC among groups were compared using Rao-Scott chi-square tests using SAS software24 with the PROC SURVEYFREQ procedure.
Data were also reviewed graphically to assess distribution and relationship to sleep complaints. Visual inspection revealed that age demonstrated a non-linear relationship to sleep and was thus analyzed both using linear, squared and cubed functions to attempt to capture the curvilinear function. We chose this method ad-hoc because although these terms are difficult to interpret, we wished to maximize our ability to describe variance explained by age. Other variables were considered as categorical variables as discussed previously.
Then the logic of odds of the categorical SC was modeled using generalized linear model for each individual variable and all combined variables for all and separated by gender. In the model, age was considered as a continuous variable while others were considered as categorical variables to best model how the data were originally collected and to maximize resolution. All sampling was weighted appropriately using weighting scores specifically developed for BRFSS 200622. The odds ratios (ORs) and 95% confidence intervals (CIs) were estimated among groups relative to a preselected reference. Analyses were performed using SAS software24 with the PROC SURVEYLOGISTIC procedure. All statistical tests were two-tailed. Statistical significance was set at the p< 0.05 level unless otherwise indicated.
A hierarchical approach was taken for analysis. First, unadjusted analyses were performed (separately for men and women) for all variables (age, education, income, marital status, employment), with SC as the dependent variable. Second, all of the variables were entered together into an adjusted model. Third, interactions for all variables with race/ethnicity were computed and entered. The purpose of these interactions was to further explore whether relationships between SC and income, education, marital status and employment differed by race/ethnicity. Given the large sample size, there was sufficient power to explore these interactions, and as previous research shows that the relationship between SES and health can be different for individuals of different racial/ethnic backgrounds25, we wished to explore if this was the case with sleep.
RESULTS
Response Rates and Missing Values
Of the 355,710 individuals who participated in the BRFSS, a total of 188,765 people were asked the SC question (52.32% of the total BRFSS sample). Of those, 98.59% of respondents completed the item, with n=430 or 0.23% refusing to answer the question and n=2,228 or 1.18% responding with “don’t know.” Of those remaining, 159,856 (85.89%) provided complete data. This suggests that it is likely that the present data accurately represent the sample selected for study. The following regions were represented: Alabama, Alaska, Arkansas, California, Delaware, Washington DC, Florida, Georgia, Hawaii, Indiana, Iowa, Louisiana, Maine, Michigan, Minnesota, Mississippi, Missouri, Montana, Nevada, New Hampshire, New Mexico, North Dakota, Oklahoma, Oregon, Rhode Island, South Carolina, Tennessee, Texas, Utah, Vermont, Virginia, West Virginia, Wisconsin, Wyoming, Puerto Rico, and the Virgin Islands.
Subject Characteristics
Characteristics of subjects who responded to the SC question are reported in Table 1. This table shows that the variable with the highest rate of nonresponse was income. While this represents a small portion of the overall sample, it should be noted that analysis of individuals who did not report income showed that they were more likely to be in the youngest age and lowest education groups.
Table 1.
Characteristics of Respondents to the SC Question
| Total Sample | Male | Female | ||||
|---|---|---|---|---|---|---|
| Variable | N | Weighted % | N | Weighted % | N | Weighted % |
| Participants | 159856 | 100 | 63278 | 100 | 96578 | 100 |
| Age (mean and SC) | ||||||
| Age (years) | 51.5 (16.3) | 51.4 (16.0) | 51.6 (16.4) | |||
| Race/Ethnicity | ||||||
| White | 121881 | 67.1 | 49299 | 67.0 | 72582 | 67.2 |
| Black/African American | 14113 | 8.9 | 4458 | 8.0 | 9655 | 9.7 |
| Asian / Other | 6657 | 4.8 | 2926 | 5.4 | 3731 | 4.2 |
| Multiracial (Non-Hispanic/Latino) | 3686 | 1.8 | 1462 | 1.8 | 2224 | 1.8 |
| Hispanic/Latino | 13519 | 17.4 | 5133 | 17.9 | 8386 | 17.0 |
| Marital Status | ||||||
| Married | 90346 | 61.6 | 39910 | 64.8 | 50436 | 58.5 |
| Divorced | 24179 | 9.6 | 8372 | 8.1 | 15807 | 11.2 |
| Widowed | 17452 | 5.5 | 3185 | 2.3 | 14267 | 8.8 |
| Separated | 3832 | 2.2 | 1190 | 1.8 | 2642 | 2.7 |
| Never Married | 19867 | 16.7 | 8831 | 18.6 | 11036 | 14.8 |
| Part of Unmarried Couple | 4180 | 4.3 | 1790 | 4.4 | 2390 | 4.2 |
| Employment Status | ||||||
| Employed | 79775 | 54.5 | 33328 | 60.0 | 46447 | 49.1 |
| Self-employed | 15340 | 9.4 | 8624 | 12.3 | 6716 | 6.6 |
| Out of Work >1 Year | 2646 | 1.8 | 924 | 1.6 | 1722 | 2.1 |
| Out of Work <1 Year | 3293 | 2.9 | 1305 | 3.1 | 1988 | 2.8 |
| Homemaker | 12012 | 7.8 | 145 | 0.3 | 11867 | 15.3 |
| Student | 2904 | 4.0 | 953 | 3.4 | 1951 | 4.6 |
| Retired | 34110 | 14.5 | 14411 | 14.6 | 19699 | 14.3 |
| Unable to Work | 9776 | 5.0 | 3588 | 4.7 | 6188 | 5.2 |
| Education | ||||||
| Less than High School | 15699 | 12.1 | 6343 | 13.0 | 9356 | 11.1 |
| High School | 47341 | 27.7 | 18359 | 27.3 | 28982 | 28.1 |
| Some College or Technical School | 43248 | 27.2 | 15776 | 25.5 | 27472 | 28.8 |
| College Graduate | 53568 | 33.1 | 22800 | 34.2 | 30768 | 32.0 |
| Income | ||||||
| <$10,000 | 9768 | 5.7 | 2613 | 4.3 | 7155 | 7.1 |
| $10,000-$15,000 | 10178 | 5.5 | 3010 | 4.7 | 7168 | 6.4 |
| $15,000-$20,000 | 12532 | 7.3 | 3979 | 6.5 | 8553 | 8.1 |
| $20,000-$25,000 | 15171 | 9.1 | 5332 | 8.5 | 9839 | 9.8 |
| $25,000-$35,000 | 21101 | 12.4 | 8192 | 12.6 | 12909 | 12.2 |
| $35,000-$50,000 | 26574 | 15.4 | 10888 | 15.3 | 15686 | 15.5 |
| $50,000-$75,000 | 27431 | 17.2 | 11919 | 18.0 | 15512 | 16.4 |
| $75,000+ | 37101 | 27.3 | 17345 | 30.1 | 19756 | 24.5 |
Sleep Complaints or Insomnia
The SC item can be endorsed by individuals who sleep either too much or too little and thus may be endorsed by individuals with heterogeneous complaints. In order to better understand the meaning of this item (e.g., How much of the variance explained by this item reflects insomnia or sleep insufficiency?), responses to the SC question were compared to responses to a similar item asked of a subset of respondents (n=14,238) regarding sleep insufficiency (SI; “During the past 30 days, for about how many days have you felt you did not get enough rest or sleep?”). Both SC (range=0-14) and SI (range=0-30) were analyzed as continuous variables for this comparison, and SC values were only included from individuals who also reported SI. A Pearson correlation demonstrated that these two items are associated with each other to a significant degree (r=.47, p<.0001) but are not collinear (r2=.22) and thus not likely to reflect the same construct.
Categorical Variables Examined Alone and Adjusting for Covariates
Table 1 displays the percentage of respondents indicating SC across race/ethnicity, education level, marital status, employment status and income level. Table 2 displays the unadjusted OR, 95% CI and p values for all levels of these factors. A multivariate model adjusting for all covariates, including race/ethnicity, education level, marital status, employment status and income evaluated SC among groups was then conducted; Table 3 displays the adjusted values.
Table 2.
Unadjusted Odds Ratios (OR) and 95% Confidence Intervals (CI) for reports of SC in Women and Men for Ethnicity, Education, Marital Status, Employment Status, and Income
| N=159856 | Female | Male | ||||||
|---|---|---|---|---|---|---|---|---|
| OR | 95% CI | p-value | OR | 95% CI | p-value | |||
| Ethnicity (Reference Group = White) | ||||||||
| Black or African American | 1.00 | 0.85 | 1.16 | 0.95 | 0.95 | 0.86 | 1.06 | 0.37 |
| Asian or Other | 0.92 | 0.72 | 1.18 | 0.53 | 0.73 | 0.61 | 0.87 | 0.001 |
| Multiracial | 1.71 | 1.24 | 2.37 | 0.001 | 1.94 | 1.56 | 2.42 | <.0001 |
| Hispanic or Latino | 0.78 | 0.65 | 0.94 | 0.008 | 0.87 | 0.77 | 0.98 | 0.03 |
| Education (Reference Group = College Graduate) | ||||||||
| Less than High School | 1.78 | 1.50 | 2.10 | <.0001 | 2.13 | 1.87 | 2.41 | <.0001 |
| High School Graduate | 1.69 | 1.49 | 1.93 | <.0001 | 1.73 | 1.58 | 1.90 | <.0001 |
| Some College | 1.53 | 1.34 | 1.74 | <.0001 | 1.60 | 1.46 | 1.75 | <.0001 |
| Marital Status (Reference Group = Married) | ||||||||
| Divorced | 2.24 | 1.97 | 2.55 | <.0001 | 1.61 | 1.48 | 1.75 | <.0001 |
| Widowed | 1.86 | 1.57 | 2.21 | <.0001 | 1.26 | 1.14 | 1.39 | <.0001 |
| Never Married | 3.07 | 2.09 | 4.50 | <.0001 | 2.14 | 1.77 | 2.60 | <.0001 |
| Separated | 1.86 | 1.61 | 2.14 | <.0001 | 1.30 | 1.16 | 1.46 | <.0001 |
| Part of Unmarried Couple | 1.72 | 1.32 | 2.24 | <.0001 | 1.60 | 1.30 | 1.96 | <.0001 |
| Employment Status (Reference Group = Employed) | ||||||||
| Self-Employed | 1.21 | 1.04 | 1.41 | 0.01 | 1.18 | 1.03 | 1.35 | 0.02 |
| Unemployed >1 Year | 3.86 | 2.69 | 5.54 | <.0001 | 2.73 | 2.18 | 3.41 | <.0001 |
| Unemployed <1 Year | 3.66 | 2.76 | 4.86 | <.0001 | 2.37 | 1.92 | 2.92 | <.0001 |
| Homemaker | 2.82 | 1.30 | 6.11 | 0.01 | 1.19 | 1.06 | 1.34 | 0.003 |
| Student | 1.76 | 1.27 | 2.46 | 0.001 | 1.31 | 1.04 | 1.67 | 0.03 |
| Retired | 1.28 | 1.14 | 1.44 | <.0001 | 1.06 | 0.97 | 1.15 | 0.19 |
| Unable to Work | 7.37 | 6.31 | 8.61 | <.0001 | 5.53 | 4.93 | 6.20 | <.0001 |
| Income (Reference Group = $75,000+) | ||||||||
| < $10,000 | 3.56 | 2.82 | 4.50 | <.0001 | 2.56 | 2.21 | 2.96 | <.0001 |
| $10,000 - $15,000 | 2.57 | 2.05 | 3.23 | <.0001 | 2.58 | 2.24 | 2.96 | <.0001 |
| $15,000 - $20,000 | 2.08 | 1.72 | 2.50 | <.0001 | 2.33 | 2.03 | 2.69 | <.0001 |
| $20,000 - $25,000 | 1.85 | 1.56 | 2.20 | <.0001 | 1.95 | 1.71 | 2.21 | <.0001 |
| $25,000 - $35,000 | 1.71 | 1.42 | 2.05 | <.0001 | 1.64 | 1.45 | 1.85 | <.0001 |
| $35,000 - $50,000 | 1.38 | 1.17 | 1.63 | 0.0001 | 1.48 | 1.31 | 1.66 | <.0001 |
| $50,000 - $75,000 | 1.12 | 0.95 | 1.33 | 0.18 | 1.25 | 1.11 | 1.40 | 0.0002 |
Table 3.
Adjusted Odds Ratios (OR) and 95% Confidence Intervals (CI) for reports of SC in Women and Men for Race/Ethnicity, Education, Marital Status, Employment Status, and Income
| N=159856 | Female | Male | ||||||
|---|---|---|---|---|---|---|---|---|
| OR | 95% CI | p-value | OR | 95% CI | p-value | |||
| Ethnicity (Reference Group = White) | ||||||||
| Black or African American | 0.74 | 0.55 | 1.00 | 0.047 | 0.76 | 0.46 | 1.27 | 0.296 |
| Asian or Other | 0.42 | 0.29 | 0.61 | <.0001 | 0.43 | 0.24 | 0.76 | 0.004 |
| Multiracial | 1.67 | 1.09 | 2.55 | 0.018 | 0.70 | 0.31 | 1.60 | 0.402 |
| Hispanic or Latino | 0.74 | 0.56 | 0.97 | 0.030 | 0.89 | 0.52 | 1.51 | 0.656 |
| Education (Reference Group = College Graduate) | ||||||||
| Less than High School | 1.64 | 1.40 | 1.92 | <.0001 | 1.35 | 1.12 | 1.64 | 0.002 |
| High School Graduate | 1.31 | 1.17 | 1.46 | <.0001 | 1.27 | 1.10 | 1.46 | 0.001 |
| Some College | 1.30 | 1.17 | 1.44 | <.0001 | 1.22 | 1.08 | 1.39 | 0.002 |
| Marital Status (Reference Group = Married) | ||||||||
| Divorced | 1.24 | 1.12 | 1.37 | <.0001 | 1.52 | 1.31 | 1.76 | <.0001 |
| Widowed | 0.92 | 0.82 | 1.03 | 0.15 | 1.06 | 0.87 | 1.29 | 0.550 |
| Never Married | 1.62 | 1.32 | 1.99 | <.0001 | 1.74 | 1.05 | 2.91 | 0.033 |
| Separated | 1.15 | 1.01 | 1.32 | 0.04 | 1.43 | 1.18 | 1.72 | 0.0003 |
| Part of Unmarried Couple | 1.39 | 1.11 | 1.73 | 0.004 | 2.02 | 1.43 | 2.85 | <.0001 |
| Employment Status (Reference Group = Employed) | ||||||||
| Self-Employed | 1.21 | 1.06 | 1.39 | 0.006 | 1.25 | 1.06 | 1.47 | 0.007 |
| Unemployed >1 Year | 2.22 | 1.76 | 2.80 | <.0001 | 2.97 | 1.83 | 4.82 | <.0001 |
| Unemployed <1 Year | 1.97 | 1.60 | 2.43 | <.0001 | 2.91 | 1.96 | 4.32 | <.0001 |
| Homemaker | 1.18 | 1.05 | 1.33 | 0.007 | 3.44 | 1.37 | 8.65 | 0.009 |
| Student | 1.13 | 0.89 | 1.45 | 0.32 | 1.26 | 0.82 | 1.94 | 0.290 |
| Retired | 0.91 | 0.83 | 1.01 | 0.07 | 1.22 | 1.07 | 1.39 | 0.002 |
| Unable to Work | 4.19 | 3.71 | 4.74 | <.0001 | 5.54 | 4.55 | 6.76 | <.0001 |
| Income (Reference Group = $75,000+) | ||||||||
| < $10,000 | 1.52 | 1.26 | 1.83 | <.0001 | 1.47 | 1.07 | 2.03 | 0.017 |
| $10,000 - $15,000 | 1.84 | 1.55 | 2.18 | <.0001 | 1.88 | 1.41 | 2.52 | <.0001 |
| $15,000 - $20,000 | 1.75 | 1.49 | 2.06 | <.0001 | 1.53 | 1.19 | 1.97 | 0.001 |
| $20,000 - $25,000 | 1.58 | 1.36 | 1.83 | <.0001 | 1.45 | 1.18 | 1.78 | 0.0004 |
| $25,000 - $35,000 | 1.39 | 1.22 | 1.60 | <.0001 | 1.20 | 0.98 | 1.46 | 0.079 |
| $35,000 - $50,000 | 1.32 | 1.16 | 1.49 | <.0001 | 1.18 | 0.98 | 1.41 | 0.075 |
| $50,000 - $75,000 | 1.15 | 1.02 | 1.30 | 0.02 | 0.91 | 0.76 | 1.09 | 0.315 |
Sleep Complaints and Ethnicity
In unadjusted analyses (Table 2), the Multiracial group was the only racial/ethnic group to report more SC than the reference category of White for both men and women. For females, the only other significant difference as a function of race/ethnicity was that the Hispanic group reported less SC than Whites. For males, both Asian and Hispanic groups reported less SC than White males. Once adjusted for other covariates (Table 3 and Figure 1), Black women now had less SC than White women. Hispanic women continued to have less SC than White women. For men, the only significant difference that remained was the reduced OR for SC in Asian/Other men; Multiracial males no longer had more SC than White males and Hispanic males no longer had less SC than White males, suggesting that for these groups, other socio-economic factors explained the different rates of SC in those race/ethnic groups relative to White males.
Figure 1.
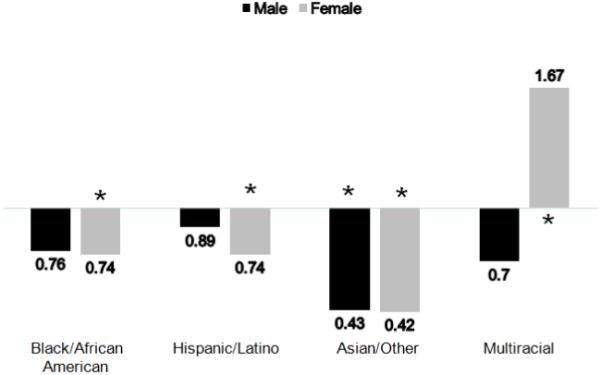
Odds Ratios (ORs) of SC for Men and Women, Across Race/Ethnicity (Reference Group = White). Among women, Asian/Other respondents reported the least SC, followed by Black/African-American and Latina respondents. These groups significantly differed from White women. Multiracial women reported significantly more SC than White women. For men, While trends for less SC compared to White men were seen in all groups, only Asian/Other men differed significantly.
Sleep Complaints and Education
There was an inverse relationship between SC and education level, with the lowest education level predicting the highest SC in both gender groups (Table 2). In the adjusted model (Table 3 and Figure 2), using college graduates as the reference group, this pattern was maintained for both men and women, such that all groups reported more SC than the reference group, and reports of SC decreased as higher levels of educational attainment are reported. For women, a significant interaction was found, in that this relationship depended on race/ethnicity (described below).
Figure 2.
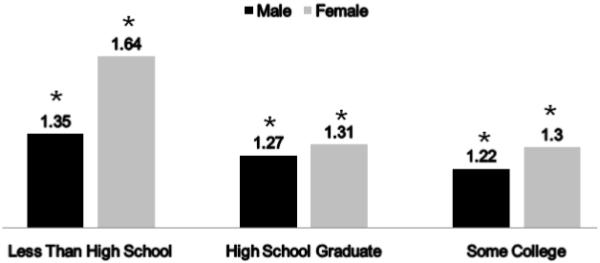
Odds Ratios (ORs) of SC for Men and Women, Across Education Level (Reference Group = College Graduate). For both men and women, all groups reported more SC than college graduates.
Sleep Complaints and Marital Status
A significant association was observed between SC and marital status such that the highest likelihood of reporting SC occurred in all non-married groups of men and women in unadjusted analyses (Table 2). For both men and women, the highest ORs for SC were for those who were divorced and never married. In adjusted analyses (Table 3 and Figure 3), these differences were markedly attenuated but persisted in all cases except for those of widowed status.
Figure 3.
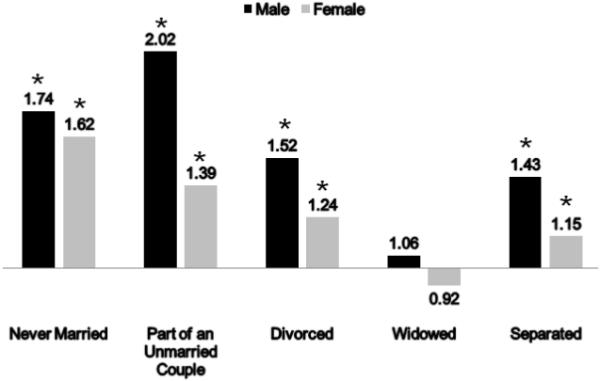
Odds Ratios (ORs) of SC for Men and Women, Across Marital Status (Reference Group = Married). Except for widowed respondents, all groups reported significantly more SC than married respondents. The highest rates were for those never married or part of an unmarried couple.
Sleep Complaints and Employment Status
In unadjusted analyses (Table 2), men and women in all non-employed categories had higher odds for SC compared to employed with the highest likelihood observed for both genders in the following categories: unable to work (approximately 3-7-fold), unemployed <1 year (approximately 2-fold), and unemployed >1 year (approximately 2-3-fold). In women, adjusted analysis (Table 3 and Figure 4) attenuated these associations for SC but the OR remained significant in all non-employed categories but the student group. Interestingly, in men, very different findings were observed in adjusted analysis: the likelihood for SC increased in five categories (self-employed, unemployed <1 year, unemployed >1 year, homemaker, and retired) compared to the referent group. The most prominent increase was for male homemakers, who had an OR of 3.44 (1.37 – 8.65, p=0.009) relative to the reference category of employed males; the comparable OR in females was 1.18 (1.05-1.33, p=0.007). Unemployed status greater than 1 year was associated with increased odds ratio for SC in both genders than unemployed less than 1 year, and this finding persisted in multivariable analysis. Overall, when compared to the respective referent group, men in non-employed categories had higher adjusted odds for SC than females.
Figure 4.
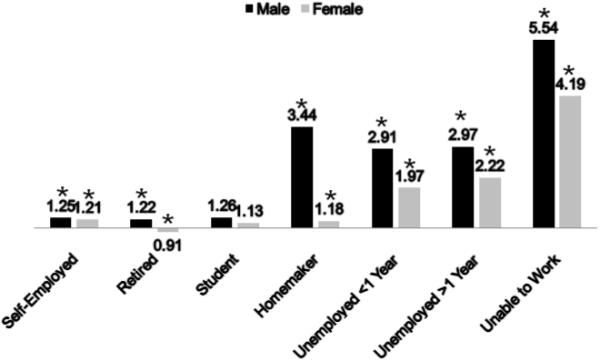
Odds Ratios (ORs) of SC for Men and Women, Across Employment Status (Reference Group = Employed).For both men and women, unemployment was associated with increased SC. Employment conveyed slight benefit over self-employment and retirement in men, but not women. Rates of SC in homemakers were similar to self-employment for women, but unemployment for men.
Sleep Complaints and Income
Almost all categories of income for men and women had significantly increased OR for SC compared to the reference category (income greater than $75,000; Table 2). For men and women, an inverse linear relationship was observed between income and SC, with progressively higher OR for SC as income category decreased. In the adjusted analysis (Table 3 and Figure 5), virtually all income categories had increased odds for SC, but the OR did not increase as prominently with declining income as in unadjusted analysis. Indeed, the lowest income group was no longer the highest risk group for SC after adjustment.
Figure 5.
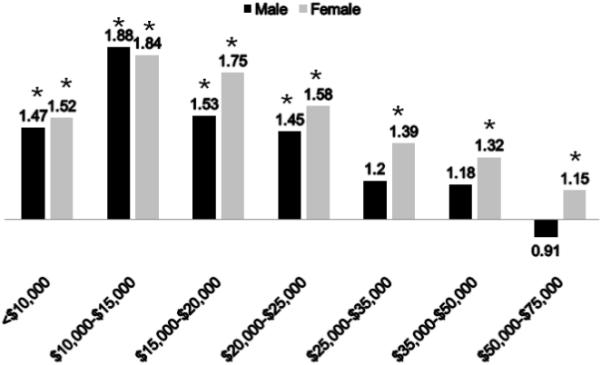
Odds Ratios (ORs) of SC for Men and Women, Across Income (Reference Group = >$75,000). Decreasing income was associates with increased rates of SC in men and women. However, there were no significant differences among men earning $25,000 or more.
Interactions Among Covariates
When interactions among race/ethnicity and other covariates were explored from the adjusted model, some interesting patterns emerged (Table 4). In this analysis, white married males were used as the reference category. For marital status, Black/African American men were protected from SC if they were part of an unmarried couple. Hispanic/Latino men were more sensitive to being divorced or widowed. Also, Asian/Other men were more prone than White married men to SC if the Asian/Other men were widowed, separated or never married. Most notably, they experienced over a 10-fold increase in risk if they were separated. Special sensitivity to being separated was also evidenced in Multiracial men, who experienced a nearly 7.5-fold increase in likelihood of reporting SC, reflecting a significant difference from White married men.
Table 4.
Adjusted Odds Ratios (OR) and 95% Confidence Intervals (CI) of SC for Significant Interactions between Ethnicity and Education for Women and Marital Status, Employment Status, and Income for Men*
| Race/Ethnicity (Reference Group = White) | ||||
|---|---|---|---|---|
|
Black or African American |
Asian or Other | Multiracial | Hispanic or Latino | |
| Marital Status for Men (Reference Group = Married) | ||||
| Divorced | - | - | - | 2.87a (1.54, 5.32) |
| Widowed | - | 3.35b (1.03, 10.93) | - | 2.20b (1.04, 4.68) |
| Separated | - | 10.43a (2.98, 36.50) | 7.47b (1.67, 33.53) | - |
| Never married | - | 2.44b (1.37, 4.37) | - | - |
| Unmarried couple | 0.40a (0.18, 0.87) | - | - | - |
| Employment Status for Men (Reference Group = Employed) | ||||
| Self-employed | - | - | - | - |
| Out of work for more than 1 year | - | - | - | - |
| Out of work for less that 1 year | 1.28a (0.58, 2.8) | - | - | - |
| A homemaker | 0.13a (0.01, 1.41) | - | - | - |
| A student | - | - | - | - |
| Retired | 0.67a (0.42, 1.08) | - | - | - |
| Unable to work | - | - | - | - |
| Income for Men (Reference Group = $75,000+) | ||||
| Less than $10,000 | - | - | 7.52a (2.28, 24.83) | - |
| $10,000 to less than $15,000 | - | - | - | 0.32a (0.15, 0.71) |
| $15,000 to less than $20,000 | - | - | - | 0.47a (0.23, 1.00) |
| $20,000 to less than $25,000 | - | - | - | 0.52a (0.27, 1.04) |
| $25,000 to less than $35,000 | - | - | - | - |
| $35,000 to less than $50,000 | - | - | - | 0.51a (0.25, 1.03) |
| $50,000 to less than $75,000 | - | 2.22a (1.09, 4.54) | - | - |
| Education for Women (Reference Group = College Graduate) | ||||
| Less than High school | - | 3.49a (1.95, 6.25) | - | 0.97a (0.67, 1.43) |
| High school graduate | - | 2.71a (1.67, 4.42) | - | - |
| Some college or technical school | - | 2.51a (1.53, 4.13) | 0.76b (0.44, 1.30) | - |
Models were evaluated separately for men and women and included age, income, education, marital status, and employment status.
OR is significantly different from the OR for White (p < 0.05)
OR is marginally significantly different from the OR for White (p < 0.10)
OR is not significantly different from the OR for White
Regarding employment status, only Black/African American men had an association between SC and employment. They were much less likely to report SC (compared to White employed males) if they were a homemaker. This is in contrast to the male group as a whole, which had a much greater risk of reporting SC as a homemaker. They were also less likely to report SC if they were retired, and more likely to report SC if they were out of work for <1 year.
For income, Hispanic/Latino men were less likely to report SC (compared to $75,000+) if they reported income between $10,000-$15,000, $15,000-$20,000, $20,000-$25,000, and $35,000-$50,000, compared to White men in the highest income group. Compared to this group, Multiracial men were much more likely to report SC if they were in the lowest income group, and Asian/Other men were more likely to report SC if they reported income of $50,000-$75,000.
Education only demonstrated significant interaction terms for females. Asian/Other women demonstrated a 2-3-fold increased likelihood of reporting SC compared to college graduates, whether they did not complete high school, were a high school graduate, or had some college. All of these were significantly different from White women. Multiracial women who received some college reported less SC than college graduates, while all other groups reported more, and this OR was significantly different from that of White women. Hispanic/Latina women were less likely to report SC if they did not finish high school—a pattern not seen in any other group; this OR was also significantly different than that for White women.
DISCUSSION
The present study examined self-reported sleep complaints reported as part of the 2006 cohort of the BRFSS. These findings show that men and women differ regarding how SC is distributed among sociodemographic groups. Also, SC is associated with income and education, being married and employed, and race/ethnicity. In the adjusted analyses, there was no significant relationship between SC and age, suggesting that any variance explained by age is already explained by the other variables in the model.
Although a growing body of literature examines the self-reported duration of sleep and the prevalence of sleep disorders in various population samples, this study to the best of our knowledge examines the population burden of sleep complaints in the largest sample to date.
Sleep Complaints in Ethnic/Racial Groups
These findings show that, after adjusting for all covariates, Multiracial women were more likely to report SC and Hispanic/Latina women were less likely. This pattern was not maintained for men, for whom those who were Asian/Other reported less SC. No other patterns were significant. There were no differences observed between White and Black/African American men or women in either adjusted or unadjusted analyses. Current literature about the nature of sleep complaints in African Americans is very unclear. Some reports suggest increased problems14, 26-27, but others do not28-29. It is also unclear why so few statistically significant differences were found among racial/ethnic groups in these analyses, even in unadjusted analyses. Perhaps SC refers to a characteristic that is not distributed differently across groups because it is so inclusive of any problems. Or, perhaps those in minority groups were less likely to report problems, even if they existed, especially if they have perceived disrespect and discrimination by medical professionals in the past30.
Regarding the interactions between race/ethnicity and other variables, it is unclear why being part of an unmarried couple is associated with less SC for Black/African American men, or why being divorced is particularly detrimental to the sleep of Hispanic/Latino men, being widowed is particularly detrimental to the sleep of Hispanic/Latino and Asian/Other men, being never married is particularly detrimental to the sleep of Asian/Other men, or why being separated is associated with a 7-10-fold increase in likelihood of SC in Multiracial and Asian/Other men, when this magnitude is not evidenced in other groups. For women, Asian/Other women were more sensitive to lower levels of education compared to White women. Perhaps this group is particularly vulnerable to stress at lower levels of educational attainment, relative to White women. Hispanic/Latina women at lower educational levels were less likely to report SC than college graduates, although slightly. It is unclear why some women in this group would apparently benefit from less education or why differences in SC relative to education level were differentially distributed across ethnic/racial groups only in women and why interactions with the other variables were only seen in men. This suggests that men may be differentially sensitive to the fluctuating categories of social position and socioeconomic status, while women may differentiate more relative to the variable that does not change much after adulthood-ducational attainment. These interactions present many questions to be explored in future research and may help shed light on differences between racial/ethnic groups for the relationship between SES factors and sleep complaints.
Socioeconomic Factors: Income and Employment
Consistent with a handful of studies that have examined the influence of SES factors on either sleep duration and sleep quality12, 14, 19, 31-38, this study found that the socioeconomically disadvantaged have higher likelihood of SC. We also found differing effects of employment on SC by gender. An increased likelihood of SC conferred by non-employed status in women was substantially explained by other factors including race/ethnicity, marital status, income, and education. In contrast, in men, this association was strengthened by the inclusion of these potential confounders suggesting a moderating or mediating effect. Furthermore, male homemaker status was associated substantially greater odds for SC than women when compared to their respective referent groups. Taken together, this would suggest that men and women’s vulnerability to SC may be through different mechanisms. The direction of these associations cannot be ascertained on account of the cross-sectional nature of this analysis. However, potential explanations could be that men’s reported sleep complaints may be more subject to the effects of a confluence of socioeconomic (education, employment, and income) and socio-demographic (race, marital status and age) factors, though it could also be the case that impairments due to sleep loss could result in decreased performance and resultant decreases in achievement.
Education
This study found that higher levels of education are associated with less SC, consistent with the findings associated with income. However, while the magnitude of the ORs for income were greatly attenuated in the adjusted model (some by more than half), the reductions in magnitude of the ORs for education was much less. This suggests that while the effect of income is somewhat dependent on other factors, the effect of education is relatively robust. Unadjusted analyses show that the relationship between sleep complaints and lower education may be stronger in women, but adjusted analyses reveal the opposite – men were more likely to exhibit SC if they were at lower educational levels, especially if they did not finish high school. This is consistent with previous studies, which have shown that those with more education report better sleep12, 19.
Marital Status
The relationship between SC and marital status has not received much scientific attention. Hale and colleagues reported that unmarried individual were more likely to be either short or long sleepers compared to their married counterparts12. This study also reported that the divorced endorse more sleep problems than married or single individuals. Other studies have examined the issue from the opposite perspective by assessing the impact of poor sleep on marital satisfaction and have generally found that sleep problems in one or both spouses were associated with higher levels of marital unhappiness39-40. Similarly, a longitudinal study found that fewer sleep problems at baseline were associated with greater marital harmony at follow-up41. Thus marriage may overall serve as a protective factor for SC, but the presence of SC and marital disharmony may have a reciprocal relationship.
Limitations
This study has a number of limitations. First, the item that is asked is not specific for a particular sleep symptom. This limits our ability to use responses to this item to describe symptoms or syndromes (e.g., insufficient sleep, long sleep, insomnia, sleep apnea, daytime sleepiness). The broad nature of the sleep complaints question captures a gamut of etiologies for suboptimal sleep including acute and chronic partial sleep deprivation, insomnia, poor sleep quality, and excessive sleep. SC is not a typical metric that has been employed in epidemiologic analyses of sleep in the population. However, it provides a valuable and sensitive estimate of suboptimal sleep, for whatever reason, in the general population. We purport that the item is sensitive because almost any problem associated with sleep – especially the most common (sleep insufficiency, sleep fragmentation, insomnia, sleep apnea, restless legs, etc.) could be captured by this question. However, this question has not been validated against standard measures of subjective and objective sleep. We do not know whether those that endorse this question really do have any objective sleep problems or subjective sleep problems that would have been captured with validated instruments. This is a major limitation of the item. However, we still believe that this is a useful item, as it provides an overall indicator of the presence of sleep complaints, with almost none of the limitations that would be applied if specific symptoms had been targeted. This general level of complaint demonstrates a great deal of face validity and, more importantly, external validity, as it represents the vague complaints presented when people discuss sleep problems42-44.
This is pertinent as recognition for the importance of sleep and sleep disorders in public health continues to rise3. Second, cross-sectional analyses limit our ability to comment on causality or age-related changes. Thus, SC levels associated with age ranges may reflect cohort effects in addition to age-related effects, and SC associated with group membership may reflect other causes as well.
Conclusions
These results summarize analyses of a large, representative sample that reported sleep complaints. Given the power inherent in such a large sample, subtle and complex relationships were discovered. The large sample size and broad sleep measure allow us to posit important population-level observations about sleep in the USA. Based on these data, it is clear that socioeconomic variables are related to sleep complaints in general (greater socioeconomic status is associated with less sleep complaints) but the specifics of this relationship are complex. The sleep of men may be more sensitive to more social variables such as marital status, employment status and ethnicity, while the sleep of women may be more sensitive to more concrete measures of status, such as income and education. Further complicating this issue, racial/ethnic differences seem to show interesting relationships with lower income and educational attainment in Hispanic/Latino men and women, employment status in African American men, relationship status in Asian/Other men and educational attainment in Asian/Other women. Analyses of smaller sample sizes reporting SES differences in sleep duration and quality are supported by this analysis, and given the large observed power we were able to advance this understanding to uncover more subtle relationships.
Regarding future directions, this study highlights specific subgroups of the population who should be targeted more heavily with sleep-related public health initiatives. These initiatives also need to be tailored to particular racial/ethnic groups because of the significant interactions.
ACKNOWLEDGEMENT
This work was supported by T32HL007713 as well as funding for Biostatistical Support from the University of Pennsylvania Center for Sleep and Respiratory Neurobiology. We wish to thank Dr. Allan Pack, MB, ChB, PhD for guidance and other support. Also, we wish to thank the Centers for Disease Control and Prevention for collecting this data and making it available.
Footnotes
Publisher's Disclaimer: This is a PDF file of an unedited manuscript that has been accepted for publication. As a service to our customers we are providing this early version of the manuscript. The manuscript will undergo copyediting, typesetting, and review of the resulting proof before it is published in its final citable form. Please note that during the production process errors may be discovered which could affect the content, and all legal disclaimers that apply to the journal pertain.
REFERENCES
- 1.Grandner MA, Patel NP, Hale L, Moore M. Mortality associated with sleep duration: The evidence, the possible mechanisms, and the future. Sleep Med Rev. 2009 doi: 10.1016/j.smrv.2009.07.006. [DOI] [PMC free article] [PubMed] [Google Scholar]
- 2.Grandner MA, Patel NP. From sleep duration to mortality: implications of meta-analysis and future directions. J Sleep Res. 2009;18(2):145–147. doi: 10.1111/j.1365-2869.2009.00753.x. [DOI] [PMC free article] [PubMed] [Google Scholar]
- 3.Colten HR, Altevogt BM, Institute of Medicine Committee on Sleep Medicine and Research . Sleep disorders and sleep deprivation : an unmet public health problem. Institute of Medicine : National Academies Press; Washington, DC: 2006. [PubMed] [Google Scholar]
- 4.Mullington JM, Haack M, Toth M, Serrador JM, Meier-Ewert HK. Cardiovascular, inflammatory, and metabolic consequences of sleep deprivation. Prog Cardiovasc Dis. 2009 Jan-Feb;51(4):294–302. doi: 10.1016/j.pcad.2008.10.003. [DOI] [PMC free article] [PubMed] [Google Scholar]
- 5.Pinto LR, Jr., Pinto MC, Goulart LI, et al. Sleep perception in insomniacs, sleep-disordered breathing patients, and healthy volunteers - An important biologic parameter of sleep. Sleep Med. 2009 Jan 27; doi: 10.1016/j.sleep.2008.06.016. [DOI] [PubMed] [Google Scholar]
- 6.Beihl DA, Liese AD, Haffner SM. Sleep duration as a risk factor for incident type 2 diabetes in a multiethnic cohort. Ann Epidemiol. 2009 May;19(5):351–357. doi: 10.1016/j.annepidem.2008.12.001. [DOI] [PubMed] [Google Scholar]
- 7.Gellis LA, Lichstein KL, Scarinci IC, et al. Socioeconomic status and insomnia. J Abnorm Psychol. 2005 Feb;114(1):111–118. doi: 10.1037/0021-843X.114.1.111. [DOI] [PubMed] [Google Scholar]
- 8.Patel NP, Gooneratne N, Xie D, Branas CC. Poverty effects on population sleep. SLEEP. 2008;31(Abstract Supplement):A353. [Google Scholar]
- 9.Sekine M, Chandola T, Martikainen P, McGeoghegan D, Marmot M, Kagamimori S. Explaining social inequalities in health by sleep: the Japanese civil servants study. J Public Health (Oxf) 2006 Mar;28(1):63–70. doi: 10.1093/pubmed/fdi067. [DOI] [PubMed] [Google Scholar]
- 10.Adams J. Socioeconomic position and sleep quantity in UK adults. J Epidemiol Community Health. 2006 Mar;60(3):267–269. doi: 10.1136/jech.2005.039552. [DOI] [PMC free article] [PubMed] [Google Scholar]
- 11.Moore PJ, Adler NE, Williams DR, Jackson JS. Socioeconomic status and health: the role of sleep. Psychosom Med. 2002 Mar-Apr;64(2):337–344. doi: 10.1097/00006842-200203000-00018. [DOI] [PubMed] [Google Scholar]
- 12.Hale L. Who has time to sleep? J Public Health (Oxf) 2005 Jun;27(2):205–211. doi: 10.1093/pubmed/fdi004. [DOI] [PubMed] [Google Scholar]
- 13.Kripke DF, Garfinkel L, Wingard DL, Klauber MR, Marler MR. Mortality associated with sleep duration and insomnia. Arch Gen Psychiatry. 2002 Feb;59(2):131–136. doi: 10.1001/archpsyc.59.2.131. [DOI] [PubMed] [Google Scholar]
- 14.Lauderdale DS, Knutson KL, Yan LL, et al. Objectively measured sleep characteristics among early-middle-aged adults: the CARDIA study. Am J Epidemiol. 2006 Jul 1;164(1):5–16. doi: 10.1093/aje/kwj199. [DOI] [PubMed] [Google Scholar]
- 15.Krueger PM, Friedman EM. Sleep duration in the United States: a cross-sectional population-based study. Am J Epidemiol. 2009 May 1;169(9):1052–1063. doi: 10.1093/aje/kwp023. [DOI] [PMC free article] [PubMed] [Google Scholar]
- 16.McKnight-Eily LR, Presley-Cantrell LR, Strine TW, Chapman DP, Perry GS, Croft JB. Perceived insufficient rest or sleep--four states, 2006. MMWR Morb Mortal Wkly Rep. 2008 Feb 29;57(8):200–203. [PubMed] [Google Scholar]
- 17.Jean-Louis G, Magai C, Casimir GJ, et al. Insomnia symptoms in a multiethnic sample of American women. J Womens Health (Larchmt) 2008 Jan-Feb;17(1):15–25. doi: 10.1089/jwh.2006.0310. [DOI] [PubMed] [Google Scholar]
- 18.Stamatakis KA, Kaplan GA, Roberts RE. Short sleep duration across income, education, and race/ethnic groups: population prevalence and growing disparities during 34 years of follow-up. Ann Epidemiol. 2007 Dec;17(12):948–955. doi: 10.1016/j.annepidem.2007.07.096. [DOI] [PMC free article] [PubMed] [Google Scholar]
- 19.Friedman EM, Love GD, Rosenkranz MA, et al. Socioeconomic status predicts objective and subjective sleep quality in aging women. Psychosom Med. 2007 Sep-Oct;69(7):682–691. doi: 10.1097/PSY.0b013e31814ceada. [DOI] [PubMed] [Google Scholar]
- 20.Patel SR, Malhotra A, Gottlieb DJ, White DP, Hu FB. Correlates of long sleep duration. Sleep. 2006 Jul 1;29(7):881–889. doi: 10.1093/sleep/29.7.881. [DOI] [PMC free article] [PubMed] [Google Scholar]
- 21.Kronholm E, Harma M, Hublin C, Aro AR, Partonen T. Self-reported sleep duration in Finnish general population. J Sleep Res. 2006 Sep;15(3):276–290. doi: 10.1111/j.1365-2869.2006.00543.x. [DOI] [PubMed] [Google Scholar]
- 22.Centers for Disease Control . Behavioral Risk Factor Surveillance System. Department of Health and Human Services, Centers for Disease Control and Prevention; Atlanta, Georgia: 2007. [Google Scholar]
- 23.Jansson-Frojmark M, Linton SJ. The course of insomnia over one year: a longitudinal study in the general population in Sweden. Sleep. 2008 Jun 1;31(6):881–886. doi: 10.1093/sleep/31.6.881. [DOI] [PMC free article] [PubMed] [Google Scholar]
- 24.SAS Institute . Base SAS 9.2 Procedures Guide: Statistical Procedures. SAS Institute; Cary, NC: 2008. [Google Scholar]
- 25.Farmer MM, Ferraro KF. Are racial disparities in health conditional on socioeconomic status? Soc Sci Med. 2005 Jan;60(1):191–204. doi: 10.1016/j.socscimed.2004.04.026. [DOI] [PubMed] [Google Scholar]
- 26.Hale L, Do DP. Racial differences in self-reports of sleep duration in a population-based study. Sleep. 2007 Sep 1;30(9):1096–1103. doi: 10.1093/sleep/30.9.1096. [DOI] [PMC free article] [PubMed] [Google Scholar]
- 27.Durrence HH, Lichstein KL. The sleep of African Americans: a comparative review. Behav Sleep Med. 2006;4(1):29–44. doi: 10.1207/s15402010bsm0401_3. [DOI] [PubMed] [Google Scholar]
- 28.Jean-Louis G, Magai C, Consedine NS, et al. Insomnia symptoms and repressive coping in a sample of older Black and White women. BMC Womens Health. 2007;7:1. doi: 10.1186/1472-6874-7-1. [DOI] [PMC free article] [PubMed] [Google Scholar]
- 29.Roberts RE, Roberts CR, Chan W. Ethnic differences in symptoms of insomnia among adolescents. Sleep. 2006 Mar 1;29(3):359–365. doi: 10.1093/sleep/29.3.359. [DOI] [PubMed] [Google Scholar]
- 30.Blanchard J, Lurie N. R-E-S-P-E-C-T: patient reports of disrespect in the health care setting and its impact on care. J Fam Pract. 2004 Sep;53(9):721–730. [PubMed] [Google Scholar]
- 31.Adams J. Socioeconomic position and sleep quantity in UK adults. J Epidemiol Community Health. 2006 Mar;60(3):267–269. doi: 10.1136/jech.2005.039552. [DOI] [PMC free article] [PubMed] [Google Scholar]
- 32.Hale L, Do P. Racial differences in self-reports of sleep duration in a population-based study. Sleep. 2007;30(9):1096–1103. doi: 10.1093/sleep/30.9.1096. [DOI] [PMC free article] [PubMed] [Google Scholar]
- 33.Karacan I, Thornby JI, Anch M, et al. Prevalence of sleep disturbance in a primarily urban Florida County. Social science & medicine (1982) 1976 May;10(5):239–244. doi: 10.1016/0037-7856(76)90006-8. [DOI] [PubMed] [Google Scholar]
- 34.Nunes J, Jean-Louis G, Zizi F, et al. Sleep duration among black and white Americans: results of the National Health Interview Survey. Journal of the National Medical Association. 2008 Mar;100(3):317–322. doi: 10.1016/s0027-9684(15)31244-x. [DOI] [PubMed] [Google Scholar]
- 35.Patel SR. Social and demographic factors related to sleep duration. Sleep. 2007 Sep 1;30(9):1077–1078. doi: 10.1093/sleep/30.9.1077. [DOI] [PMC free article] [PubMed] [Google Scholar]
- 36.Schoenborn CA. Health habits of U.S. adults, 1985: the “Alameda 7” revisited. Public Health Rep. 1986 Nov-Dec;101(6):571–580. [PMC free article] [PubMed] [Google Scholar]
- 37.Sickel AE, Moore PJ, Adler NE, Williams DR, Jackson JS. The differential effects of sleep quality and quantity on the relationship between SES and health. Ann N Y Acad Sci. 1999;896:431–434. doi: 10.1111/j.1749-6632.1999.tb08162.x. [DOI] [PubMed] [Google Scholar]
- 38.Strine TW, Chapman DP. Associations of frequent sleep insufficiency with health-related quality of life and health behaviors. Sleep Med. 2005 Jan;6(1):23–27. doi: 10.1016/j.sleep.2004.06.003. [DOI] [PubMed] [Google Scholar]
- 39.Strawbridge WJ, Shema SJ, Roberts RE. Impact of spouses’ sleep problems on partners. Sleep. 2004 May 1;27(3):527–531. doi: 10.1093/sleep/27.3.527. [DOI] [PubMed] [Google Scholar]
- 40.Troxel WM, Robles TF, Hall M, Buysse DJ. Marital quality and the marital bed: examining the covariation between relationship quality and sleep. Sleep Med Rev. 2007 Oct;11(5):389–404. doi: 10.1016/j.smrv.2007.05.002. [DOI] [PMC free article] [PubMed] [Google Scholar]
- 41.Prigerson HG, Maciejewski PK, Rosenheck RA. The effects of marital dissolution and marital quality on health and health service use among women. Med Care. 1999 Sep;37(9):858–873. doi: 10.1097/00005650-199909000-00003. [DOI] [PubMed] [Google Scholar]
- 42.Lally RM. Badge of honor or recipe for disaster? The importance of adequate sleep for nurses. ONS Connect. 2009 Mar;24(3):8–12. [PubMed] [Google Scholar]
- 43.Cole JC, Dubois D, Kosinski M. Use of patient-reported sleep measures in clinical trials of pain treatment: a literature review and synthesis of current sleep measures and a conceptual model of sleep disturbance in pain. Clin Ther. 2007;29(Suppl):2580–2588. doi: 10.1016/j.clinthera.2007.12.005. [DOI] [PubMed] [Google Scholar]
- 44.Grandner MA, Kripke DF, Yoon IY, Youngstedt SD. Criterion Validity of the Pittsburgh Sleep Quality Index: Investigation in a non-clinical sample. Sleep and Biological Rhythms. 2006;4:129–136. doi: 10.1111/j.1479-8425.2006.00207.x. [DOI] [PMC free article] [PubMed] [Google Scholar]