Abstract
Motion artifact is still a major issue in cardiac computed tomography because the current motion correction and electrocardiogram gating techniques have not fully addressed this problem. The image quality can be significantly improved by using information about the actual state of the heart and an exact reconstruction algorithm. We propose to extend a cardiac computed tomographic technique, using the knowledge of the volume and the relation between the state and the phase of the heart, to a saddle curve trajectory. This will optimize the image quality by reducing the artifacts resulting from approximate reconstruction and solve the long-object problem. Necessary background is provided, and the effectiveness of the algorithms is demonstrated in numerical simulations with the dynamic thorax phantom.
Keywords: X-ray computed tomography, dynamic volumetric cardiac imaging, saddle curve trajectory, multiphase-state reconstructions
Importance of early diagnosis of cardiovascular diseases (CVDs) cannot be overemphasized. Every year since 1900, except 1918, CVD accounted for more deaths than any other single cause or group of causes of death in the United States. Cardiovascular diseases accounted for 1 in every 2.8 deaths in the United States in 2004.1 As an established gold standard for assessing coronary arteries, coronary angiography is an invasive procedure. Whereas noninvasive cardiac imaging is a demanding application, on one hand, high temporal resolution is required to freeze the heart to avoid motion artifacts. On the other hand, high spatial resolution is required to visualize small and complex anatomy structures like the arteries.2
Cardiac computed tomography (CT) has undergone an accelerated progress in imaging capabilities in the last decade and is expected to continue in the foreseeable future.3 The introduction of single-slice helical CT in 1998 improved the volume coverage speed performance,4 which was further improved by the introduction of multislice CT (MSCT) in 1999.3 The subsecond rotation combined with MSCT made way for the use of thinner slices, thus providing an increase of the spatial resolution.5 It has been postulated that a temporal resolution of less than 19 milliseconds is required to suppress all cardiac motion artifacts.6 However, the current MSCT systems provide a temporal resolution of 83 to 210 milliseconds that cannot totally isolate coronary artery motion in all individuals.3
At present, both prospective and retrospective gating technologies are used in MSCT7 to improve temporal resolution. Retrospective gating can be used to select phases with minimum motion. However, the image quality depends on the trigger delay8 and patient physiological motions, and it often cannot accurately depict the boundaries of the cardiac structures especially for a high heart rate.9,10 These algorithms do not use information about the actual state of the heart. In 2002, Wang et al10 proposed a dynamic knowledge-based cardiac volumetric CT for the circular trajectory. This algorithm is capable of reconstructing multiple states based on the knowledge of instantaneous cardiac state. Note that a state is defined as an absolute spatial configuration of the heart as opposed to the phase, which is defined as a specific period in the cardiac cycle. The temporal and the spatial information of the beating heart are used by optimizing the strategy for selecting and merging the segments of the raw data based on the relationship between the cardiac status and the electrocardiogram (ECG). In other words, the data segments are collected when the heart is in a consistent state, so that the image reconstruction produces the best quality for any specified state. This approach could be extended to any closed and periodic trajectory.
In the knowledge-based algorithm proposed by Wang et al,10 an approximate modified generalized Feldkamp algorithm11 was used with a circular trajectory. It is well known that Feldkamp-based approximate reconstruction algorithms12 have a drop in image intensities for the planes away from the source plane. After the knowledge-based algorithm was proposed, the exact reconstruction algorithms have made a tremendous progress. An important milestone was reached when Katsevich13 proposed the first theoretically exact and efficient filtered backprojection reconstruction algorithm for the standard helical trajectory. However, this algorithm cannot be applied to more general trajectories like saddle curve. Lately, there has been considerable interest in the saddle curve source trajectory for cardiac imaging.14 This is primarily because the saddle trajectory is closed and periodic that facilitates cardiac imaging,14,15 and it also satisfies Tuy condition16 for exact reconstruction. Inspired by Katsevich’s milestone work, the exact reconstruction algorithm has been extended to generalized scanning trajectories.17–21 Although these algorithms could be used for smooth trajectories like saddle curve, the first exact and simple filtered backprojection reconstruction for saddle curve trajectory was proposed by Yang et al.22 They also reported discretization artifacts due to differentiation between views that increased with higher saddle pitches. To improve the image quality, they also proposed a view-independent reconstruction algorithm for general saddle curve trajectory.23 This algorithm not only improves the image quality but is also very suitable for parallel implementation.
The major contribution of this paper is to combine the dynamic knowledge-based volumetric CT technique and exact reconstruction algorithm for saddle curve trajectory to enable better temporal and spatial resolutions. The performance of exact reconstruction algorithm is also compared against the approximate reconstruction algorithm to emphasize the need for using the exact reconstruction algorithm. This paper is organized in the following manner. Our methods are described in section 2. Simulation results are presented in section 3, and the discussion and conclusions are provided in section 4.
MATERIALS AND METHODS
Knowledge in Cardiac CT
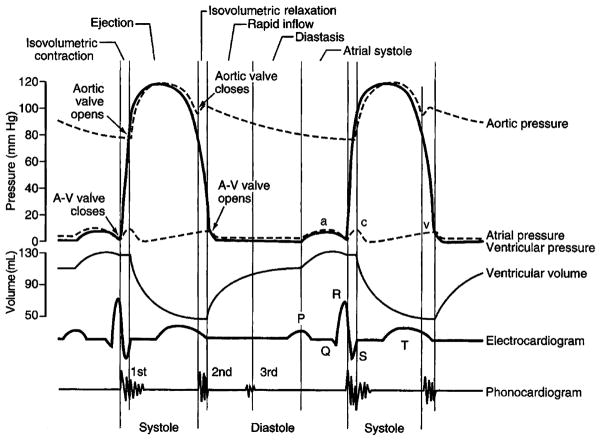
Cardiac cycle involves initiation and propagation of the electrical pulse in the heart. This pulse is initiated in the atrium at the sinoatrial node and is propagated to the ventricles by the atrioventricular (A-V) node and the Purkinje fibers. Both the atria and the ventricles go through a period of contraction called systole and a period of relaxation called diastole. Figure 1 shows the relation between pressure, flow, volumes, and ECG for the left atrium and left ventricle. P wave of the ECG represents the spread of depolarization in the atria. Atrial diastole follows atrial systole and occurs during vertricular systole. The QRS complex corresponds to the excitation of ventricular muscles, thus leading to a ventricular systole. T wave corresponds to the repolarization of the ventricles when the ventricles start relaxing. Hence, T wave occurs slightly before the end of the contraction of the ventricles.
FIGURE 1.
Cardiac cycle events demonstrating the relation between the ECG and volume.
During ventricular systole, the A-V valves are closed, and there is accumulation of venous blood in the atria. The resulting small increase in atrial pressure causes the A-V valves to open and leads to the filling of the ventricles. Atrial systole toward the end of ventricular diastole provides an additional kick to the ventricular filling. The contraction of the ventricles results in an increase of the ventricular pressure leading to the closure of the A-V valves. After this contraction, an additional buildup of pressure opens the semilunar (S-L) valves (aortic and the pulmonary). During the period between the closure of the A-V valves and the opening of the S-L valves, the ventricular volume is constant, and this period is called isovolumetric contraction. With the opening of the S-L valves, the blood is pumped out, decreasing the ventricular volume. At the end of systole, ventricles relax, leading to a drop in the ventricular pressure. At some point, the pressure within the distended pulmonary arteries and the aorta increases beyond the ventricular pressure, leading to the closure of the S-L valves. A further drop in the ventricular pressure and a buildup of the pressure in the atria opens the A-V valves. During the period between the closing of the S-L valves and the opening of the A-V valves, the volume of ventricles remains constant, and this period is called isovolumetric relaxation.
It can be seen that ECG is closely correlated to the left ventricular volume curve. Thus, we can use the left ventricular volume curve as an indicator of the state of the heart as in the study by Wang et al.10 The knowledge of the state and its relation to the phase of the heart is the key part to the knowledge-based dynamic volume cardiac CT.
Generation of Volume Curve
Under the assumption that the volume curve is continuous and periodic, the ventricular volume curve can be generated using the following basic equation:
| (1) |
where, d = (a − c)2/(fm − b)2, a ≠ c and b = f(a).
The volume curve can be divided into various sections and simulated as the follows:
Isovolumetric relaxation during ventricular systole
| (2) |
Ventricular emptying during ventricular systole
| (3) |
Isovolumetric relaxation during ventricular systole
| (4) |
Ventricular filling during diastole
| (5) |
Ventricular filling during part of atrial systole
| (6) |
Ventricular filling during the remaining of atrial systole
| (7) |
where, Tc is the period for the heart cycle.
For simplicity, systolic curve is referred as f(t) = fs(t), with 0 ≤ t ≤ t3, and the diastolic curve is referred as f (t) = fd(t), with t3 < t ≤ Tc.
It is important to extract the parameters of the volume curve to identify the different cardiac status. In our current work, we use the parameters defined by Wang et al.10 These parameters for Tc = 1 and normalized volume are given in Table 1. The values of ti’s defining the range of sections can be scaled appropriately according to the chosen period.
TABLE 1.
Parameters for Simulation of Volume Curve
| Segment | 1 | 2 | 3 | 4 | 5 | 6 |
|---|---|---|---|---|---|---|
| Range | (0,t1) | (t1,t2) | (t2,t3) | (t3,t4) | (t4,t5) | (t5,Tc) |
| ai | 0.1 (t1) | 0.1 (t1) | 0.4 (t2) | 0.5 (t3) | 0.85 (t4) | 1.0 (Tc) |
| bi | 0.95 | 0.05 | 0.95 | 0.05 | 0.92 | 1 |
| ci | 0 | 0.4 (t2) | 0.4 (t2) | 0.85 (t4) | 0.95 (t5) | 0.95 (t5) |
| fmi | 1 | 1 | 1 | 0.92 | 1.05 | 1.05 |
Concept of Multiple-Phase State Reconstruction
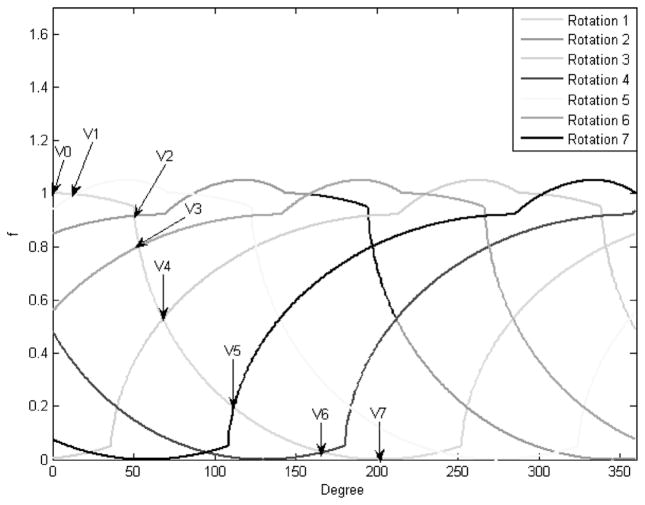
In this paper, different heart state corresponds to a different ventricular volume level. As seen from the volume curve in Figure 2, during a heart cycle, each state may be present in both the systole and the diastole, and this condition is generally satisfied. An appreciation of this fact enables multiple-state reconstruction. Because the heart is beating continuously, we will reconstruct a state interval instead of a state. Hence, the term state and state interval are synonymously used for a state interval in the rest of this paper. A source capable of variable speed is required to guarantee multiple states. The number of states that can be reconstructed is primarily determined by the ratio b = m/n, where m and n are relative prime numbers respectively proportional to the source and the cardiac periods. Assuming strict monotonicity of fs(t) and fd(t), n + 1 unique volumes can be identified. The maximum volume v0 and minimum volume vn levels are known. Remaining n − 1 states are identified at the intersection of fs(t) and fd(t − kTs), with k = 1, …,n − 1, where Ts is the source period. Shown in Figure 3, a better understanding of the concept is gained from the cycle overlapping view of the cardiac motion map. Cardiac motion map is nothing but a representation of all the cardiac volume information within 1 source rotation period that corresponds to an angular range of 0 to 360 degrees. The data outside this interval can be mapped to this range. In cycle overlapping view, different markers and line-widths are used to represent the data coming from different rotations. We now have all the information required for the full-scan reconstruction of the following n states [v0, v1], [v1, v2], …, [vn−1, vn]. This is more obvious from the data partition view shown in Figure 4. Data partition view is a cardiac motion map with data segments corresponding to different states represented with different markers and line-widths.
FIGURE 2.
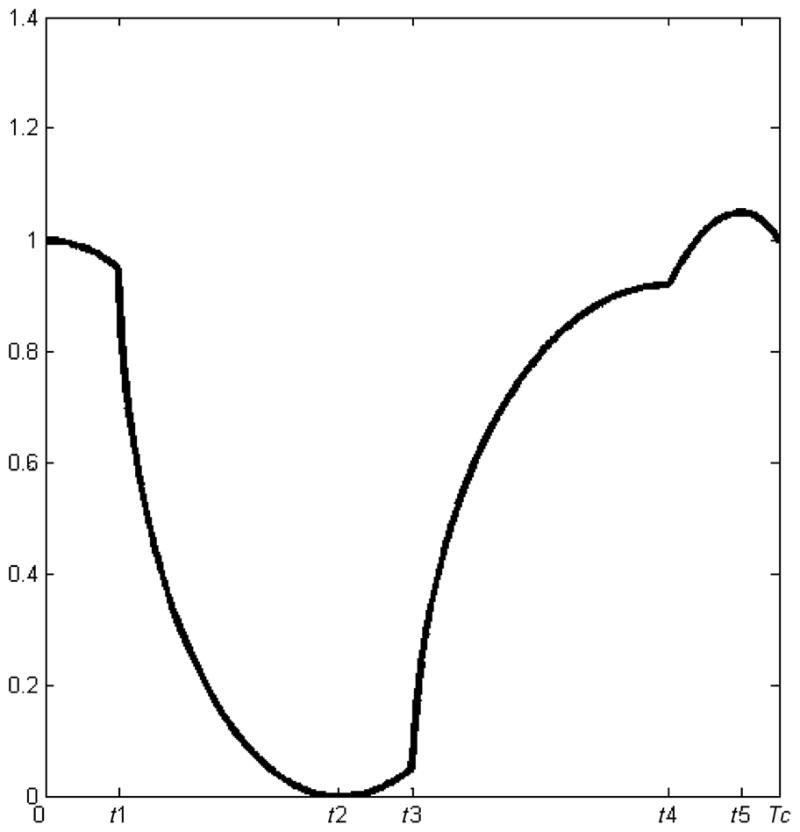
Ventricular volume curve.
FIGURE 3.
Cycle overlap view for the ratio b = 5/7.
FIGURE 4.
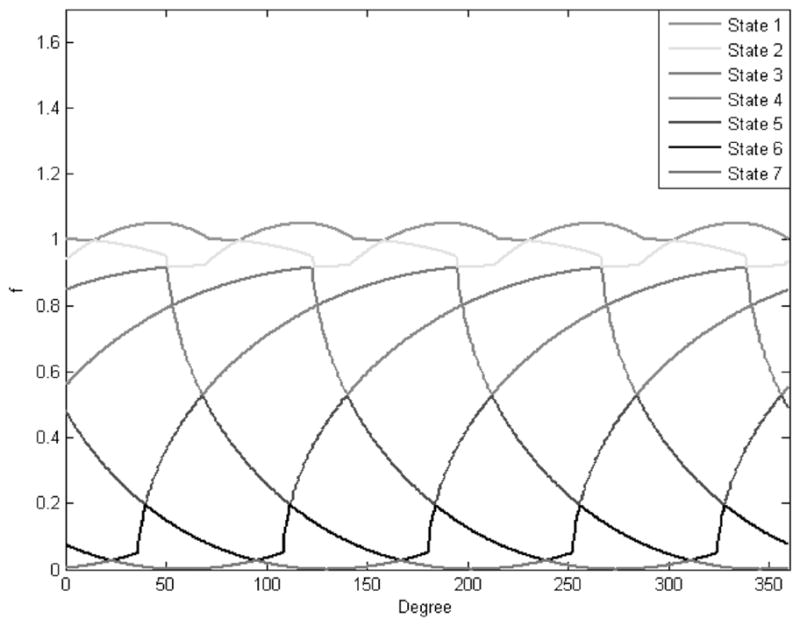
Data partition view for the ratio b = 5/7.
Geometry and Reconstruction
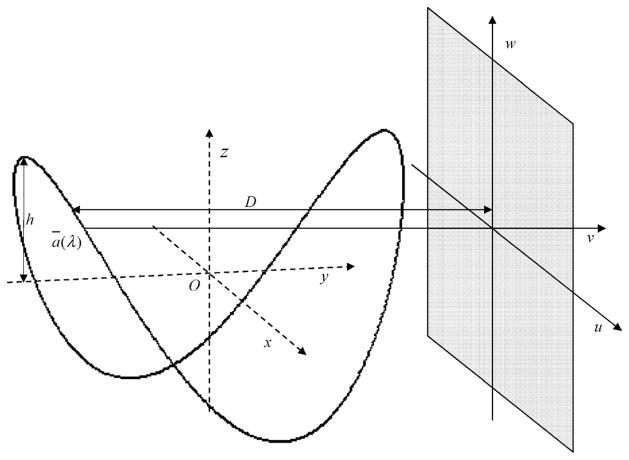
Consider an object function f assumed to be zero outside the object support x2 + y2 < r2 where, r is the radius of the object support. As shown in Figure 5, a standard saddle trajectory can then be defined as
FIGURE 5.
Saddle curve acquisition geometry.
| (8) |
where, R is the radius of the circle traced by the saddle in the x − y plane, h, the height of the saddle, and λ, the angle that parameterizes the saddle in the x − y plane.
It is assumed that the circle traced by the saddle in the x − y plane do not pass through the object support. When using the saddle curve trajectory for data acquisition, the height h is chosen so that it satisfies the Tuy condition for the standard saddle curve22
| (9) |
with h1 being the height of the reconstruction field of view (FOV). When h = 0 in the equation of saddle curve, circular trajectory is obtained, which corresponds to the circle traced by the saddle in the x − y plane.
Any point x̄ = (x, y, z) in the FOV can be reconstructed with the following view-independent exact reconstruction formula for the saddle curve trajectory23
| (10) |
where, D is the perpendicular distance of line connecting source to detector and passing through the z axis,
| (11) |
| (12) |
| (13) |
| (14) |
| (15) |
| (16) |
g(λ,u,w) is the projection data, w = w̄ + k(u − ū) is nothing but a filtering line and can be obtained analytically as follows:
| (17) |
| (18) |
where ẑ = z − az(λ) and (0,0,z) is the intersection of z axis with filtering plane. represents Hilbert filtering. Thus, the reconstruction can be carried out in a filtration-back-projection style.
RESULTS
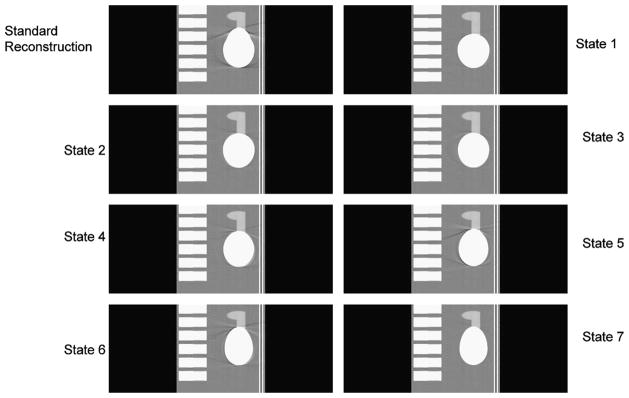
We used the thorax phantom24 with heart motion for our simulation. The images reconstructed in our simulation correspond to a region of interest of 50.0978 × 50.0978 × 19.8630 cm. To simulate the heart motion, we generated the volume curve using Eqs. (1) to (7). The parameters used to obtain the curve are specified in Table 1, with ti’s scaled by the cardiac period Tc = 0.7 second. The sphere representing the heart in the thorax phantom was divided into 2 parts to represent the ventricles and the auricles. The percentage of volume change for the ventricles was defined by (f(t) + 2)/3. The ventricles and the auricles were modeled to have an inverse relationship (ie, the volume of auricles decreases with the increase in the volume of ventricles). However, the percentage change in auricles is only one fourth of that of the ventricles. This may not be the best way to simulate complicated cardiac motion, but this is satisfactorily for our purpose in which we try to compare the standard reconstruction over 1 saddle trajectory rotation of the x-ray source against multiple states obtained using the knowledge-based technique.
We used virtual detector for our simulations. The detector size was 84 × 100 cm with 1050 × 1250 detector elements. The radius and the height used for the standard saddle were 75 and 19 cm, respectively. This geometry was defined to obtain a reconstruction FOV height of 10 cm. The number of views used was 1200. The perpendicular distance from the source to the detector was 75 cm. The x-ray source rotation period was Ts = 0.5 seconds that gave a value of b = 5/7, thus capable of reconstructing 7 states of heart or 14 phases.
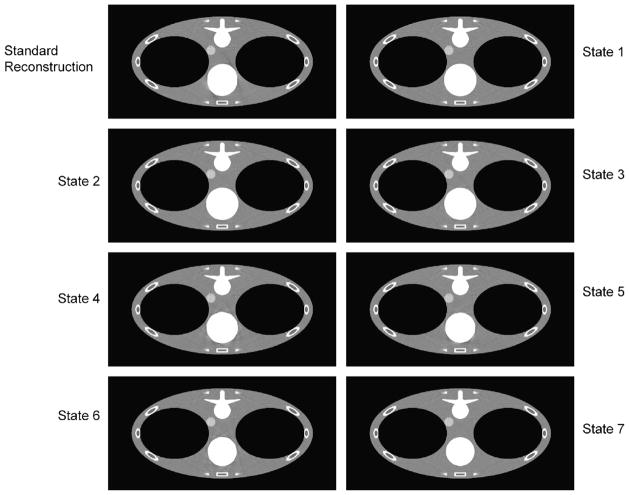
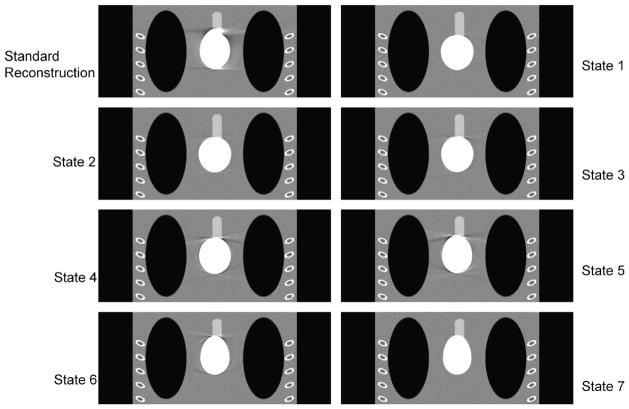
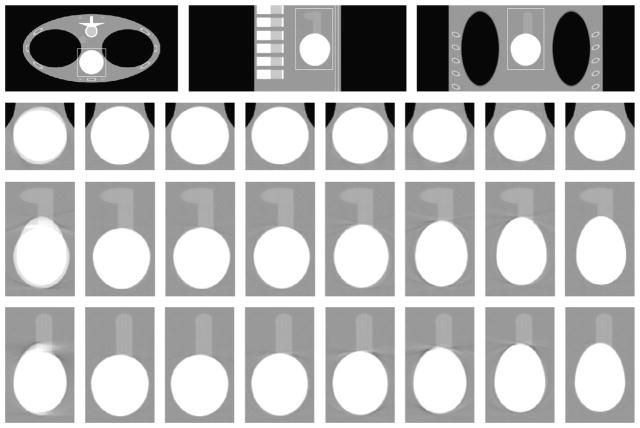
The reconstruction volume was 512 × 512 × 203, with a voxel size of 50/511 cm3. Portion of transverse slices 512 × 256 are presented in this paper to eliminate zero portion of the slices and enable simultaneous comparison. Figures 6 to 8 show the transverse, coronal, and sagittal sections, respectively, of the phantom images reconstructed using the view-independent exact reconstruction algorithm for the saddle curve trajectory. Figure 9 shows the exactly reconstructed images of the region around the heart in a broad window to illustrate the artifacts, especially blurring ones, not visible with the use of narrow window. It is obvious that the quality of images obtained using the knowledge-based reconstruction with saddle curve trajectory is significantly improved as compared with those obtained using standard reconstruction.
FIGURE 6.
Reconstructed images of different states for the transverse slices at z = 0 cm with a saddle curve geometry. As a baseline, the top left one is the standard reconstruction without using the knowledge-based technology, and the others are the 7 states of knowledge-based reconstruction. The display window is (0.9,1.1).
FIGURE 8.
Same as Figure 6 but for the coronal slices at x = −4.45 cm.
FIGURE 9.
Reconstructed dynamic heart in a wider window. First row shows the transverse, sagittal, and coronal slices at z = 0 cm, y = 0.245 cm, and x = −4.45 cm, respectively. Second, third, and fourth rows correspond to the zoomed versions of the region in the rectangle of the transverse, sagittal, and coronal slices, respectively. The columns in second, third, and fourth rows correspond to standard reconstruction, and states 1 through 7, respectively. The display window is (0.7, 1.3).
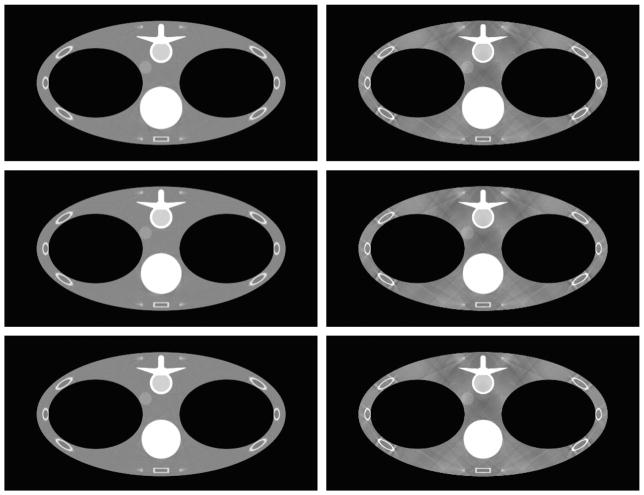
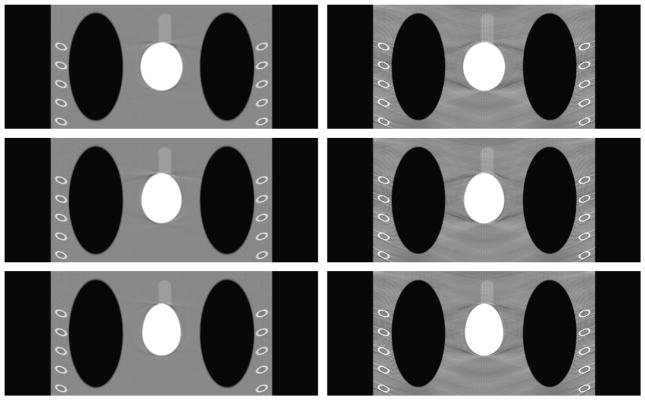
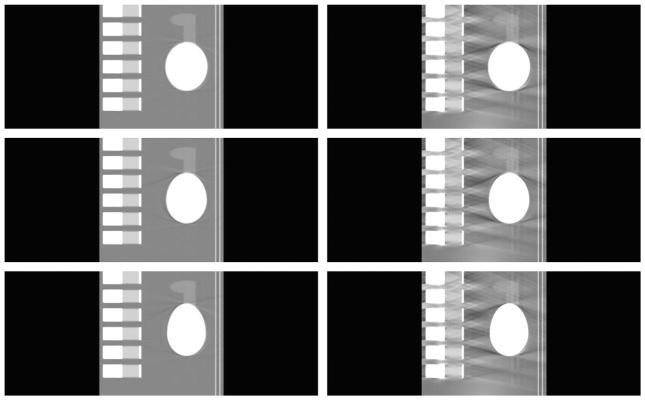
To demonstrate the merits of using exact reconstruction algorithm for the saddle curve, the reconstructed images are compared with those obtained using the approximate generalized Feldkamp in Figures 10 to 12. Only states 4, 5, and 6 are shown here to illustrate the point and keep the number of figures to a minimum. These states were chosen because they seemed to have more artifacts than other states in Figures 6 to 9. Again, a broader viewing window is used here because the artifacts in the images obtained using the approximate reconstruction algorithm make any desirable properties not viewable in a narrower window. From these reconstructions, it is very obvious that, even at a broader window, the images reconstructed using the exact reconstruction algorithm are far more superior to the images obtained from the approximate reconstruction algorithm. It is also apparent that generalized Feldkamp algorithm is unsuitable for reconstruction using saddle curve trajectories for larger pitches such as the one used in this case.
FIGURE 10.
Comparison for different reconstruction methods for the transverse slices at z = 0 cm. First and second columns correspond to the images reconstructed using view-independent reconstruction algorithm and generalized Feldkamp algorithm, respectively. Rows from top to bottom correspond to states 4, 5, and 6, respectively. The display window is (0.7,1.3).
FIGURE 12.
Same as Figure 10 but for the coronal slices at x = −4.45 cm.
DISCUSSION
In this paper, we have combined the knowledge-based dynamic cardiac CT technique with the acquisition over a saddle curve trajectory. Both of these are important techniques with significant potential to improve the image quality of cardiac CT. The knowledge was derived from the volume of the heart. We also illustrated the importance of exact reconstruction algorithm over approximate for use with saddle curve trajectories. As pointed out in the study by Wang et al,10 the best strategy could be a synergistic combination of dynamic cardiac anatomy, various measurements of anatomical/physiological signals, and abundant information from raw projection data.
We carried out our simulations under ideal periodic conditions. The real data may not be optimal. However, we should be able to overcome the irregularity if we use the cardiac motion maps. In worst cases, we may still be able to use feathering techniques to make the transition between data segments smooth. Faster scan speed available in today’s CT scanner combined with the knowledge-based reconstruction will likely reduce such discontinuities. Also, because the reconstruction is exact, these discontinuities may not be overemphasized. This approach successfully overcomes some issues pertaining to longitudinal data truncation. The images reconstructed with this method will not have common problems of the approximate reconstruction algorithms. We are limited in our ability to apply our methods to real data because the scanners based on saddle curve trajectory have not yet been developed.
In conclusion, we have combined the knowledge-based dynamic volumetric cardiac CT technique with saddle curve trajectory to improve cardiac imaging quality. This work, still not in its optimized form, already provides us with good image quality. Further optimization using combination of status signals may result in even better image quality. Application to real data can help understand the shortcomings and the improvisations possible in this approach.
FIGURE 7.
Same as Figure 6 but for the sagittal slices at y = 0.245 cm.
FIGURE 11.
Same as Figure 10 but for the sagittal slices at y = 0.245 cm.
Acknowledgments
The authors thank Dr Yuchuan Wei, Biomedical Imaging Division in the Biomedical Department at Wake Forest University School of Medicine, for helpful discussions. The authors also thank Dr Haiquan Yang, Research and Development Department of Uni-Hite System Corporation, Japan, and Kai Zeng, Graduate student at University of Iowa, for help with implementation of view-independent reconstruction algorithm.
This study was partially supported by National Institutes of Health/National Institute of Biomedical Imaging and Bioengineering grants (EB002667 and EB004287).
References
- 1.Rosamond W, Flegal K, Friday G, et al. Heart disease and stroke statistics—2007 update—a report from the American Heart Association Statistics Committee and Stroke Statistics Subcommittee. Circulation. 2007;115:E69–E171. doi: 10.1161/CIRCULATIONAHA.106.179918. [DOI] [PubMed] [Google Scholar]
- 2.Flohr TG, Schoepf UJ, Kuettner A, et al. Advances in cardiac imaging with 16-section CT systems. Acad Radiol. 2003;10:386–401. doi: 10.1016/s1076-6332(03)80027-2. [DOI] [PubMed] [Google Scholar]
- 3.Budoff MJ, Achenbach S, Blumenthal RS, et al. Assessment of coronary artery disease by cardiac computed tomography: a scientific statement from the American Heart Association Committee on Cardiovascular Imaging and Intervention, Council on Cardiovascular Radiology and Intervention, and Committee on Cardiac Imaging, Council on Clinical Cardiology. Circulation. 2006;114:1761–1791. doi: 10.1161/CIRCULATIONAHA.106.178458. [DOI] [PubMed] [Google Scholar]
- 4.Hu H. Multi-slice helical CT: scan and reconstruction. Med Phys. 1999;26:5–18. doi: 10.1118/1.598470. [DOI] [PubMed] [Google Scholar]
- 5.Ohnesorge B, Flohr T, Becker C, et al. Cardiac imaging by means of electrocardiographically gated multisection spiral CT: initial experience. Radiology. 2000;217:564–571. doi: 10.1148/radiology.217.2.r00nv30564. [DOI] [PubMed] [Google Scholar]
- 6.Ritchie CJ, Godwin JD, Crawford CR, et al. Minimum scan speeds for suppression of motion artifacts in CT. Radiology. 1992;185:37–42. doi: 10.1148/radiology.185.1.1523332. [DOI] [PubMed] [Google Scholar]
- 7.Marten K, Funke M, Rummeny EJ, et al. Electrocardiographic assistance in multidetector CT of thoracic disorders. Clin Radiol. 2005;60:8–21. doi: 10.1016/j.crad.2004.03.025. [DOI] [PubMed] [Google Scholar]
- 8.Hong C, Becker CR, Huber A, et al. ECG-gated reconstructed multi-detector row CT coronary angiography: effect of varying trigger delay on image quality. Radiology. 2001;220:712–717. doi: 10.1148/radiol.2203010055. [DOI] [PubMed] [Google Scholar]
- 9.Bai E, Wang C, Liu Y, et al. Controlled cardiac computed tomography. Int J Biomed Imaging. 2006 doi: 10.1155/IJBI/2006/12819. Article ID 12819, 11 pages. [DOI] [PMC free article] [PubMed] [Google Scholar]
- 10.Wang G, Zhao S, Heuscher D. A knowledge-based cone-beam x-ray CT algorithm for dynamic volumetric cardiac imaging. Med Phys. 2002;29:1807–1822. doi: 10.1118/1.1494989. [DOI] [PubMed] [Google Scholar]
- 11.Wang G, Lin TH, Cheng P, et al. A general cone-beam reconstruction algorithm. IEEE Trans Med Imaging. 1993;12:486–496. doi: 10.1109/42.241876. [DOI] [PubMed] [Google Scholar]
- 12.Feldkamp LA, Davis LC, Kress JW. Practical cone-beam algorithm. J Opt Soc Am A Opt Image Sci Vis. 1984;1:612–619. [Google Scholar]
- 13.Katsevich A. Theoretically exact filtered backprojection-type inversion algorithm for spiral CT. SIAM J Appl Math. 2002;62:2012–2026. [Google Scholar]
- 14.Pack JD, Noo F, Kudo H. Investigation of saddle trajectories for cardiac CT imaging in cone-beam geometry. Phys Med Biol. 2004;49:2317–2336. doi: 10.1088/0031-9155/49/11/014. [DOI] [PubMed] [Google Scholar]
- 15.Yu H, Zhao S, Ye Y, et al. Exact BPF and FBP algorithms for nonstandard saddle curves. Med Phys. 2005;32:3305–3312. doi: 10.1118/1.2074207. [DOI] [PubMed] [Google Scholar]
- 16.Tuy HK. An inversion formula for cone-beam reconstruction. SIAM J Appl Math. 1983;43:546–552. [Google Scholar]
- 17.Katsevich A. A general scheme for constructing inversion algorithms for cone beam CT. Int J Math Math Sci. 2007;21:1305–1321. [Google Scholar]
- 18.Ye Y, Wang G. Filtered backprojection formula for exact image reconstruction from cone-beam data along a general scanning curve. Med Phys. 2005;32:42–48. doi: 10.1118/1.1828673. [DOI] [PubMed] [Google Scholar]
- 19.Ye Y, Zhao S, Yu HY, et al. A general exact reconstruction for cone-beam CT via backprojection-filtration. IEEE Trans Med Imaging. 2005;24:1190–1198. doi: 10.1109/TMI.2005.853626. [DOI] [PubMed] [Google Scholar]
- 20.Ye Y, Zhao S, Yu H, et al. Exact reconstruction for cone-beam scanning along nonstandard spirals and other curves. Developments in X-Ray Tomography IV. Proceedings of SPIE—The International Society for Optical Engineering; August 4–6, 2004; Denver, CO: International Society for Optical Engineering, Bellingham, WA; pp. 293–300. [Google Scholar]
- 21.Pack JD, Noo F, Clackdoyle R. Cone-beam reconstruction using the backprojection of locally filtered projections. IEEE Trans Med Imaging. 2005;24:70–85. doi: 10.1109/tmi.2004.837794. [DOI] [PubMed] [Google Scholar]
- 22.Yang HQ, Li MH, Koizumi K, et al. Exact cone beam reconstruction for a saddle trajectory. Phys Med Biol. 2006;51:1157–1172. doi: 10.1088/0031-9155/51/5/008. [DOI] [PubMed] [Google Scholar]
- 23.Yang HQ, Li MH, Koizumi K, et al. View-independent reconstruction algorithms for cone beam CT with general saddle trajectory. Phys Med Biol. 2006;51:3865–3884. doi: 10.1088/0031-9155/51/15/018. [DOI] [PubMed] [Google Scholar]
- 24.Sourbelle K. [Accessed March 19, 2007.];Thorax Phantom. Available at: http://www.imp.uni-erlangen.de/phantoms/thorax/thorax.htm.


