

Abstract
The two NDR kinase family genes in Drosophila are tricornered (trc) and warts (wts). Previous studies on trc have focused on its role in the morphogenesis of extensions of epidermal cells and in dendrite branching and tiling. Studies on wts have focused on its roles as a tumor suppressor, in controlling photoreceptor type and in the maintenance of dendrites. Here we examine and compare the function of these genes in wing cells prior to their terminal differentiation. Mutations in these genes lead to changes in cell shape, cellular levels of F-actin, the timing of differentiation, and the expression of multiple wing hairs and DE-Cadherin. We showed that the effects of wts on all of these processes appear to be mediated by its regulation of the Yorkie transcription factor. We also provide evidence that trc regulates the expression of DE-cadherin and mwh. In addition, we showed that the effects on cell shape and the timing of differentiation appear to not be linked to changes in relative growth rate of cells compared to their neighbors.
Keywords: NDR, trc, fry, wts, mats, yorkie, Mwh, DE-Cadherin, cell shape, wing hair differentiation
Introduction
In animals there are two subfamilies of NDR kinases. In Drosophila these are encoded by the tricornered (trc) and warts (wts, also known as lats-large tumor suppressor) genes. These genes are thought to have largely separate functions but several intriguing connections have been uncovered. Mutations in trc lead to alterations in sensory neuron dendrite tiling and branching, to epidermal cells forming multiplied and branched hairs and arista laterals and to branched and deformed sensory bristles (Emoto et al., 2004; Geng et al., 2000). In these cell types Trc function is dependent on the presence of the large Fry protein and a member of the Mob (Mps One Binder) family (Cong et al., 2001; Emoto et al., 2004; He et al., 2005a; He et al., 2005b; Luca and Winey, 1998). These functions are conserved in organisms from yeast to flies (Bidlingmaier et al., 2001; Colman-Lerner et al., 2001; Du and Novick, 2002; Emoto et al., 2004; Nelson et al., 2003; Racki et al., 2000; Verde et al., 1998; Waldemar J. Racki, 2000; Weiss et al., 2002; Zallen et al., 2000). For example, the Trc and Fry homologs in Caenorhabditis elegans, Sax-1 and Sax-2, regulate mechanosensory dendrite tiling by controlling the termination point of sensory dendrites (Gallegos and Bargmann, 2004; Zallen et al., 2000). In Saccharomyces cerevisiae, mutations in CBK1 (trc homolog), TAO3 (fry homolog) and MOB2 impair the polarized growth of buds and later lead to a failure of daughter-cell specific transcription. In mammals there are two Trc-like NDR kinases. These have not yet been shown to regulate polarized growth, but interestingly NDR1 has been shown to be important in centriole duplication (Hergovich et al., 2007) and in spindle function in cell division (Chiba et al., 2009). The downstream targets of Trc-like NDR kinases that regulate polarized growth and the levels at which they act remain unclear.
The Wts kinase also requires a Mob family protein partner for its function, which in Drosophila is the Mats protein (He et al., 2005a; Lai et al., 2005). Wts kinase and Mats are part of the Hippo pathway that regulates cell proliferation (Emoto et al., 2006; Justice et al., 1995; Wei et al., 2007). In Drosophila melanogaster, Wts is downstream of and activated by phosphorylation by the Hippo (Hpo) kinase (Emoto et al., 2006). In both mammals and flies these genes act as tumor suppressors and loss of function mutations lead to tissue overgrowth. In addition, wts mutations lead to a failure of sensory neurons to maintain the normal pattern of dendritic branching and a failure in the specification of R8 photoreceptor subtypes (Mikeladze-Dvali et al., 2005). Wts is believed to function by phosphorylating Yorkie (Yki), leading to its translocation from the nucleus to the cytoplasm (Dong et al., 2007). In the nucleus Yki associates with Scalloped (SD) and functions as a co-activator (Wu et al., 2008; Zhang et al., 2008). Active Yki leads to increased expression of cyclin E and the anti-apoptosis gene DIAP1 (Drosophila inhibitor of apoptosis 1) and such changes in gene expression are thought to be responsible for the overgrowth of clones of hpo, wts or mats loss of function mutations and to the overgrowth of clones that over express Yki (Wu et al., 2008; Zhang et al., 2008). Interestingly, Yki also promotes the expression of expanded (ex), which functions upstream of and activates the Hpo pathway (Hamaratoglu et al., 2006; Wu et al., 2008). Hence there is a negative feedback built into the system that functions to maintain constant pathway activity.
Although there are clear differences between the Trc and Wts pathways, they are also connected in several ways. One connection is that Hpo acts upstream of both Wts and Trc in da neurons. The role of Hpo in activating Wts is better known but it has also been established that Hpo can phosphorylate and activate Trc and genetic experiments demonstrated this was functionally important in da sensory neurons (Emoto et al., 2006). A second connection is that both trc and wts mutant cells have elevated levels of F-actin (He et al., 2005a). However, we previously noted that there were several phenotypes of trc or fry mutant cells in the wing epithelial that were the inverse of the phenotypes of wts or mats cells (He et al., 2005a; He et al., 2005b). For example, trc or fry mutant cells had an increased cross sectional area while wts or mats mutant cells had a decreased cross sectional area. In this paper we expanded on those findings and found that hpo loss of function clones and yki over expression clones shared this wts and mats mutant phenotype in wing epithelial cells. That yki over expression mimicked the wts phenotype implied that changes in gene expression were responsible for the changes in cell shape. We further extended these observations by obtaining and analyzing optical stacks of images of mutant clones. We found that the height of wts and mats mutant cells was increased and this compensated for the decreased cross sectional area so that there was no significant change in cell volume compared to wild type. In contrast, trc and fry mutant cells did not have altered cell height and thus that they showed an increase in cell volume.
How cell dimensions are controlled is poorly understood. One suggestion is that the height of epithelial cells is modulated by the balance between intercellular adhesion versus cell-matrix adhesion (Montell, 2008). Cadherins are central to intercellular adhesion. As a test of whether or not the increased cell height found in wts and mats clones was associated with increased intercellular adhesion, we examined DE-Cadherin levels in mutant clones. As might be predicted by the adhesion balance model we found increased levels of DE-Cadherin in wts or mats mutant cells. However, we also observed increased DE-Cadherin in trc and fry mutant cells whose cell height was unchanged. Further, we did not see an increase in cell height in cells where ptc-Gal4 was used to drive higher than normal levels of DE-Cadherin. Our data suggested that alterations in DE-Cadherin levels were insufficient to explain changes in cell height. Increased DE-Cadherin levels could be due to many different mechanisms. We found that mutations in both wts and trc lead to increased expression of B-galactosidase from an enhancer trap insertion into the shotgun (shg) gene (shg encodes DE-Cadherin in flies) establishing that at least in part the increase in DE-Cadherin is mediated at the transcriptional level.
Hair morphogenesis is part of the terminal differentiation program for wing epidermal cells. We previously found that trc (and fry) and wts (and mats) mutations resulted in opposite phenotypes on the timing of hair initiation. trc and fry mutant cells are delayed in hair initiation while wts and mats mutant cells differentiate precociously (He et al., 2005a). Thus, in this context one wild type function of wts appears to be to inhibit the terminal differentiation of wing cells. This is unusual for a tumor suppressor gene. We extended our previous results and found that loss of hippo function and yki over expression also shared the precocious differentiation phenotype of wts and mats mutant cells. Interestingly, yki loss of function clones showed delayed hair initiation and yki was epistatic to wts. The expression of the mwh gene increases around the time of hair initiation and this is a functionally important part of the hair morphogenesis program (Yan et al., 2008). We found that yki over expression could lead to increased mwh expression, but this was seen only around the time of hair morphogenesis, suggesting that yki over expression led to the premature initiation of the hair gene expression program. We also found that loss of trc and fry function led to decreased mwh expression at the time of hair initiation. This was consistent with the hypothesis that the mutations resulted in a delay in the hair gene expression program. The decreased mwh expression in trc cells was insufficient to explain their strong multiple hair phenotype as genetic experiments showed these genes functioned in parallel to control hair number.
Materials and Methods
Fly stocks and crosses
To induce wts or mats somatic clones we crossed w hs-flp; FRT82 wtsP3/TM6 or w hs-flp; FRT82 matse03077/TM6 flies with w hs-flp; FRT82 Ubi-GFP/FRT82 Ubi-GFP flies. The larvae were heat shocked on the 3rd day after egg-laying.
To induce trc or fry clones, we crossed w hs-flp; FRT80 trcp/TM6 or w hs-flp; FRT80 fryT2K61/TM6 with w hs-flp vg-Gal4; FRT80 Ubi-GFP/FRT80 Ubi-GFP flies.
To induce MINUTE clones, we crossed w hs-flp; FRT82 RpS174 Ubi-GFP/TM6 with w hs-flp; FRT82/FRT82. The larvae were heat shocked on the 5th day after egg-laying to induce clones.
To induce trc-wts double mutant cells, we crossed w hs-flp; ptc-Gal4 UAS-MCD8-GFP; FRT 82 wtsP3/TM6 with w hs-flp; UAS-trcS292A T453A; FRT82 tub-gal80ts flies and heat-shocked the larvae on the 3rd day after egg-laying to induce clones and then shifted the pupae to 29°C to inactivate the temperature sensitive Gal80 protein and to activate Gal4 driven expression of the dominant negative Trc protein.
To induce hippo clones, we crossed w hs-flp; FRT42Ubi-GFP with FRT42D hippo4247/CyO and heat shocked the larvae on the 3rd day after egg-laying.
To induce yorkie clones, we crossed w hs-flp; FRT42D Ubi-GFP with FRT42D ykiB5/CyO and heat shocked the larvae on the 2nd day after egg-laying. To induce cells that over-expressed wild type Yorkie, we crossed w hs-flp; Ay-Gal4 UAS-GFP with UAS-Yki/TM6. Larvae were heat shocked for half an hour on the 4th day after egg-laying or for one hour on the 5th day after egg-laying.
To induce wts yki double mutant clones we crossed w hs-flp; ykiB5/CyO; FRT82 wtsP3/TM6 females and w hs-flp; ykiB5/Gla; FRT82 ubi-GFP P{tub-yki}/TM6 males. The P{tub-yki} transgene is a full-length yki cDNA driven by the ubiquitous α-tubulin promoter and this provides rescue of the mutation in the endogenous gene (Huang et al., 2005). The Gla chromosome contained the Bc marker, which allowed us to exclude that genotype. Flies that carried the CyO chromosome contained a wild type yki gene and they produced typical wts “tumor clones”. The larvae were heat shocked on the 3rd day after egg-laying.
To induce mwh clones, we crossed w hs-flp; FRT80 mwh with vg-Gal4 UAS-FLP; FRT80 Ubi-GFP. To induce ultA mutant clones, we crossed w hs-flp; FRT40 ultA/CyO, with w hs-flp; FRT40 Ubi-GFP flies. The larvae were heat shocked on the 3rd day after egg-laying.
To induce cells that over-expressed wild type DE-Cadherin, we crossed UAS-DE-Cadherin with ptc-Gal4 (this resulted in flies that expressed DE-Cadherin in the patched domain) or Ay-Gal4 UAS-GFP flies (which then induced GFP marked flip-out clones). For the cross involving Ay-Gal4 the larvae were heat shocked for half an hour on the 4th day after egg-laying or for one hour on the 5th day after egg-laying.
To induce mwh trc or mwh fry double mutant clones, we crossed w hs-flp; FRT80 mwh1 trc1/TM6C, or w hs-flp; FRT80 mwh1 fry1/TM6 with UAS-flp vg-Gal4; FRT80 Ubi-GFP flies. The larvae were heat shocked on the 3rd day after egg-laying.
FRT42 hpo42/CyO, FRT42 ykiB5/CyO and UAS-Yki/TM3 flies were generously provided by the Pan Lab at John Hopkins University. thj5c8 (diap1-lacZ)/[TM3, Sb], CycE[16.4kb]-lacZ/cycE[16.4kb]-lacZ and FRT40A exe1/CyO flies were generously provided by Halder lab at University of Texas, M.D. Anderson Cancer Center. y1 w67c23; P {lacW} shgk0340 1/CyO stock (#10377) and flies with Ubi-GFP and FRT containing chromosomes were obtained from the Bloomington Stock Center. Other mutation or transgenes containing stocks were either isolated in our lab and described previously (He et al., 2005a). The fry dsRNA fly stock (#40309) is from the Vienna Drosophila RNAi Center (VDRC).
In the experiments reported in this paper we chose to focus on single phenotypic null alleles. However, for trc, fry, wts and mats we have seen equivalent phenotypes with multiple alleles. Similar observations were also made in experiments where we used a transgene to induce RNAi for trc and fry.
Immunohistochemistry
Phalloidin-staining
White pre-pupae were collected and aged for the desired time and then pupae were pulled out from the pupal cuticle and fixed in 4% paraformaldehyde overnight. Pupal wings were cut off the body and pulled out from the wing cuticle. After being incubated in 1:200 Phalloidin/0.3%PBST (Phosphate Buffered Saline with Triton-100) solution for 2~3 hours, the wing was washed with 0.3%PBST solution three times (10 minutes each), and then rinsed in PBS solution, and finally mounted in ProLong Gold fluorescence mounting medium (Molecular Probes). Samples were then observed under confocal-fluorescent microscopy.
Immunostaining
White pre-pupae were collected and aged for the desired time, and then pupae were pulled out from the pupal cuticle and fixed in 4% paraformaldehyde for 2~3 hours. Pupal wings were cut off the body and pulled out from the wing cuticle. After being incubated in appropriate dilutions of primary antibody (varies with different antibodies) in 0.3%PBST (PBS plus 0.3% triton X100) solution over night, the wings were washed with 0.3%PBST solution three times (15 minutes each), and then incubated in 1:200 secondary antibody/0.3%PBST solution for 2~3 hours. Then the wings were washed with 0.3%PBST solution three times (10 minutes each), then rinsed in PBS solution, and finally mounted in ProLong Gold fluorescence mounting medium. Samples were then observed under confocal fluorescent microscopy.
Antibodies
Anti-C-Fry antibody was raised in rabbits against a C-terminal peptide of Fry (He et al., 2005b). Anti-Mwh antibody was raised against a partial Mwh-GST fusion protein in rat at Spring Valley Laboratories, Inc. This antibody has been described previously (Yan et al., 2008). Anti-Trc antibody was raised in Rats at Spring Valley Laboratories, Inc. using purified Trc-GST protein (He et al., 2005b). Rabbit anti-GFP, Alexa phalloidin 488 and 568, anti-rabbit-488, anti-mouse 568 and anti-rat-568 antibodies were obtained from Invitrogen. Mouse anti-DE-Cadherin was obtained from Developmental Studies Hybridoma Bank (DSHB) at University of Iowa. Rabbit-anti-lacZ was obtained from ICN Biomedicals, Inc.
Scoring of Adult Wings
Wings were mounted in Euparal (Asco Labs, Manchester, England) and examined under bright-field microscopy.
Microscopy and Photography
A Spot digital camera (National Diagnostics, Manville, NJ) on a Zeiss Axioskop microscope (Thornwood, NY) was used to obtain the bright field images. For most experiments the samples were examined using an Atto spinning disc confocal attachment on a Nikon microscope. The MetaMorph software (Molecular Device, MDS Inc.) was used to take the individual images and Z-stacks. The Image J software (Wayne Rasband, National Institutes of Health, U.S.A.) was used to analyze F-actin levels (phalloidin staining), β-galactosidase and DE-Cadherin staining intensity, cell cross-sectional area and cell length. For all of these experiments we compared mutant cells with neighboring wild type cells. This was important as some cellular parameters vary as a function of position across the wing (e.g. cross sectional area). Statistical analysis of the data was done in Microsoft Excel (Microsoft) and/or Sigma Stat (SPSS).
In some of the experiments where we quantitatively analyzed confocal images we used the raw data and did not correct for background (e.g. non-specific staining, camera background). This approach underestimates the true change in staining when comparing mutant and wild type cells, but it was not always possible to get a “background” measurement that we were confident of (Waters, 2009; Wolf et al., 2007). In other experiments we made such corrections by subtracting from the signal the background staining as measured from a cellular region where we did not expect any signal (Waters, 2009). For example, in the β-galactosidase immunostaining measurements we used the staining intensity in the cytoplasm as a measure of background as in these experiments the β-galactosidase contained a nuclear localization signal (see Supplementary Fig. S1). When a correction was made for background it is noted in the text. A similar procedure was used to correct for background in experiments where we measured DE-cadherin levels. In this case we measured staining in the center of cells (not near the plasma membrane) to assess background. In general we did not correct for background when we compared levels of F-actin due to the difficulty in deciding how to measure background. The F-actin measurements were made on single optical sections from the level of the adherens junction. To measure central F-actin we drew a circle in the middle of the cell and measured mean F-actin levels. To measure peripheral F-actin we drew a line across the border between two mutant (or wild type cells) and measured the maximum fluorescence intensity.
Lat A test for F-actin depolymerization
The procedure followed has been described previously (Ren et al., 2007). Briefly, clone bearing pupal wings were dissected and incubated for various lengths of time at 25°C in Schneider’s medium containing 50μM Latrunculin A (Sigma). The wings were then fixed and stained with Phalloidin and then images of clones obtained by confocal microscopy. The intensity of staining was quantified using Image J.
Results
Trc/Fry regulate cell shape differently than Wts/Mats
In wild type wing cells, hair initiation normally starts around 32 hours after white pupae formation (APF). Early studies on trc and fry described their strong multiple wing hair cell phenotypes (Cong et al., 2001; Geng et al., 2000) (Fig. 1A). Adult wing cells mutant for wts (Fig. 1B) or mats (data not shown) typically showed a bulged apical surface and sometimes a multiple hair cell type (He et al., 2005a), albeit one that is weaker than trc or fry mutant phenotype. We previously noted that cells mutant for trc, fry, wts and mats showed two phenotypes prior to hair formation (He et al., 2005b). Cells mutant for any of these genes showed increased level of F-actin (Fig. 2A–F, S–X and data not shown), and the cross sectional area of trc and fry mutant cells was increased in contrast to the decreased cross sectional area of wts and mats mutant cells (Fig. 3).
Fig. 1.

Wing hair phenotypes of trc, wts, UAS-yki over expression, wts trc double mutant and mwh trc double mutant cells. Panel A showed a trc1 clone in an adult wing. Notice the strong multiple hair cell phenotype (arrow points to multiple hairs, arrow head points to wild type hair). Panel B showed a small wtsP3 clone in an adult wing. Notice the outlines of bulged cells (arrow). Panel C showed a small group of trcS292A T453A wtsP3 double mutant cells (genotype: w hs-flp; UAS-trcS292A T453A/ptc-Gal4 UAS-MCD8-GFP; FRT 82 wtsP3/FRT82 tub-gal80). Note the bulged out region and the extreme multiple hair cell phenotype (arrow) inside patched domain. wts single mutant clones outside the ptc domain showed the wts bulged cell/tumor phenotype (arrowheads). Panels D–F showed three actinGal4 UAS-yki flip out clones. Panel D showed the multiple hair cell phenotype of a small clone which was induced in the pupal stage. Arrow points to multiple hair cells. Panel E showed a clone, which was induced earlier that contained bulged cells (arrowhead) but no multiple-hair cells. Panel F showed a clone that displays both bulging (arrowhead) and a strong multiple hair cell phenotype (arrow). Panels G–I showed a mwh trc1 double mutant clone in a pupal wing marked by the loss of GFP. The pupal wing is also stained with Alexa 568 phalloidin to showed hairs (in red). Panel G showed F-actin alone, panel H GFP alone and panel I the merge. Arrows point to cells with extreme multiple hair cell phenotype, and arrowheads to single hairs of wild type cells. The asterisk marks the clone region that lacks GFP. Scale bar is 10 μm.
Fig. 2.

trc, fry, wts, mats and yki regulate cell shape and intracellular F-actin level. Panels showed clones marked by the loss or gain of GFP (green) and stained with phalloidin (red) to showed the distribution of F-actin. In each case, red, green and merged images are shown. Panels A–C showed a fryT2K61 clone (marked by an asterisk). Note the mutant cells have increased F-actin and larger cross section comparing to wild type neighbors (as judged by peripheral F-actin staining). Panels D–F showed a matse03077 clone (asterisk). Note the clone cells have a smaller cross section comparing to wild type cells and stain more intensely for F-actin. Panels G–I showed a Gal4 flip out clone that over-expressed Yki from a UAS-yki transgene. The clone is marked by the expression of GFP. Note the GFP expressing cells have a smaller cross section and increased F-actin. Panels J–L showed a Minute+/− clone marked by the expression of GFP surrounded by Minute+/+ cells that don’t express GFP. Panels M–O showed a ykiB5 clone (marked by loss of GFP). Panels P–R showed a wtsP3 ykiB5 double mutant clone (marked by loss of GFP). Panels S–U showed Z axis reconstructions through a fryT2K61 clone (marked by loss of GFP). There is bright F-actin staining at the apical (asterisk) and basal (double asterisks) levels of the mutant cells. The wing is composed of two simple epithelial cell layers with their basal surfaces juxtaposed. Panels V–X showed the Z axis reconstruction through a matse03077 clone. Note the clone cells on the distal surface are taller (asterisk) and this results in the compression and shortening of the juxtaposed ventral non-clone cells (double asterisks). Note also the increased F-actin staining in the clone cells. Panels Y-a showed a Z axis reconstruction a UAS-yki flip out clone. Note the clone cells are taller. Panels b–d showed a Minute+/− clone. Note there is no change in cell height. Scale bar in all panels is 10 μm.
Fig. 3.

Summary of the cell shape and F-actin level analysis of trc, fry, wts, mats and Minute mutant cells. Bars showed the mean ratios for the 5 measured parameters. The ratios were obtained from measurement of mutant to neighboring wild type cells. Error bars showed the standard error of the mean. Samples where the mutant and wild type means were significant with a p<0.01 are identified by an asterisk, samples where the p<0.0002 are identified with double asterisks. T-tests were used to compare the values from mutant and wild type cells. Data for each column were collected from eight individual wings. Cell cross-section area, ~400 cells observed/column (n=8) cell length, 3200 cells observed/column (half wild type and half mutant, n=1600); cell volume, 16 clones analyzed (by multiplying average cell cross-section area by average cell height in each clone)/colum (n=8); actin periphery, 240 cells observed/column (n=120); actin central 240 cells observed/column (n=120).
Altered cross sectional area could reflect a change in cell volume and/or a change in cell shape. To distinguish between these possibilities, we obtained Z-stacks of clones by confocal microscopy. Reconstructions and Z projections were then derived. This allowed us to measure the height of mutant and neighboring wild type cells as well as cross sectional area. We found that fry (Fig. 2A–C, S–U, Fig. 3) and trc (Fig. 3 and data not shown) mutant cells had significantly larger cross sections, but there was no change in cell height. Thus, trc and fry mutations led to increased cell volume (Fig. 3). In contrast, mats (Fig. 2D–F, V–X) and wts (data not shown) mutant cells had significantly smaller cross sectional area but this was balanced by increased height so there was no difference in cell volume (Fig. 3).
Cells that lack Wts function are expected to have increased nuclear Yki and this is thought to be the cause of the wts tumor phenotype. We examined clones of cells that over-expressed Yki (generated by the flip out technique) (Huang et al., 2005). They shared the smaller cross sectional area and greater height of wts and mats mutant cells (Fig. 2G–I, Y-a). This suggested that the cell shape changes associated with wts and mats were mediated by alterations in the transcription of one or more Yki target genes in wing cells. As a complement to the yki over expression clones we also induced and examined both yki loss of function clones and wts yki double mutant clones. These failed to proliferate extensively, but we were able to recover small clones. These did not show an obvious change in cell shape (Fig. 2M–R). Similar observations Casual observations of hippo mutant clones suggested that they behaved similarly to wts and mats mutant cells although quantitative data was not obtained (Fig. S2).
Could the smaller cross section and greater height of the wts and mats mutant cells be a secondary consequence of their growing more rapidly than neighboring cells? To assess the relative growth of mutant and wild type cells we compared the number of cells in clones versus their neighboring twin spots. We found, as expected, that wts or mats mutant cells grew faster than the neighboring wild type cells (Fig. S3) and out-competed them. As a test of the hypothesis that the different relative growth rates were responsible for the changed cell shape, we examined the phenotype of Minute+/− mutant cells that were juxtaposed to clones of Minute+/+ wild type cells. Minute cells grow more slowly than their wild type neighbors (Kongsuwan et al., 1985). Notably, we did not see any difference in cross sectional area or height between Minute+/− and Minute+/+ cells (Fig. 2J–L, b–d, Fig. 3). We also examined trc or fry mutant cells for effects on cell proliferation. We found those cells also grew more rapidly than their wild type twins (Fig. S3). However, in contrast to wts and mats clones trc and fry clones never came close to taking over an entire compartment. Perhaps the increased growth rate of trc and fry clones was transient or there was increased cell death in large clones. We concluded that the juxtaposition of cells with different cell division rates per se was unlikely to be the cause of the changes in cell shape/volume seen with trc, fry, wts or mats mutant cells.
trc, fry, wts and mats mutant cells all show increased levels of F-actin
In contrast to the opposite effects of trc/fry and wts/mats on cell shape, we found that cells mutant for each of these genes showed increased levels of F-actin (as assayed by Phalloidin staining, Fig. 2A–F, and data not shown). Compared to wild type cells significant increases were seen in the amount of F-actin at the cell periphery and in non-peripheral cytoplasm (Fig. 3). Once again we used Minute+/− cells as a control. We detected a small but significant increase in peripheral but not central F-actin levels between Minute+/− and wild type neighbors (Fig. 3). Thus, we concluded that relative growth rate could not explain the large differences seen in the levels of F-actin. We also observed increased F-actin in cells that over-expressed yki (Fig. 2G–I) and in clone cells that lacked hpo function (data not shown). We did not see any consistent change in F-actin in yki loss of function clones (Fig. 2M–O) or in wts yki double mutant cells (Fig. 2P–R).
The level of F-actin in cells is a result of the balance between polymerization and depolymerization. A mutation can result in increased F-actin due to increased filament stability (i.e. decreased rate of depolymerization) and/or increased polymerization of G-actin. An assay to distinguish between these two possibilities was developed in yeast (Okada et al., 2006). It was based on the ability of Latrunculin A (Lat-A) to block actin polymerization without affecting actin depolymerization. The rate at which F-actin disappeared in the presence of Lat-A was a measure of the relative rate of actin depolymerization and this could be compared for mutant and wild type cells. We previously adapted this assay for use in studying the effects of mutations on actin dynamics in pupal wing cells. This entailed incubating pupal wings that had marked clones in medium containing Lat-A for various lengths of time followed by fixation and staining with Phalloidin (Ren et al., 2007). Using this approach we found that the large increase in F-actin seen in cells mutant for flare (which encodes the fly AIP1) was due to an increase in F-actin stability. This made good sense as it is known from a variety of experiments that AIP1 interacts with cofilin to promote actin depolymerization (Ono, 2003). These experiments also showed the actin cytoskeleton was highly dynamic in pupal wing cells as F-actin levels fell more than 2 fold in wild type cells incubated for 18 minutes in Lat-A medium. We carried out this assay on wings bearing wts clones and found the rate of loss of F-actin staining was similar for both neighboring wild type and wts mutant cells (Fig. 4). This argued that the mutations did not alter F-actin depolymerization, and by elimination it suggested that the increased F-actin in the wts mutant cells was a consequence of increased actin polymerization. Attempts to carry out a similar experiment on trc were not successful as in vitro culture per se appeared to reduce the increased F-actin seen in mutant cells to close to wild type levels.
Fig. 4.
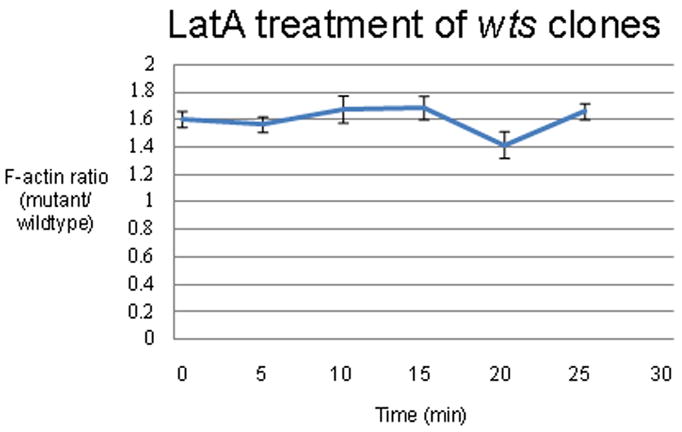
Ratio of F-actin staining as a function of time of incubation in LatA.
The ratio of F-actin staining of wtsP3 mutant clones to neighboring wild type cells as a function of time of incubation in Lat A. The error bars showed the standard error of the mean. The T-test P value of mutant-wild type cell comparison is <0.005 for all time points.
The distribution of tubulin is not dramatically changed in wts and fry clones
Fry has been found to bind to microtubules and to be required for the alignment of chromosomes on the mitotic spindle. We therefore examined the distribution of tubulin and acylated tubulin in wild type and fry and wts mutant pupal wing cells. We did not observe any change in tubulin or acylated tubulin prior to wing hair initiation (Fig. S4). The distribution in cells that contained growing hairs was affected to the extent that hair morphology was altered (data not shown).
DE-Cadherin was upregulated in trc, fr, wts and mats mutant cells
Relatively little is known about the mechanisms that regulate the height of epithelial cells, although there are suggestions that cell adhesion may play a role (Montell, 2008). Two types of experiments were done to determine if changes in cell adhesion could be responsible for the altered cell height and cross section seen in wts (and mats) and trc (and fry) mutant cells. In the first we examined the level of DE-Cadherin in wts, mats, trc and fry mutant cells. Interestingly DE-Cadherin levels increased in all of the four kinds of mutant cells (Fig. 5A–F and data not shown (fry and mats)). Since increased DE-Cadherin levels were observed in mutant cells that had opposite changes in cell shape, we concluded that the increased DE-Cadherin was unlikely to be the cause of the cell shape changes. We quantified DE-Cadherin levels for both trc and wts mutant clones and found the increases significant (Table 1A). After correcting for background staining (see Methods) we observed a 3.6 fold increase in wts mutant cells and a 2.5 fold increase in trc mutant cells. The greatest increase was seen at cell borders between two mutant cells with an intermediate value at borders between wild type and mutant cells (Fig. S5). This is reasonable, as one cannot distinguish by confocal microscopy between Cadherin molecules on neighboring cells. We also saw an increase in DE-Cadherin in cells that over-expressed Yki (Fig. 5G–I), suggesting that the increase seen in wts and mats mutant cells was likely due to the effect of increased nuclear Yki on the transcription of target genes. Most of the increased DE-Cadherin was still localized to adherens junctions in the mutant cells in these experiments so it seems likely to be functional (Fig. 5M–U). The increased level of DE-Cadherin could be due to many possible biochemical mechanisms (e.g. increased transcription, decreased turnover). The results with yki suggested that transcription was involved but such results could be due to a direct or indirect effect on shg, which encodes DE-cadherin in Drosophila. We used an enhancer trap insertion in the shg gene to look for effects on transcription. We observed a significant increase in lacZ immunostaining in both wts and trc mutant clone cells (compared to neighboring wild type cells) and in cells where fry expression was knocked down by expressing a fry ds-RNA from a transgene (Fig. 6, Table 1B). When corrected for background (see Methods) we observed increases that ranged from approximately 2.9 fold (wts) to 1.8 fold (fry) (Table 1B).
Fig. 5.

DE-Cadherin level was up-regulated in trc, fry, wts and mats mutant cells. For most panels DE-Cadherin immunostaining is shown in red and GFP, which was used to mark clones, is shown in green. A merged image is also shown. Panels A–C showed a trcP clone marked by the loss of GFP. Note the increased DE-Cadherin immunostaining of clone cells. Panels D–F showed a wtsP3 clone marked by the loss of GFP. Note the smaller cross section and increased DE-Cadherin staining of the mutant cells. Panels G–I showed a flip out clone marked by GFP expression that over expressed Yki. Note the increased DE-Cadherin staining of the clone cells. Panels J–L showed wings that over expressed DE-Cadherin in the patched domain. In these panels DE-Cadherin staining is shown in red and phalloidin staining in green. Note there is a slight increase in F-actin in the ptc domain cells. Panels M–X are Z axis reconstructions of clones similar to those shown in panels A–L. Clones are shown for trcP (in panels M–O) and wtsP3 (panels P–R), which both showed increased DE-Cadherin staining (arrows). Panels S–U showed a Z axis reconstruction through a flip out clone that over expressed Yki. Note the increased DE-Cadherin staining (arrows). Panels V–X showed a reconstruction through a patched domain where DE-Cadherin is over expressed (red). Note that there is a slight decrease of cell height in the patched domain (middle part). Scale bar is 10 μm.
Table 1.
| A. wts and trc regulate DE-Cadherin level in wing cells. | ||||||
|---|---|---|---|---|---|---|
| gene | Type of treatment | Ratio – raw* | Ratio – corrected# | Clone different*** Raw | Clone different corrected | n |
| wts | clone | 1.42(0.05**) | 3.59(0.29**) | p<0.001 | p<0.001 | 30 |
| trc | clone | 1.20(0.04) | 2.50(0.30) | p<0.001 | p<0.001 | 30 |
| B. wts, trc and fry regulate shg expression in wing cells. | ||||||
| Gene | Type of treatment | Ratio – raw* | Ratio – corrected# | Clone different*** Raw | Clone different corrected | n |
| wts | clone | 1.32 (0.012**) | 2.86 (0.089) | p<0.001 | p<0.001 | 96 |
| fry | RNAi | 1.29 (0.013) | 1.78 (0.037) | p<0.001 | p<0.001 | 60 |
| trc | clone | 1.19 (0.013) | 1.95 (0.095) | p<0.001 | p<0.001 | 26 |
ratio = the maximum intensity of DE-Cadherin (in A) or lacZ (in B) immunostaining of cell periphery inside of the mutant clone (mutant-mutant cell border) divided by the value for that inside neighboring wild type cells (wild type-wild type cell border). Raw data was used with no correction.
the measured intensity values were corrected for background as described in the methods.
the value in parentheses is the standard error.
a T test was used to compare intensities of wild type and mutant cells.
Fig. 6.
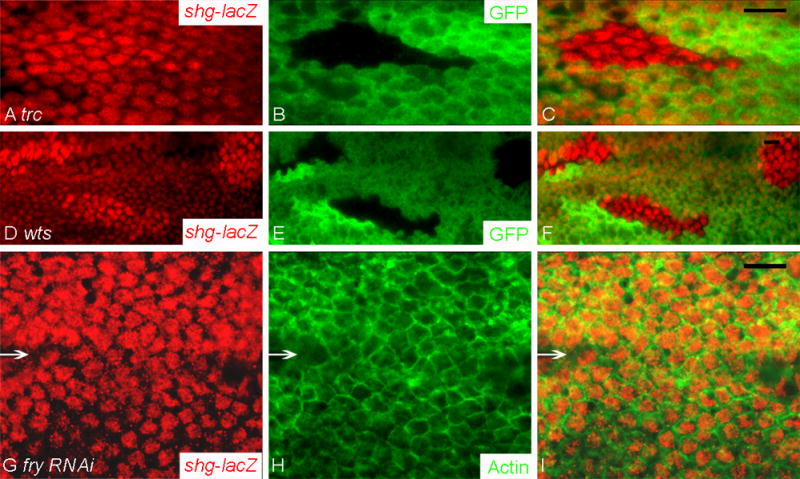
shg expression was up regulated in wts and trc (and fry) mutant cells. shg transcription was assayed using the lacZ enhancer trap as a reporter.
Panels A–C showed a trcP clone marked by the loss of GFP. Panel A showed the lacZ staining (red). Panel B showed the GFP staining (green). Panel C showed the merged picture. Panels D–F showed three wtsP3 clones marked by the loss of GFP. Panel D showed the lacZ staining (red). Panel E showed the GFP staining (green). Panel F showed the merged picture. Panels G–I showed cells where fry level was knocked down by expressing fry dsRNA. Arrows point to the border demarcating the patched domain. The upper part is inside the patched domain where the dsRNA was expressed using the ptc-Gal4 driver. The lower part is outside the patched domain where the cells are wild type. Panel G showed the lacZ staining (red). Panel H showed the F-actin staining (green). Panel I showed the merged picture. Scale bar is 10μm.
In the second set of experiments we examined cells where Gal4 was used to drive increased levels of DE-Cadherin. These cells were generated either by inducing flip out clones that expressed Gal4 or by using the ptcGal4 driver combined with a temperature sensitive Gal80 that allowed us to restrict the time of over-expression. Both of these approaches lead to high levels of DE-Cadherin (Fig. 5J–L, 5V–X, and data not shown). However, we did not see increased cell height nor decreased cross section associated with the increased DE-Cadherin. Indeed, there was a hint of a possible decrease in cell height (Fig. 5V–X).
In other systems it has been observed that E-Cadherin can stimulate actin polymerization (Kovacs et al., 2002b). We saw a 1.3 fold increase in F-actin in cells that greatly over expressed DE-Cadherin (4 fold, as measured by immunostaining at the adherens junction) due to expression being driven by ptcGal4 (Fig. 5J–L, 5V–X, and data not shown). The increased DE-Cadherin in wts and trc mutant cells likely contributed to the increased F-actin seen in these cells but it is unlikely to be the entire story. In both wts and trc clones we observed lesser increases in DE-Cadherin levels (3.6 and 2.5 fold respectively vs 4 fold with ptc-GAL4 driven expression) but greater increases in F-actin level (1.9 and 1.4 fold respectively vs 1.3 fold). These data suggested that wts and trc targets other than DE-cadherin also contributed to the increased F-actin detected in mutant cells.
Wts/Mats and Trc/Fry alter the timing of hair morphogenesis in opposite directions
Wing hair initiation is delayed in trc or fry mutant cells, but precocious in wts and mats mutant cells (Fig. 7A–F and data not shown) (He et al., 2005b). We extended these observations and found that cells over expressing Yki also showed precocious hair initiation (Fig. 7G–I). We also examined clones that were homozygous for a loss of function yki allele (ykiB5). These failed to proliferate extensively, however, we recovered small clones and these showed a delay in hair initiation (Fig. 7J–L). We examined cells that were doubly mutant for wts and yki and found these also showed a delay in hair initiation (Fig. 7S–U), hence yki is epistatic to wts for this phenotype. We concluded that the effects of wts and mats on the timing of hair morphogenesis were mediated by Yki and hence were likely due to effects on gene expression.
Fig. 7.

trc, fry, wts and mats regulate the time for pupal wing hair initiation. Clones are marked either by the loss (trc, wts, yki, ultA and wts yki double mutants) or gain (for UAS-yki flip out clones and Minute clones) of GFP expression (green). F-actin staining (red) is used to assess whether or not hairs have begun to form. A merged image is also shown. Panels A–C showed a trcP clone. Note the larger cross section and delay in hair initiation comparing to neighboring wild type cells (in these and other panels arrows point to cells that haven’t formed hairs, arrowheads to cells formed hairs). Panels D–F showed a wtsP3 clone. Panels G–I showed a UAS-yki flip out clone. Panels J–L showed a ykiB5 mutant clone. Note the lack of hairs at a time when neighbors showed hairs. Panels M–O showed a Minute +/− clone and Panels P–R ultA clones. Note the large ultA cells (asterisks and lack of GFP) do not appear to have an altered time of hair initiation. As seen previously the large ultA clone cells form multiple hairs (Adler, 2000). Panels S–U showed a wtsP3 ykiB5 double mutant clone (marked by loss of GFP) that displays delayed hair formation. . Scale bar is 10 μm.
Again we used Minute wings as a control to determine if cell growth rate per se had an effect on the timing of differentiation. No difference was seen between Minute+/− cells and their wild type neighbors (Fig. 7M–O). Thus, we conclude that growth rate per se did not affect the timing of differentiation. At the later stages in hair morphogenesis, the effects of the different initiation time were greatly diminished. Results similar to this have been seen previously with different mutations (Ren et al., 2005) and are presumably due to the late initiating hairs “catching up”.
The change in the timing of hair initiation was consistent with the effects of the mutations on cell cross sectional area. To determine whether the change in cell shape/cross section area per se could be the cause of the change in the timing of wing hair initiation, we examined clones of polyploid cells homozygous for the ultA mutation (Adler, 2000). These cells had a substantially larger cross sectional area and a similar cell height compared to the wild type neighbors. No difference in the timing of hair initiation was seen in the ultA mutant clones (Fig. 7P–R), thus cross sectional area per se was not the cause of the changes in the timing of hair initiation.
Mwh and the timing of hair morphogenesis
The opposite phenotypes on the timing of wing hair initiation in trc (or fry) and wts (or mats) mutant clones suggested that the two gene modules might function in an antagonistic fashion to regulate the expression of downstream target genes. To test this possibility, we immunostained pupal wings to detect the endogenous Mwh protein in trc, fry, wts and mats mutant clones. The expression of mwh increases prior to hair formation and then the amount of Mwh remains relatively constant for more than 12 hours (Fig. S6) (Yan et al., 2008). We have found that it can be used as a reporter for the initiation of the hair morphogenesis gene expression program (Yan et al., 2008). In addition, the strong multiple hair cell phenotype of mwh is partly mimicked by the trc (or fry) mutant phenotype. We found decreased accumulation of Mwh in 31-hour APF trc (Fig. 8A–C) and fry (data not shown) mutant cells, and in contrast increased levels of Mwh in wts (Fig. 8D–F) and mats (data not shown) mutant cells. We considered two possible models to explain these observations. First, the changes could be due to a delay or advancement in the entire hair gene expression program. If the lowered accumulation of Mwh in the mutant clones was due to a delay in the entire hair gene expression program then at later stages in hair morphogenesis the levels of Mwh should be similar in wild type and mutant cells. Alternatively, it is possible that the mutations directly alter the expression of mwh, and in that case we expect that Mwh levels would still be changed at later stages.
Fig. 8.

Mwh expression is regulated by trc, fry, wts, mats and yki.
In all panels, clones are marked by the loss (trc and wts clones) or gain (UAS-yki flip out clones) of GFP (green). Mwh immunostaining is shown in red and a merged image is also shown. Panels A–C showed a trcP clone and panels D–F a wtsP3 clone. Note the decrease in Mwh staining in the trcP clone and the increase in Mwh staining in the wtsP3 clone. Panels G–I showed a UAS-yki flip out clone. Note the increase in Mwh accumulation in the cells that overexpressed Yki. Scale bar is 10 μm.
To determine which hypothesis was correct, we immunostained both younger (25 hours APF) and older (35 hours APF) clone-bearing wings with anti-Mwh antibody. We found no obvious change in Mwh levels in the either early-stage (25APF) or late-stage (35APF) wts, mats, trc or fry mutant cells compared to their neighbors (Fig. S7), suggesting that the protein level change/accumulation of Mwh was due to the advancement (wts or mats mutations) or delay (trc or fry mutations) of the entire wing hair differentiation program.
To determine if the effect of Wts (or Mats) on Mwh was mediated through Yki we stained 30-hour APF pupal wings that contained marked UAS-yki over expressing cells. We saw increased Mwh immunostaining although this did not appear to be as strong as in wts or mats mutant clones (Fig. 8G–I). The lesser effect could be due to wts or mats negative regulation of Yki, which was still functional in these cells. Once again the regulation was stage specific as no effect was seen in either 25-hour APF or 35-hour APF pupal wings (data not shown). Our data indicate that the regulation of Mwh by Wts or Mats was mediated through the Yki transcriptional factor, and the regulation of Mwh by Trc and Fry is in the opposite direction to that by Wts, Mats and Yki.
In a complementary set of experiments we asked if Mwh regulated Trc and Fry. We immunostained pupal wings that contained marked mwh clones, and found no change in either the level or the subcellular location of Trc or Fry (Fig. S8). This is consistent with Mwh functioning at the level of the cytoskeleton (Yan et al., 2008).
The observed decrease/delay in Mwh accumulation in trc or fry clones was unlikely to be the principal reason for the strong trc or fry multiple hair cell phenotype as mwh trc and mwh fry double mutants had a substantially stronger phenotype than either single mutant (Fig. 1G–I)(Cong et al., 2001). The double mutant phenotype was at least as strong as expected from the addition of the two single mutant phenotypes. These observations argued compellingly that trc or fry produced its strong multiple hair cell phenotype by functioning in parallel to mwh.
trc and wts function in parallel
Wing cells mutant for trc or fry displayed a very strong multiple hair cell phenotype, but the hairs were of relatively normal shape and polarity. The phenotype of trc fry double mutant cells was indistinguishable from either single mutant, consistent with these genes functioning in a common pathway (Cong et al., 2001). In contrast, wts and mats mutant cells showed apical bulging, retained pedestals and only occasionally formed multiple hairs. Such multiple hair cells were only seen in highly abnormal cells (He et al., 2005a). In adult flies, we found that some yki over expressing cells showed a multiple-hair phenotype, others the bulged tumor phenotype, and many cells showed both (Fig. 1D–F). Thus, yki over expressing cells displayed phenotypes typical of both wts and trc mutant cells (see Fig S9 for additional examples). This suggested the possibility that Trc, might like Wts, phosphorylate and negatively regulate Yki. As a test of this hypothesis we used enhancer trap insertions into the diap1, CycE and ex genes that are well-established readouts of Yki activity (Hamaratoglu et al., 2006; Huang et al., 2005). We did not see any alterations in the expression of these enhancer traps in trc mutant cells (Fig. S10), suggesting that Trc does not regulate Yki.
An alternative explanation for the yki over-expression multiple hair cell phenotype is that Yki might negatively regulate trc or fry expression. In this model yki over-expression would be equivalent to a hypomorphic trc (or fry) mutation. As a test of this possibility we immunostained yki over-expressing cells to detect the endogenous Trc and Fry proteins. In contrast to the expectations of the model we found increased levels of Trc and Fry immunostaining (Fig. S11). Thus, our data indicate that yki regulates the accumulation of Trc and Fry but this cannot explain the multiple-hair cell phenotype associated with yki over-expression.
As an additional test of whether Wts/Mats and Trc/Fry functioned in the same pathway in regulating hair formation and cell shape, we examined doubly mutant cells. We generated wts trc double mutant cells by inducing wts loss-of-function clones in wings where we over-expressed trcS292A T453A (a Trc dominant negative protein) (He et al., 2005a) in the patched (ptc) domain of the wing. The wts mutant clone outside the ptc domain served as control wts single mutant cells and non clone cells within the ptc domain served as control trc single mutant cells. The wts mutant clones inside the ptc domain were effectively wts trc double mutant cells. In wts trc double mutant cells, the phenotypes appeared to be additive (Fig. 1C). That is, the doubly mutant cells showed both the bulging cell phenotype (which is similar to the effect caused by the single wts mutation, Fig. 1B) and the extreme multiple wing hair phenotype characteristic of trc mutation (Fig. 1A). The additivity of the double mutants argued that trc and wts function in parallel in wing cells.
Discussion
Connections between the Wts/Mats and the Trc/Fry pathways
The Hpo kinase is well known to function upstream of Wts. Recently, it was found that Hpo also functioned upstream of Trc in type IV da neurons (Emoto et al., 2006). In that study it was also shown that Hpo could be co-immunoprecipitated with both Trc and Wts and that Hpo could phosphorylate Trc at residue T453. This residue is conserved in homologs of Trc in other species, and its phosphorylation is essential for the kinase activity of Trc (Emoto et al., 2006; He et al., 2005b). In these cells Trc is required for dendrite tiling and Wts is required for the maintenance of dendrites (Emoto et al., 2006). hpo mutants showed defects in both dendrite tiling and maintenance, which is the additive phenotype of trc and wts mutations. We found in pupal wing cells that hpo mutants caused accelerated hair initiation and an increase in cell height. Both of these phenotypes mimic the phenotypes observed in wts or mats mutant cells. However, the increased cell length was not as dramatic as observed in wts or mats mutant cells, and we did not see a dramatic decrease in cell cross sectional area. That the hpo mutant phenotype was weaker than that of wts could be due to hpo regulating both wts and trc in the epidermis and these two targets having antagonistic phenotypes. However, we did not see evidence of a trc-like multiple hair cell phenotype in hpo mutant cells. Thus, it did not seem likely that hpo activity is essential for the activation of Trc in wing cells to insure that a single hair is formed.
The Yorkie transcription factor is the major downstream target of Hpo-Sav-Wts pathway. Phosphorylation of Yki by Wts leads to its movement from the nucleus to cytoplasm where it can no longer regulate gene expression (Dong et al., 2007; Zhang et al., 2008). Clones of cells that over-expressed Yki (due to a flip out actin-Gal4 clone) sometimes showed a phenotype that could be interpreted as a result of the addition of individual trc and wts mutant phenotypes (Fig. 1). This raised the possibility that either Yki negatively regulated trc and fry or that Trc acted as a negative regulator of Yki. To test the former hypothesis, we immunostained yki over expressing cells to evaluate the level of Trc and Fry protein. In contrast to expectations of the model, Trc and Fry levels were increased. Thus, we cannot explain the multiple wing hair cell phenotype of yki over expression by it negatively regulating trc or fry. We suggest that multiple-hair cell phenotype associated with yki over expression is due to effects on the transcription of unidentified target genes involved in hair morphogenesis. In our experiments the over expression of yki resulted in a wider range of mutant phenotypes than wts loss of function clones. This could be due to the over expression by passing possible wts independent regulation of yki (Badouel et al., 2009)
An alternative hypothesis was that Trc negatively regulated Yki. The human Lats and Ndr proteins have the same substrate specificity (HXR/H/KXXS/T) in vitro (Hao et al., 2008; Zhao et al., 2007). A similar sequence surrounds Yki S168 (HSRARS168), which is the site in Yki that is phosphorylated by Wts. Thus, it seemed possible that Trc, like Wts, might be able to phosphorylate and inactivate Yki. To test this hypothesis we asked if the expression of known transcriptional targets of Yki (ex, diap1, CycE) would be altered by a loss of trc activity. No effect on these targets was seen leading us to conclude that Trc did not regulate Yki. We suggest that differences in Trc and Wts that map outside of the conserved region (i.e. kinase domain) control this aspect of target specificity.
Actin, cell adhesion and cell shape are regulated by NDR kinases
F-actin levels in cells are a consequence of the balance between actin polymerization and depolymerization. Mutations in both trc and wts led to increased F-actin in wing cells. We used LatA to assess whether for wts this was due to effects on actin polymerization or depolymerization. These experiments showed the rate of actin depolymerization was similar in mutant clone cells and their wild type neighbors. Thus, we concluded that the difference in F-actin levels were due to wts resulting in increased actin polymerization. Other experiments argued that the effects of wts on F-actin levels were mediated through its regulation of Yki. This suggested that the action of wts was due to effects on gene expression and hence indirect and not due to Wts phosphorylating a protein directly involved in modulating actin polymerization.
Many factors are known to modulate actin polymerization during development. For example, in early embryos intercellular signaling plays a major role in regulating the location and density of cortical actin assembly. In particular, Cadherins have been implicated in regulating the actin cytoskeleton. In the early stages of epithelia formation F-actin assembles at the cytoplasmic domains of transmembrane Cadherins (Ehrlich et al., 2002; Jamora and Fuchs, 2002; Kovacs et al., 2002a; Kovacs et al., 2002b; Vaezi et al., 2002). In cultured cells, incubation with E-Cadherin can activate Rac1 and Cdc42, both of which are involved in actin polymerization and organization (Betson et al., 2002; Kim et al., 2000; Kovacs et al., 2002a; Nakagawa et al., 2001). A recent study showed that C-Cadherin expression is both necessary and sufficient for cortical actin assembly in Xenopus embryo (Tao et al., 2007). These observations combined with the increased level of DE-Cadherin seen in trc, fry, wts and mats mutant cells suggested the possibility that the increased cadherin could be the cause of the increased actin polymerization. However, we saw only a modest increase in F-actin levels in cells where we directed high levels of DE-Cadherin expression. Thus, while the increased DE-Cadherin in trc and wts mutant cells likely contributed to the increased level of F-actin it is likely that an alternative mechanism is also important.
There are several possible ways in which mutations in trc, fry, wts, and mats could lead to an increase in DE-Cadherin levels. Loss of wts or mats activity leads to an increase in nuclear Yki. If Yki acted as a positive regulator of DE-Cadherin expression this would provide a mechanism to increase DE-Cadherin levels. Consistent with this hypothesis we found that the expression of a shg enhancer trap was increased in wts mutant wing cells. Previous studies on trc and fry had not addressed their possible function in regulating transcription. In yeast is it well established that Cbk1p activates daughter cell gene expression in the bud by activating Ace2p (Nelson et al., 2003; Weiss et al., 2002). Cbk1p blocks the nuclear export of Ace2p by phosphorylation of the nuclear export signal. This leads to the daughter cell specific nuclear accumulation of Ace2p (Bourens et al., 2008). We found increased expression of the shg enhancer trap in trc clones and in cells where a fry ds-RNA was expressed. These results establish that these two genes regulate gene expression in flies and identify a target although the mechanism involved remains unknown.
In other systems it is known that DE-Cadherin accumulation is regulated by post-transcriptional mechanisms. In human MCF-cells, E-Cadherin level at the cell surface is actively regulated by both the endocytosis and the recycling of internalized E-Cadherin (Bryant et al., 2007). Both EGF signaling and Rac1-modulated macropinocytosis are thought to be involved (Bryant et al., 2007). Similar regulation of DE-Cadherin was also found in flies. The Drosophila EGF receptor homolog (EGFR) genetically interacts with DE-Cadherin, and EGFR could be co-immunoprecipitated with DE-Cadherin and Armadillo in the Drosophila embryo (Dumstrei et al., 2002). At this time we know of no evidence that trc or wts is involved in such processes but we cannot rule out the possibility that NDR family kinases regulate DE-Cadherin accumulation by multiple mechanisms.
An alternative hypothesis is that the increased DE-Cadherin immunostaining seen in wts or mats mutant cells was not due to increased cellular levels of the protein but rather to the smaller cross sectional area seen in these cells. If the same amount of DE-Cadherin was distributed over this shorter periphery the local concentration would be increased. Our experiments were not able to determine if other aspects of the adherens junctions were also changed (e.g. density, distance they occupy along the apical/basal axis). However, on the whole our data argue against this being the major mechanism involved. The relative increase measured in DE-Cadherin was substantially greater (~3.6) than the decrease seen in the cellular periphery (~1.2). Further, we observed an increase in expression of a shg enhancer trap in wts mutant cells and this cannot be explained by decreased cell periphery. Note that changes in cell periphery cannot explain the increased DE-Cadherin staining in trc mutant cells where cross section is increased. Indeed, we would expect a lower density of DE-Cadherin staining in trc or fry mutant cells if there was no overall change in DE-Cadherin levels.
Tissue shape and NDR kinases
The pupal wing is comprised of two simple epithelial sheets separated by a thin extra-cellular matrix. Except for the cells that form the veins the wing cells are all the same height and extend from the basement membrane to the common apical surface. We suggest the flat surfaces of the wing are a consequence of lattice of adherens junctions constraining the cells (Fig. 9). Interestingly, when we examined wts or mats clones the cells were typically taller than their neighbors. In small clones this was accommodated by the apical surface remaining flat and the basal surface being deformed. This deformation resulted in a shortening of the wild type cells juxtaposed across the basement membrane from the wts or mats mutant cells. This suggested that the wts or mats mutant cells are stiffer than normal wild type cells and as they lengthen they deform the juxtaposed cells. In larger wts or mats mutant clones the wing was often bulged (Fig. S12). We suspected that this was at least partially a consequence of the extra cell proliferation and the need to accommodate more cells on one surface than the other. The need to accommodate more cells on one wing surface than the other might also have played a role in the lengthening of wts or mats mutant cells in the smaller clones. The compression due to the crowding could provide the force that drives the increased cell height. It has previously been suggested that such compression could provide a growth control signal and this might be defective in wts or mats mutant cells (Aegerter-Wilmsen et al., 2007; Shraiman, 2005).
Fig. 9.
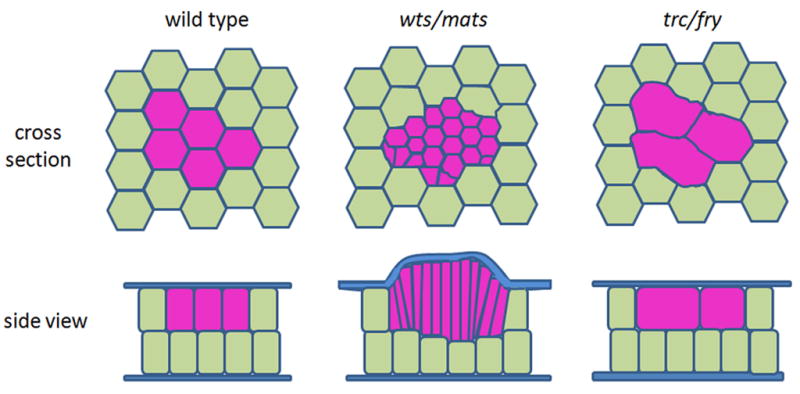
A cartoon model showing the changes of cross section area and cell height in the wts (or mats) or trc (or fry) mutant cells (purple) comparing to wild type cells (olive green). Minute+/− cells don’t showed a cell shape change and fit in the wild type cell model. The blue outline in the cross section view represents a lattice of adherens junctions.
Hair differentiation program and NDR kinases
Oncogenic transformation and cancer are usually associated with defects in terminal differentiation (Alberts et al., 2002). Indeed, decreased differentiation, together with increased proliferation rate and reduced adhesion are often positively associated with more aggressive and invasive tumor behavior in cancer (Koivisto and Salaspuro, 1998). Wts and Mats are both tumor suppressors, thus it was quite surprising that cells that lacked function for these genes showed precocious hair differentiation and increased DE-Cadherin staining. This is opposite to what is normally associated with genetic changes that lead to tumors. Over expression of Yki also leads to both overgrowth and precocious terminal differentiation, thus both phenotypes are likely a consequence of altered gene expression. How can we explain a single genetic change being associated with this unusual set of phenotypes? We suggest that both phenotypes are due to context dependent changes in gene expression. The assortment and activity of other transcription factors in wing cells varies as a consequence of developmental stage (e.g. the stimulation of adult differentiation by ecdysone leads to a new set of active transcription factors) (Thummel, 1996). Enhancers in many genes would integrate the activities of Yki/Sd (or Yki interacting with an alternative partner) with other factors. In a cell with increased Yki activity prior to the hormonal stimulation for adult terminal differentiation the gene expression program would promote growth and inhibit apoptosis leading to the over growth phenotypes of wts or mats mutations. After the appropriate hormonal stimulation, Yki activity would promote the expression of genes that are part of the terminal differentiation program leading to precocious differentiation.
Supplementary Material
Panel A showed a pupal wing stained with anti-β-galactosidase (red) and anti-GFP antibody (green). A wts mutant clone was marked by loss of GFP. Panels B–D showed blow-up images in the selected area in panel A. B, merged picture; C, shg-lacZ staining; D, GFP staining. Panel E shows typical areas that where fluorescence intensity was measured (cytoplasmic, clone nuclear, and non-clone nuclear).
Panels A–F showed hpo42-47/hpo42-47 clones in 30–32-hour APF pupal wings.
Panels A–C F-actin intensity was increased, but the cell cross-section area changed little in hpo mutant cells. Panel A, F-actin staining (red). Panel B, GFP staining (green), loss of GFP marked the hpo mutant clone in a 30-hour APF pupal wing. Panel C, merged picture. Notice the increased F-actin level in mutant cells (arrow points to mutant cell; arrowhead points to the neighboring wild type cell).
Panels D–F Cell height was increased in hpo mutant cells. Panel D showed F-actin staining. Panel E, GFP staining (green), loss of GFP marked the hpo mutant clone in a 31–32-hour APF pupal wing. Panel F showed merged picture. Notice the mutant cells with increased cell length on the right side of the upper layer (average cell length was measured as the distance between the apical cell surface and the midline between two cell layers, indicated by double-sided arrows). Single arrow measures the cell height of mutant cells, and double-arrow measures that of wild type cells.
Chart A showed that trc mutant cells divided faster than twin spot cells. Each point showed an individual clone from the 30-hour pupal wing. The Y-axis showed the number of twin spot cells of the clone, and the X-axis showed the number of loss-of-GFP marked trc mutant cells.
Chart B showed that fry mutant cells divided faster than twin spot cells. Each point showed an individual clone from the 30-hour pupal wing. The Y-axis showed the number of twin spot cells of the clone, and the X-axis showed the number of loss of GFP marked fry mutant cells.
Chart C showed that wts mutant cells divided faster than twin spot cells. Each point showed an individual clone from the 30-hour pupal wing. The Y-axis showed the number of twin spot cells of the clone, and the X-axis showed the number of loss of GFP marked wts mutant cells.
Chart D showed that mats mutant cells divided faster than twin spot cells. Each point showed an individual clone from the 30-hour pupal wing. The Y-axis showed the number of twin spot cells of the clone, and the X-axis showed the number of loss-of-GFP marked mats mutant cells.
Acetylated tubulin staining is shown in red. GFP (in panel A) and lacZ (in panel B) are shown in green. Panel A–C showed a wtsP3 clone. Panel D–F showed a fryT2K61 clone. Scale bar is 10 μm Equivalent results were obtained using anti-Tubulin antibody.
The error bar showed the standard error. The maximum value of the DE-Cadherin on the cell border was measured. Both raw data and corrected (to get rid of the background) data are shown.
Panel A showed that overall Mwh staining intensity changes in hair layer.
Panel B showed that Mwh staining intensity changes in single hair.
Scale bar is10μm.
Panels A–X showed clones on pupal wings of various ages as described below.
Panels A–C showed that endogenous Mwh was not changed in trcp/trcp mutant cells in 25-hour pupal wings. This is prior to hair initiation. Panel A, red, anti-Mwh staining. Panel B, anti-GFP staining (green), and loss of GFP marked the trc mutant clone.
Panel C, merged picture.
Panels D–F showed that endogenous Mwh was not changed in trcp/trcp mutant cells in 35-hour pupal wings. This is late in hair differentiation. Panel D, red, anti-Mwh staining. Panel E, anti-GFP staining (green), and loss of GFP marked the trc mutant clone. Panel F, merged picture.
Panels G–I showed that endogenous Mwh was not changed in fryT2K61/fryT2K61 mutant cells in 25-hour pupal wings. This is prior to hair initiation. Panel G, red, anti-Mwh staining. Panel H, anti-GFP staining (green), and loss of GFP marked the fry mutant clone. Panel I, merged picture.
Panels J–L showed that endogenous Mwh was not changed in fryT2K61/fryT2K61 mutant cells in 35-hour pupal wings. This is late in hair differentiation. Panel J, red, anti-Mwh staining. Panel K, anti-GFP staining (green), and loss of GFP marked the fry mutant clone. Panel L, merged picture.
Panels M–O showed that endogenous Mwh was not changed in wtsP3/wtsP3 mutant cells in 25-hour pupal wings. This is prior to hair initiation. Panel M, red, anti-Mwh staining. Panel N, anti-GFP staining (green), and loss of GFP marked the wts mutant clone. Panel O, merged picture.
Panels P–R showed that endogenous Mwh was not changed in wtsP3/wtsP3 mutant cells in 35-hour pupal wings. This is late in hair differentiation. Panel P, red, anti-Mwh staining. Panel Q, anti-GFP staining (green), and loss of GFP marked the wts mutant clone. Panel R, merged picture.
Panels S-U showed that endogenous Mwh was not changed in matse03077/matse03077 mutant cells at early stage (25-hour APF). Panel S, red, anti-Mwh staining. Panel T, anti-GFP staining (green), and loss of GFP marked the mats mutant clone. Panel U, merged picture.
Pasnels V-X show later stage matse03077/matse03077 mutant cells in 35-hour pupal wings. This is late in hair differentiation. Panel V, red, anti-Mwh staining. Panel W, anti-GFP staining (green), and loss of GFP marked the mats mutant clone.
Panel X, merged picture.
Scale bar is10μm.
Panels A–C showed that the level of endogenous Trc was not changed in mwh mutant cells. Panel A showed anti-Trc staining (red). Panel B showed anti-GFP staining (green), and loss of GFP marked the mwh mutant clone. Panel C showed merged picture.
Panels D–F showed that the level of endogenous Fry was not changed in mwh mutant cells. Panel D showed anti-Fry staining (red). Panel E showed anti-GFP staining (green), and loss of GFP marked the mwh mutant clone. Panel F showed merged picture.
Panels G–I showed that the level of endogenous Trc was not changed in mwh mutant cells. Side view. Panel G showed anti-Trc staining (red). Panel H showed anti-GFP staining (green), and loss of GFP marked the mwh mutant clone. Panel I showed merged picture.
Panels J–L showed that the level of endogenous Fry was not changed in mwh mutant cells. Side view. Panel J showed anti-Fry staining (red). Panel K showed anti-GFP staining (green), and loss of GFP marked the mwh mutant clone. Panel L showed merged picture.
Panels A–H are examples of wts loss of function clones (the clones in panels C and E are of wts3–17, all others are of wtsP3 mutant cells. A, B and C show clones with relatively weak phenotypes. The hair pedestals and bugled apical cuticle are obvious (arrowheads – for all panels in the figure). D1–D3 are images of different focal planes of a large wts clone. The clone bulges out from the neighboring wing region, the bulged apical cuticle of individual cells is dramatic (arrowheads) and some multiple hair cells are present (arrows – for all panels in the figure). Panel E is a small clone with a strong phenotype. Panels F1-2 are two different focal planes of a small bulged clone. Panel G shows a clone where individual cells show a strong apical bulge but none form multiple hair cells. Panel H is a moderate size wts clone that strongly bulges above the neighboring wing region and where at the level of the individual cells the apical cuticle is bulged and some cells form multiple hair cells. Panels I–N are flip out clones that over express yki. I1-2 are two focal planes of a yki flip out clone that shows bulged apical cuticle but no multiple hair cells. Panel J shows a small clone with multiple hair cells. None of the cells in this clone showed bulged apical cuticle. Panels K1-2 are of a small, 3 cell clone. All three cells have bulged apical cuticle and two of the three produced multiple hairs. Panels L1-2 are two focal planes of a clone with cells that had strong apical bugled cuticle and many produced multiple hairs. Panel M is of a clone where hair pedestals are seen but no multiple hair cells. Panels N1-2 are two focal planes of a larger yki flip out clone along a wing vein. The clone as a whole is elevated above the neighboring wing cells. Many cells produce multiple hairs and bulged apical cuticle is seen.
Scale bar is10μm.
Panels A–I showed trc mutant cells on 32-hour APF pupal wings. NP showed area above the vein (upper part), which was outside patched domain. P showed area below the vein (lower part), which was part of the patched domain. Each stock carries an enhancer trap. For A–C it is cycE-lacZ, for D–F diap1-lacZ, for G–I expanded-lacZ. In each of the panels ptc-GAL4 driven expression of a UAS-trc-RNAi transgene effectively results in a wing that is wild type outside of the patched domain and mutant for trc insided it. F-actin staining is shown in red and lacZ immunostaining in green. A merged image is shown as well.
Panels A–C showed that endogenous CycE expression was not changed by a trc knockdown. Panel A, F-actin staining (red). Panel B, anti-lacZ staining (green). Panel C, merged picture.
Panels D–F showed that endogenous Diap1 expression was not changed by a trc knockdown. Panel D, F-actin staining (red). Panel E, anti-lacZ staining (green). Panel F, merged picture.
Panels G–I showed that endogenous Expanded expression was not changed by a trc knockdown. Panel J, F-actin staining (red). Panel K, anti-lacZ staining (green). Panel L, merged picture.
Scale bar is10μm.
Panels A–F showed actin-GAL4-driven yki flip-out clones in 30-hour APF pupal wing. Clone cells were marked by the expression of GFP.
Panels A–C showed that the level of endogenous Trc was increased in UAS-yki overexpressing cells. Panel A, anti-Trc staining (red). Panel B, anti-GFP staining (green), and gain of GFP marked the UAS-yki overexpressing cells. Panel C, merged picture. Notice the increased Trc staining in yki over-expressing cells (arrows).
Panels D–F showed that the level of endogenous Fry was increased in UAS-yki overexpressing cells. Panel D, anti-Fry staining (red). Panel E, anti-GFP staining (green), and gain of GFP marked the UAS-yki overexpressing cells. Panel F, merged picture. Notice the increased Fry staining in yki over-expressing cells (arrows). The surface of this wing was uneven, which is often seen in wings that bear yki flip out clones.
wts clone is marked by loss of GFP. Panels A–J showed a series of optical sections along the Z-axis with the overlay of GFP and F-actin staining. Panels K–T showed the F-actin staining only. Optical sections were taken every .23 um in this section series. Panel A is section 12, B 24, C 36, D 48, E 60, F 72, G 84, H 96, I 108 and J 120. Panels U and V showed the side view of a wts clone by phalloidin staining of F-actin. Scale bar is10μm.
Acknowledgments
This work was supported by grants from the NIGMS to pna. We thank Jeannette Charlton for help with some of the experiments. We thank the many members of the fly community for sending us reagents, particularly D.J. Pan, G. Halder and the Drosophila stock center at Indiana University.
Footnotes
Publisher's Disclaimer: This is a PDF file of an unedited manuscript that has been accepted for publication. As a service to our customers we are providing this early version of the manuscript. The manuscript will undergo copyediting, typesetting, and review of the resulting proof before it is published in its final citable form. Please note that during the production process errors may be discovered which could affect the content, and all legal disclaimers that apply to the journal pertain.
References
- Adler PN, Liu J, Charlton J. Cell size and the morphogenesis of wing hairs in Drosophila. Genesis. 2000;28:82–91. doi: 10.1002/1526-968x(200010)28:2<82::aid-gene60>3.0.co;2-z. [DOI] [PubMed] [Google Scholar]
- Aegerter-Wilmsen T, Aegerter CM, Hafen E, Basler K. Model for the regulation of size in the wing imaginal disc of Drosophila. Mechanisms of Development. 2007;124:318–326. doi: 10.1016/j.mod.2006.12.005. [DOI] [PubMed] [Google Scholar]
- Alberts B, Johnson A, Lewis J, Raff M, Roberts K, Walter P. Molecular Biology of the Cell. 4 2002. [Google Scholar]
- Badouel C, Gardano L, Amin N, Garg A, Rosenfeld R, Le Bihan T, McNeill H. The FERM-Domain Protein Expanded Regulates Hippo Pathway Activity via Direct Interactions with the Transcriptional Activator Yorkie. Developmental Cell. 2009;16:411–420. doi: 10.1016/j.devcel.2009.01.010. [DOI] [PubMed] [Google Scholar]
- Betson M, Lozano E, Zhang J, Braga VMM. Rac Activation upon Cell-Cell Contact Formation Is Dependent on Signaling from the Epidermal Growth Factor Receptor. J Biol Chem. 2002;277:36962–36969. doi: 10.1074/jbc.M207358200. [DOI] [PubMed] [Google Scholar]
- Bidlingmaier S, Weiss EL, Seidel C, Drubin DG, Snyder M. The Cbk1p Pathway Is Important for Polarized Cell Growth and Cell Separation in Saccharomyces cerevisiae. Mol Cell Biol. 2001;21:2449–2462. doi: 10.1128/MCB.21.7.2449-2462.2001. [DOI] [PMC free article] [PubMed] [Google Scholar]
- Bourens M, Racki W, Becam AM, Panozzo C, Boulon S, Bertrand E, Herbert C. Mutations in a small region of the exportin Crm1p disrupt the daughter cell-specific nuclear localization of the transcription factor Ace2p in Saccharomyces cerevisiae. Biology of the Cell. 2008;100:343–354. doi: 10.1042/BC20070077. [DOI] [PubMed] [Google Scholar]
- Bryant DM, Kerr MC, Hammond LA, Joseph SR, Mostov KE, Teasdale RD, Stow JL. EGF induces macropinocytosis and SNX1-modulated recycling of E-cadherin. J Cell Sci. 2007;120:1818–1828. doi: 10.1242/jcs.000653. [DOI] [PubMed] [Google Scholar]
- Chiba S, Ikeda M, Katsunuma K, Ohashi K, Mizuno K. MST2- and Furry-Mediated Activation of NDR1 Kinase Is Critical for Precise Alignment of Mitotic Chromosomes. Current Biology. 2009;19:675–681. doi: 10.1016/j.cub.2009.02.054. [DOI] [PubMed] [Google Scholar]
- Colman-Lerner A, Chin TE, Brent R. Yeast Cbk1 and Mob2 Activate Daughter-Specific Genetic Programs to Induce Asymmetric Cell Fates. Cell. 2001;107:739–750. doi: 10.1016/s0092-8674(01)00596-7. [DOI] [PubMed] [Google Scholar]
- Cong J, Geng W, He B, Liu J, Charlton J, Adler PN. The furry gene of Drosophila is important for maintaining the integrity of cellular extensions during morphogenesis. Development. 2001;128:2793–2802. doi: 10.1242/dev.128.14.2793. [DOI] [PubMed] [Google Scholar]
- Dong J, Feldmann G, Huang J, Wu S, Zhang N, Comerford SA, Gayyed M, Anders RA, Maitra A, Pan D. Elucidation of a Universal Size-Control Mechanism in Drosophila and Mammals. Cell. 2007;130:1120–1133. doi: 10.1016/j.cell.2007.07.019. [DOI] [PMC free article] [PubMed] [Google Scholar]
- Du LL, Novick P. Pag1p, a Novel Protein Associated with Protein Kinase Cbk1p, Is Required for Cell Morphogenesis and Proliferation in Saccharomyces cerevisiae. Mol Biol Cell. 2002;13:503–514. doi: 10.1091/mbc.01-07-0365. [DOI] [PMC free article] [PubMed] [Google Scholar]
- Dumstrei K, Wang F, Shy D, Tepass U, Hartenstein V. Interaction between EGFR signaling and DE-cadherin during nervous system morphogenesis. Development. 2002;129:3983–3994. doi: 10.1242/dev.129.17.3983. [DOI] [PubMed] [Google Scholar]
- Ehrlich JS, Hansen MDH, Nelson WJ. Spatio-Temporal Regulation of Rac1 Localization and Lamellipodia Dynamics during Epithelial Cell-Cell Adhesion. Developmental Cell. 2002;3:259–270. doi: 10.1016/s1534-5807(02)00216-2. [DOI] [PMC free article] [PubMed] [Google Scholar]
- Emoto K, He Y, Ye B, Grueber WB, Adler PN, Jan LY, Jan YN. Control of Dendritic Branching and Tiling by the Tricornered-Kinase/Furry Signaling Pathway in Drosophila Sensory Neurons. Cell. 2004;119:245–256. doi: 10.1016/j.cell.2004.09.036. [DOI] [PubMed] [Google Scholar]
- Emoto K, Parrish JZ, Jan LY, Jan YN. The tumour suppressor Hippo acts with the NDR kinases in dendritic tiling and maintenance. Nature. 2006;443:210–213. doi: 10.1038/nature05090. [DOI] [PubMed] [Google Scholar]
- Gallegos ME, Bargmann CI. Mechanosensory Neurite Termination and Tiling Depend on SAX-2 and the SAX-1 Kinase. Neuron. 2004;44:239–249. doi: 10.1016/j.neuron.2004.09.021. [DOI] [PubMed] [Google Scholar]
- Geng W, He B, Wang M, Adler PN. The tricornered Gene, Which Is Required for the Integrity of Epidermal Cell Extensions, Encodes the Drosophila Nuclear DBF2-Related Kinase. Genetics. 2000;156:1817–1828. doi: 10.1093/genetics/156.4.1817. [DOI] [PMC free article] [PubMed] [Google Scholar]
- Hamaratoglu F, Willecke M, Kango-Singh M, Nolo R, Hyun E, Tao C, Jafar-Nejad H, Halder G. The tumour-suppressor genes NF2/Merlin and Expanded act through Hippo signalling to regulate cell proliferation and apoptosis. Nat Cell Biol. 2006;8:27–36. doi: 10.1038/ncb1339. [DOI] [PubMed] [Google Scholar]
- Hao Y, Chun A, Cheung K, Rashidi B, Yang X. Tumor Suppressor LATS1 Is a Negative Regulator of Oncogene YAP. J Biol Chem. 2008;283:5496–5509. doi: 10.1074/jbc.M709037200. [DOI] [PubMed] [Google Scholar]
- He Y, Emoto K, Fang X, Ren N, Tian X, Jan YN, Adler PN. Drosophila Mob Family Proteins Interact with the Related Tricornered (Trc) and Warts (Wts) Kinases. Mol Biol Cell. 2005a;16:4139–4152. doi: 10.1091/mbc.E05-01-0018. [DOI] [PMC free article] [PubMed] [Google Scholar]
- He Y, Fang X, Emoto K, Jan YN, Adler PN. The Tricornered Ser/Thr Protein Kinase Is Regulated by Phosphorylation and Interacts with Furry during Drosophila Wing Hair Development. Mol Biol Cell. 2005b;16:689–700. doi: 10.1091/mbc.E04-09-0828. [DOI] [PMC free article] [PubMed] [Google Scholar]
- Hergovich A, Lamla S, Nigg EA, Hemmings BA. Centrosome-Associated NDR Kinase Regulates Centrosome Duplication. Molecular Cell. 2007;25:625–634. doi: 10.1016/j.molcel.2007.01.020. [DOI] [PubMed] [Google Scholar]
- Huang J, Wu S, Barrera J, Matthews K, Pan D. The Hippo Signaling Pathway Coordinately Regulates Cell Proliferation and Apoptosis by Inactivating Yorkie, the Drosophila Homolog of YAP. Cell. 2005;122:421–434. doi: 10.1016/j.cell.2005.06.007. [DOI] [PubMed] [Google Scholar]
- Jamora C, Fuchs E. Intercellular adhesion, signalling and the cytoskeleton. Nat Cell Biol. 2002;4:E101–E108. doi: 10.1038/ncb0402-e101. [DOI] [PubMed] [Google Scholar]
- Justice RW, Zilian O, Woods DF, Noll M, Bryant PJ. The Drosophila tumor suppressor gene warts encodes a homolog of human myotonic dystrophy kinase and is required for the control of cell shape and proliferation. Genes Dev. 1995;9:534–546. doi: 10.1101/gad.9.5.534. [DOI] [PubMed] [Google Scholar]
- Kim SH, Li Z, Sacks DB. E-cadherin-mediated Cell-Cell Attachment Activates Cdc42. J Biol Chem. 2000;275:36999–37005. doi: 10.1074/jbc.M003430200. [DOI] [PubMed] [Google Scholar]
- Koivisto T, Salaspuro M. Acetaldehyde alters proliferation, differentiation and adhesion properties of human colon adenocarcinoma cell line Caco-2. Carcinogenesis. 1998;19:2031–2036. doi: 10.1093/carcin/19.11.2031. [DOI] [PubMed] [Google Scholar]
- Kongsuwan K, Yu Q, Vincent A, Frisardi MC, Rosbash M, Lengyel JA, Merriam J. A Drosophila Minute gene encodes a ribosomal protein. Nature. 1985;317:555–558. doi: 10.1038/317555a0. [DOI] [PubMed] [Google Scholar]
- Kovacs EM, Ali RG, McCormack AJ, Yap AS. E-cadherin Homophilic Ligation Directly Signals through Rac and Phosphatidylinositol 3-Kinase to Regulate Adhesive Contacts. J Biol Chem. 2002a;277:6708–6718. doi: 10.1074/jbc.M109640200. [DOI] [PubMed] [Google Scholar]
- Kovacs EM, Goodwin M, Ali RG, Paterson AD, Yap AS. Cadherin-Directed Actin Assembly: E-Cadherin Physically Associates with the Arp2/3 Complex to Direct Actin Assembly in Nascent Adhesive Contacts. Current Biology. 2002b;12:379–382. doi: 10.1016/s0960-9822(02)00661-9. [DOI] [PubMed] [Google Scholar]
- Lai ZC, Wei X, Shimizu T, Ramos E, Rohrbaugh M, Nikolaidis N, Ho LL, Li Y. Control of Cell Proliferation and Apoptosis by Mob as Tumor Suppressor, Mats. Cell. 2005;120:675–685. doi: 10.1016/j.cell.2004.12.036. [DOI] [PubMed] [Google Scholar]
- Luca FC, Winey M. MOB1, an Essential Yeast Gene Required for Completion of Mitosis and Maintenance of Ploidy. Mol Biol Cell. 1998;9:29–46. doi: 10.1091/mbc.9.1.29. [DOI] [PMC free article] [PubMed] [Google Scholar]
- Maki C, Rhoads D, Stewart M, Van Slyke B, Roufa D. The Drosophila melanogaster RPS17 gene encoding ribosomal protein S17. Gene. 1989;79:289–298. doi: 10.1016/0378-1119(89)90211-4. [DOI] [PubMed] [Google Scholar]
- Marygold SJ, Roote J, Reuter G, Lambertsson A, Ashburner M, Millburn GH, Harrison PM, Yu Z, Kenmochi N, Kaufman TC, Leevers SJ, Cook KR. The ribosomal protein genes and Minute loci of Drosophila melanogaster. Genome Biol. 2007;8:R216. doi: 10.1186/gb-2007-8-10-r216. [DOI] [PMC free article] [PubMed] [Google Scholar]
- Mikeladze-Dvali T, Wernet MF, Pistillo D, Mazzoni EO, Teleman AA, Chen YW, Cohen S, Desplan C. The Growth Regulators warts/lats and melted Interact in a Bistable Loop to Specify Opposite Fates in Drosophila R8 Photoreceptors. Cell. 2005;122:775–787. doi: 10.1016/j.cell.2005.07.026. [DOI] [PubMed] [Google Scholar]
- Montell DJ. Morphogenetic Cell Movements: Diversity from Modular Mechanical Properties. Science. 2008;322:1502–1505. doi: 10.1126/science.1164073. [DOI] [PubMed] [Google Scholar]
- Nakagawa M, Fukata M, Yamaga M, Itoh N, Kaibuchi K. Recruitment and activation of Rac1 by the formation of E-cadherin-mediated cell-cell adhesion sites. J Cell Sci. 2001;114:1829–1838. doi: 10.1242/jcs.114.10.1829. [DOI] [PubMed] [Google Scholar]
- Nelson B, Kurischko C, Horecka J, Mody M, Nair P, Pratt L, Zougman A, McBroom LDB, Hughes TR, Boone C, Luca FC. RAM: A Conserved Signaling Network That Regulates Ace2p Transcriptional Activity and Polarized Morphogenesis. Mol Biol Cell. 2003;14:3782–3803. doi: 10.1091/mbc.E03-01-0018. [DOI] [PMC free article] [PubMed] [Google Scholar]
- Okada K, Ravi H, Smith EM, Goode BL. Aip1 and Cofilin Promote Rapid Turnover of Yeast Actin Patches and Cables: A Coordinated Mechanism for Severing and Capping Filaments. Mol Biol Cell. 2006;17:2855–2868. doi: 10.1091/mbc.E06-02-0135. [DOI] [PMC free article] [PubMed] [Google Scholar]
- Ono S. Regulation of Actin Filament Dynamics by Actin Depolymerizing Factor/Cofilin and Actin-Interacting Protein 1: New Blades for Twisted Filaments. Biochemistry. 2003;42:13363–13370. doi: 10.1021/bi034600x. [DOI] [PubMed] [Google Scholar]
- Racki WJ, Bécam AM, Nasr F, Herbert CJ. Cbk1p, a protein similar to the human myotonic dystrophy kinase, is essential for normal morphogenesis in Saccharomyces cerevisiae. The EMBO Journal. 2000;19:4524–4532. doi: 10.1093/emboj/19.17.4524. [DOI] [PMC free article] [PubMed] [Google Scholar]
- Ren N, Charlton J, Adler PN. The flare Gene, Which Encodes the AIP1 Protein of Drosophila, Functions to Regulate F-Actin Disassembly in Pupal Epidermal Cells. Genetics. 2007;176:2223–2234. doi: 10.1534/genetics.107.072959. [DOI] [PMC free article] [PubMed] [Google Scholar]
- Ren N, Zhu C, Lee H, Adler PN. Gene Expression During Drosophila Wing Morphogenesis and Differentiation. Genetics. 2005;171:625–638. doi: 10.1534/genetics.105.043687. [DOI] [PMC free article] [PubMed] [Google Scholar]
- Shraiman BI. Mechanical feedback as a possible regulator of tissue growth. Proceedings of the National Academy of Sciences of the United States of America. 2005;102:3318–3323. doi: 10.1073/pnas.0404782102. [DOI] [PMC free article] [PubMed] [Google Scholar]
- Tao Q, Nandadasa S, McCrea PD, Heasman J, Wylie C. G-protein-coupled signals control cortical actin assembly by controlling cadherin expression in the early Xenopus embryo. Development. 2007;134:2651–2661. doi: 10.1242/dev.002824. [DOI] [PubMed] [Google Scholar]
- Thummel C. Files on steroids--Drosophila metamorphosis and the mechanisms of steroid hormone action. Trends Genet. 1996;12:306–10. doi: 10.1016/0168-9525(96)10032-9. [DOI] [PubMed] [Google Scholar]
- Vaezi A, Bauer C, Vasioukhin V, Fuchs E. Actin Cable Dynamics and Rho/Rock Orchestrate a Polarized Cytoskeletal Architecture in the Early Steps of Assembling a Stratified Epithelium. Developmental Cell. 2002;3:367–381. doi: 10.1016/s1534-5807(02)00259-9. [DOI] [PubMed] [Google Scholar]
- Verde F, Wiley DJ, Nurse P. Fission yeast orb6, a ser/thr protein kinase related to mammalian rho kinase and myotonic dystrophy kinase, is required for maintenance of cell polarity and coordinates cell morphogenesis with the cell cycle. Proceedings of the National Academy of Sciences of the United States of America. 1998;95:7526–7531. doi: 10.1073/pnas.95.13.7526. [DOI] [PMC free article] [PubMed] [Google Scholar]
- Racki Waldemar J, AMB, Nasr Fahd, Herbert Christopher J. Cbk1p, a protein similar to the human myotonic dystrophy kinase, is essential for normal morphogenesis in Saccharomyces cerevisiae. The EMBO Journal. 2000;19:4524–4532. doi: 10.1093/emboj/19.17.4524. [DOI] [PMC free article] [PubMed] [Google Scholar]
- Waters JC. Accuracy and precision in quantitative fluorescence microscopy. J Cell Biol. 2009;185:1135–1148. doi: 10.1083/jcb.200903097. [DOI] [PMC free article] [PubMed] [Google Scholar]
- Wei X, Shimizu T, Lai ZC. Mob as tumor suppressor is activated by Hippo kinase for growth inhibition in Drosophila. The EMBO Journal. 2007;26:1772–1781. doi: 10.1038/sj.emboj.7601630. [DOI] [PMC free article] [PubMed] [Google Scholar]
- Weiss EL, Kurischko C, Zhang C, Shokat K, Drubin DG, Luca FC. The Saccharomyces cerevisiae Mob2p-Cbk1p kinase complex promotes polarized growth and acts with the mitotic exit network to facilitate daughter cell-specific localization of Ace2p transcription factor. J Cell Biol. 2002;158:885–900. doi: 10.1083/jcb.200203094. [DOI] [PMC free article] [PubMed] [Google Scholar]
- Wolf DE, Samarasekera C, Swedlow JR, Greenfield S, David EW. Methods in Cell Biology. Vol. 81. Academic Press; 2007. Quantitative Analysis of Digital Microscope Images; pp. 365–396. [DOI] [PubMed] [Google Scholar]
- Wu S, Liu Y, Zheng Y, Dong J, Pan D. The TEAD/TEF Family Protein Scalloped Mediates transcriptional Output of the Hippo Growth-Regulatory Pathway. Developmental Cell. 2008;14:388–398. doi: 10.1016/j.devcel.2008.01.007. [DOI] [PubMed] [Google Scholar]
- Yan J, Huen D, Morely T, Johnson G, Gubb D, Roote J, Adler PN. The multiple-wing-hairs Gene Encodes a Novel GBD-FH3 Domain-Containing Protein That Functions Both Prior to and After Wing Hair Initiation. Genetics. 2008;180:219–228. doi: 10.1534/genetics.108.091314. [DOI] [PMC free article] [PubMed] [Google Scholar]
- Zallen JA, Peckol EL, Tobin DM, Bargmann CI. Neuronal Cell Shape and Neurite Initiation Are Regulated by the Ndr Kinase SAX-1, a Member of the Orb6/COT-1/Warts Serine/Threonine Kinase Family. Mol Biol Cell. 2000;11:3177–3190. doi: 10.1091/mbc.11.9.3177. [DOI] [PMC free article] [PubMed] [Google Scholar]
- Zhang L, Ren F, Zhang Q, Chen Y, Wang B, Jiang J. The TEAD/TEF Family of Transcription Factor Scalloped Mediates Hippo Signaling in Organ Size Control. Developmental Cell. 2008;14:377–387. doi: 10.1016/j.devcel.2008.01.006. [DOI] [PMC free article] [PubMed] [Google Scholar]
- Zhao B, Wei X, Li W, Udan RS, Yang Q, Kim J, Xie J, Ikenoue T, Yu J, Li L, Zheng P, Ye K, Chinnaiyan A, Halder G, Lai ZC, Guan KL. Inactivation of YAP oncoprotein by the Hippo pathway is involved in cell contact inhibition and tissue growth control. Genes & Development. 2007;21:2747–2761. doi: 10.1101/gad.1602907. [DOI] [PMC free article] [PubMed] [Google Scholar]
Associated Data
This section collects any data citations, data availability statements, or supplementary materials included in this article.
Supplementary Materials
Panel A showed a pupal wing stained with anti-β-galactosidase (red) and anti-GFP antibody (green). A wts mutant clone was marked by loss of GFP. Panels B–D showed blow-up images in the selected area in panel A. B, merged picture; C, shg-lacZ staining; D, GFP staining. Panel E shows typical areas that where fluorescence intensity was measured (cytoplasmic, clone nuclear, and non-clone nuclear).
Panels A–F showed hpo42-47/hpo42-47 clones in 30–32-hour APF pupal wings.
Panels A–C F-actin intensity was increased, but the cell cross-section area changed little in hpo mutant cells. Panel A, F-actin staining (red). Panel B, GFP staining (green), loss of GFP marked the hpo mutant clone in a 30-hour APF pupal wing. Panel C, merged picture. Notice the increased F-actin level in mutant cells (arrow points to mutant cell; arrowhead points to the neighboring wild type cell).
Panels D–F Cell height was increased in hpo mutant cells. Panel D showed F-actin staining. Panel E, GFP staining (green), loss of GFP marked the hpo mutant clone in a 31–32-hour APF pupal wing. Panel F showed merged picture. Notice the mutant cells with increased cell length on the right side of the upper layer (average cell length was measured as the distance between the apical cell surface and the midline between two cell layers, indicated by double-sided arrows). Single arrow measures the cell height of mutant cells, and double-arrow measures that of wild type cells.
Chart A showed that trc mutant cells divided faster than twin spot cells. Each point showed an individual clone from the 30-hour pupal wing. The Y-axis showed the number of twin spot cells of the clone, and the X-axis showed the number of loss-of-GFP marked trc mutant cells.
Chart B showed that fry mutant cells divided faster than twin spot cells. Each point showed an individual clone from the 30-hour pupal wing. The Y-axis showed the number of twin spot cells of the clone, and the X-axis showed the number of loss of GFP marked fry mutant cells.
Chart C showed that wts mutant cells divided faster than twin spot cells. Each point showed an individual clone from the 30-hour pupal wing. The Y-axis showed the number of twin spot cells of the clone, and the X-axis showed the number of loss of GFP marked wts mutant cells.
Chart D showed that mats mutant cells divided faster than twin spot cells. Each point showed an individual clone from the 30-hour pupal wing. The Y-axis showed the number of twin spot cells of the clone, and the X-axis showed the number of loss-of-GFP marked mats mutant cells.
Acetylated tubulin staining is shown in red. GFP (in panel A) and lacZ (in panel B) are shown in green. Panel A–C showed a wtsP3 clone. Panel D–F showed a fryT2K61 clone. Scale bar is 10 μm Equivalent results were obtained using anti-Tubulin antibody.
The error bar showed the standard error. The maximum value of the DE-Cadherin on the cell border was measured. Both raw data and corrected (to get rid of the background) data are shown.
Panel A showed that overall Mwh staining intensity changes in hair layer.
Panel B showed that Mwh staining intensity changes in single hair.
Scale bar is10μm.
Panels A–X showed clones on pupal wings of various ages as described below.
Panels A–C showed that endogenous Mwh was not changed in trcp/trcp mutant cells in 25-hour pupal wings. This is prior to hair initiation. Panel A, red, anti-Mwh staining. Panel B, anti-GFP staining (green), and loss of GFP marked the trc mutant clone.
Panel C, merged picture.
Panels D–F showed that endogenous Mwh was not changed in trcp/trcp mutant cells in 35-hour pupal wings. This is late in hair differentiation. Panel D, red, anti-Mwh staining. Panel E, anti-GFP staining (green), and loss of GFP marked the trc mutant clone. Panel F, merged picture.
Panels G–I showed that endogenous Mwh was not changed in fryT2K61/fryT2K61 mutant cells in 25-hour pupal wings. This is prior to hair initiation. Panel G, red, anti-Mwh staining. Panel H, anti-GFP staining (green), and loss of GFP marked the fry mutant clone. Panel I, merged picture.
Panels J–L showed that endogenous Mwh was not changed in fryT2K61/fryT2K61 mutant cells in 35-hour pupal wings. This is late in hair differentiation. Panel J, red, anti-Mwh staining. Panel K, anti-GFP staining (green), and loss of GFP marked the fry mutant clone. Panel L, merged picture.
Panels M–O showed that endogenous Mwh was not changed in wtsP3/wtsP3 mutant cells in 25-hour pupal wings. This is prior to hair initiation. Panel M, red, anti-Mwh staining. Panel N, anti-GFP staining (green), and loss of GFP marked the wts mutant clone. Panel O, merged picture.
Panels P–R showed that endogenous Mwh was not changed in wtsP3/wtsP3 mutant cells in 35-hour pupal wings. This is late in hair differentiation. Panel P, red, anti-Mwh staining. Panel Q, anti-GFP staining (green), and loss of GFP marked the wts mutant clone. Panel R, merged picture.
Panels S-U showed that endogenous Mwh was not changed in matse03077/matse03077 mutant cells at early stage (25-hour APF). Panel S, red, anti-Mwh staining. Panel T, anti-GFP staining (green), and loss of GFP marked the mats mutant clone. Panel U, merged picture.
Pasnels V-X show later stage matse03077/matse03077 mutant cells in 35-hour pupal wings. This is late in hair differentiation. Panel V, red, anti-Mwh staining. Panel W, anti-GFP staining (green), and loss of GFP marked the mats mutant clone.
Panel X, merged picture.
Scale bar is10μm.
Panels A–C showed that the level of endogenous Trc was not changed in mwh mutant cells. Panel A showed anti-Trc staining (red). Panel B showed anti-GFP staining (green), and loss of GFP marked the mwh mutant clone. Panel C showed merged picture.
Panels D–F showed that the level of endogenous Fry was not changed in mwh mutant cells. Panel D showed anti-Fry staining (red). Panel E showed anti-GFP staining (green), and loss of GFP marked the mwh mutant clone. Panel F showed merged picture.
Panels G–I showed that the level of endogenous Trc was not changed in mwh mutant cells. Side view. Panel G showed anti-Trc staining (red). Panel H showed anti-GFP staining (green), and loss of GFP marked the mwh mutant clone. Panel I showed merged picture.
Panels J–L showed that the level of endogenous Fry was not changed in mwh mutant cells. Side view. Panel J showed anti-Fry staining (red). Panel K showed anti-GFP staining (green), and loss of GFP marked the mwh mutant clone. Panel L showed merged picture.
Panels A–H are examples of wts loss of function clones (the clones in panels C and E are of wts3–17, all others are of wtsP3 mutant cells. A, B and C show clones with relatively weak phenotypes. The hair pedestals and bugled apical cuticle are obvious (arrowheads – for all panels in the figure). D1–D3 are images of different focal planes of a large wts clone. The clone bulges out from the neighboring wing region, the bulged apical cuticle of individual cells is dramatic (arrowheads) and some multiple hair cells are present (arrows – for all panels in the figure). Panel E is a small clone with a strong phenotype. Panels F1-2 are two different focal planes of a small bulged clone. Panel G shows a clone where individual cells show a strong apical bulge but none form multiple hair cells. Panel H is a moderate size wts clone that strongly bulges above the neighboring wing region and where at the level of the individual cells the apical cuticle is bulged and some cells form multiple hair cells. Panels I–N are flip out clones that over express yki. I1-2 are two focal planes of a yki flip out clone that shows bulged apical cuticle but no multiple hair cells. Panel J shows a small clone with multiple hair cells. None of the cells in this clone showed bulged apical cuticle. Panels K1-2 are of a small, 3 cell clone. All three cells have bulged apical cuticle and two of the three produced multiple hairs. Panels L1-2 are two focal planes of a clone with cells that had strong apical bugled cuticle and many produced multiple hairs. Panel M is of a clone where hair pedestals are seen but no multiple hair cells. Panels N1-2 are two focal planes of a larger yki flip out clone along a wing vein. The clone as a whole is elevated above the neighboring wing cells. Many cells produce multiple hairs and bulged apical cuticle is seen.
Scale bar is10μm.
Panels A–I showed trc mutant cells on 32-hour APF pupal wings. NP showed area above the vein (upper part), which was outside patched domain. P showed area below the vein (lower part), which was part of the patched domain. Each stock carries an enhancer trap. For A–C it is cycE-lacZ, for D–F diap1-lacZ, for G–I expanded-lacZ. In each of the panels ptc-GAL4 driven expression of a UAS-trc-RNAi transgene effectively results in a wing that is wild type outside of the patched domain and mutant for trc insided it. F-actin staining is shown in red and lacZ immunostaining in green. A merged image is shown as well.
Panels A–C showed that endogenous CycE expression was not changed by a trc knockdown. Panel A, F-actin staining (red). Panel B, anti-lacZ staining (green). Panel C, merged picture.
Panels D–F showed that endogenous Diap1 expression was not changed by a trc knockdown. Panel D, F-actin staining (red). Panel E, anti-lacZ staining (green). Panel F, merged picture.
Panels G–I showed that endogenous Expanded expression was not changed by a trc knockdown. Panel J, F-actin staining (red). Panel K, anti-lacZ staining (green). Panel L, merged picture.
Scale bar is10μm.
Panels A–F showed actin-GAL4-driven yki flip-out clones in 30-hour APF pupal wing. Clone cells were marked by the expression of GFP.
Panels A–C showed that the level of endogenous Trc was increased in UAS-yki overexpressing cells. Panel A, anti-Trc staining (red). Panel B, anti-GFP staining (green), and gain of GFP marked the UAS-yki overexpressing cells. Panel C, merged picture. Notice the increased Trc staining in yki over-expressing cells (arrows).
Panels D–F showed that the level of endogenous Fry was increased in UAS-yki overexpressing cells. Panel D, anti-Fry staining (red). Panel E, anti-GFP staining (green), and gain of GFP marked the UAS-yki overexpressing cells. Panel F, merged picture. Notice the increased Fry staining in yki over-expressing cells (arrows). The surface of this wing was uneven, which is often seen in wings that bear yki flip out clones.
wts clone is marked by loss of GFP. Panels A–J showed a series of optical sections along the Z-axis with the overlay of GFP and F-actin staining. Panels K–T showed the F-actin staining only. Optical sections were taken every .23 um in this section series. Panel A is section 12, B 24, C 36, D 48, E 60, F 72, G 84, H 96, I 108 and J 120. Panels U and V showed the side view of a wts clone by phalloidin staining of F-actin. Scale bar is10μm.