

Abstract
Objectives
This study was undertaken to determine whether the short-lived sinus tachycardia that occurs during standing will expose changes in the QT interval that are of diagnostic value.
Background
The QT interval shortens during heart rate acceleration, but this response is not instantaneous. We tested whether the transient, sudden sinus tachycardia that occurs during standing would expose abnormal QT interval prolongation in patients with long QT syndrome (LQTS).
Methods
Patients (68 with LQTS [LQT1 46%, LQT2 41%, LQT3 4%, not genotyped 9%] and 82 control subjects) underwent a baseline electrocardiogram (ECG) while resting in the supine position and were then asked to get up quickly and stand still during continuous ECG recording. The QT interval was studied at baseline and during maximal sinus tachycardia, maximal QT interval prolongation, and maximal QT interval stretching.
Results
In response to brisk standing, patients and control subjects responded with similar heart rate acceleration of 28 ± 10 beats/min (p = 0.261). However, the response of the QT interval to this tachycardia differed: on average, the QT interval of controls shortened by 21 ± 19 ms whereas the QT interval of LQTS patients increased by 4 ± 34 ms (p < 0.001). Since the RR interval shortened more than the QT interval, during maximal tachycardia the corrected QT interval increased by 50 ± 30 ms in the control group and by 89 ± 47 ms in the LQTS group (p < 0.001). Receiver-operating characteristic curves showed that the test adds diagnostic value. The response of the QT interval to brisk standing was particularly impaired in patients with LQT2.
Conclusions
Evaluation of the response of the QT interval to the brisk tachycardia induced by standing provides important information that aids in the diagnosis of LQTS.
Keywords: long QT syndrome, electrocardiogram, QT interval
The diagnosis of the long QT syndrome (LQTS) is straightforward when torsades de pointes is documented in a patient with obvious QT interval prolongation (1,2). Often, however, diagnosing LQTS is problematic for several reasons: first, arrhythmic symptoms occur infrequently, making it difficult to document torsades de pointes. Second, overlap in the duration of the QT interval exists between carriers of LQTS mutations and healthy control subjects (3). Third, failing to identify a mutation does not exclude the diagnosis of LQTS, and misinterpreting innocent genetic changes as mutations may occur (4). Thus, diagnosing LQTS remains a challenge (5).
The QT interval shortens during tachycardia, but adaptation of the QT interval to sudden heart rate acceleration is not instantaneous (6,7). Moreover, patients with LQTS often display abnormal responses to heart rate changes (8,9). We therefore aimed to take advantage of the abrupt sinus tachycardia that normally occurs during standing to evaluate whether maladaptation of the QT interval to heart rate acceleration would expose pathologic QT interval changes in LQTS patients.
Methods
Patient groups
The LQTS group consisted of patients with high probability for LQTS (International LQTS Registry Score ≥4 points [10]) or definite LQTS (documented torsades de pointes and/or LQTS mutation). The control group consisted of healthy volunteers (92%) and asymptomatic relatives of LQTS patients who are noncarriers of the familial mutation (8%) and who take no medications. The study was approved by our institutional review committee.
Interventions
LQTS patients taking beta-blockers underwent the test 26 to 30 h after their last dosage. For the test, participants rested supine for 10 min. They then got up quickly and remained standing for 5 min during continued electrocardiography (ECG) recording. Implanted devices were programmed to single-chamber ventricular pacing at 35 beats/min for the duration of the test.
Measurements
As subjects stand up, there are movement-related artifacts that preclude QT interval measurements for ≤5 s, followed by transient sinus tachycardia. One investigator, blinded to the patients’ grouping, performed the measurements specified in the following text at 4 points in time: 1) baseline, during the maximal sinus bradycardia recorded as the patient rested supine; 2) maximal tachycardia, during the fastest sinus rate achieved in response to standing; 3) maximal QT interval, at the time of maximal prolongation (if any) of the QT interval during the first 30 s after standing; and 4) maximal QT interval stretching, time at which (due to R-R interval shortening without QT interval shortening) the end of the T-wave gets nearest to the next P-wave. At all these stages, the QT interval was corrected (QTc) for the heart rate using Bazett’s formula. We then repeated our analysis with the Fridericia and Framingham formulas.
Statistical analysis
To examine the hypothesis that rapid standing influences QT interval parameters of LQTS patients and controls differently, analysis of variance for repeated measures was performed with the RR interval, QT interval, and QTc interval as dependent variables, and with stage (i.e., baseline, maximal tachycardia, and so forth) and subject’s status (LQTS or control) as the between-subject variable. Contrast analysis was then performed to compare QT interval parameters in relation to baseline for both patient groups. We excluded from this analysis all patients with obviously long and obviously normal QT intervals at baseline because additional tests are superfluous for them (5). Accordingly, we limited this analysis to males with baseline QTc interval 390 to 450 ms, and to females with QTc interval 400 to 480 ms (5). DeLong and DeLong’s method was used to compared receiver-operating characteristic (ROC) curves before and after standing. Discriminant analysis was performed to examine the best separation between the 2 groups. For this purpose, 70% of the total sample was randomly selected and a discriminant U function was applied in a stepwise method. Simple comparisons between the 2 groups of patients were done using the Student t test for continuous variables and the chi-square test for categorical variables. Two-tailed p values ≤0.05 were considered significant. Values >1.5 or >3 times the interquartile range are termed regular outliers and extreme outliers, respectively. The SPSS statistical package was used for all statistical evaluation (SSPS Inc., Chicago, Illinois).
Results
The study cohort consisted of 68 patients with LQTS and 82 control subjects. Among LQTS patients, 31 (46%) have LQT1, 28 (41%) have LQT2, 3 (4%) have LQT3, and 6 (9%) have unsuccessfully genotyped LQTS. Patients and control subjects were of similar age. We recruited a similar number of healthy males and females for the control group whereas females predominated in the LQTS group (Table 1, Fig. 1A).
Table 1.
Baseline Characteristics and Response to Standing
| Control Subjects | LQTS Patients | p Value | |
|---|---|---|---|
| Age, yrs | 35 ± 10 | 32 ± 15 | 0.154 |
| Female | 38 (46) | 50 (74) | 0.001 |
| Baseline heart rate, beats/min | 68 ± 10 | 65 ± 11 | 0.166 |
| Baseline QT interval, ms | 383 ± 28 | 449 ± 48 | <0.001 |
| Baseline QTc interval, ms | 405 ± 25 | 465 ± 44 | <0.001 |
| Response to standing | |||
| Time to maximal heart rate, s | 9.8 ± 4.1 | 9.6 ± 4.3 | 0.847 |
| Increment in heart rate, beats/min | 28 ± 10 | 26 ± 11 | 0.261 |
| Maximal heart rate, beats/min | 95 ± 14 | 91 ± 13 | 0.053 |
| ΔQT during maximal tachycardia, ms | −21 ± 19 | 4 ± 34 | <0.001 |
| ΔQTc during maximal tachycardia, ms | 50 ± 30 | 89 ± 47 | <0.001 |
| ΔQT during longest QT interval, ms | −5 ± 34 | 37 ± 44 | <0.001 |
| ΔQTc during longest QT interval, ms | 48 ± 42 | 100 ± 54 | <0.001 |
| ΔQT during maximal QT interval stretching, ms | −15 ± 30 | 13 ± 38 | <0.001 |
| ΔQTc during maximal QT interval stretching, ms | 54 ± 38 | 94 ± 49 | <0.001 |
Data are mean ± SD or n (%).
ΔQT = QT interval change from baseline; ΔQTc = corrected QT interval change from baseline; QTc = corrected QT.
Figure 1. Box Plots of Results Obtained in LQTS Patients and Controls.
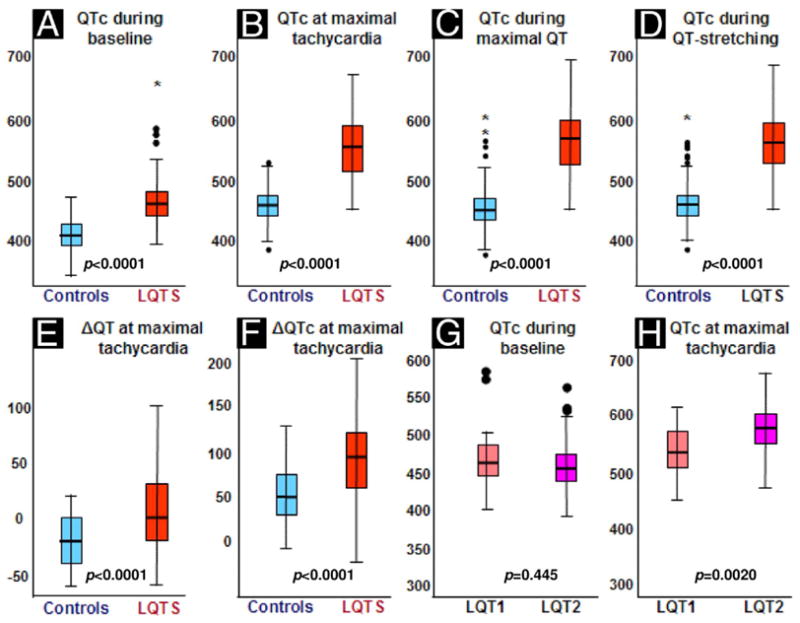
The colored boxes represent the interquartile range (25th to 75th percentiles). (A to F) The red boxes represent long QT syndrome (LQTS) patients; the blue boxes represent control subjects. (G and H) The orange boxes represent LQT1 patients; the purple boxes represent LQT2 patients. The thick black line in the box is the 50th percentile, and the bars represent the range of results excluding outliers. Solid black circles indicate outliers and * indicates extreme outliers. ΔQT = QT interval change from baseline; ΔQTc = corrected QT interval change from baseline.
Normal response of the QT interval to standing
In response to standing, the sinus rate increased within 10 s to 95 ± 14 beats/min (Table 1). Males and females had similar heart rate acceleration (p = 0.7), and the response of their QT interval to this heart rate speeding was similar (the QT interval shortened by 20 ± 19 ms in both sexes, p = 0.8). Since the QT interval decreased less than the RR interval during standing-induced tachycardia, the QTc interval of control subjects increased (by 50 ± 28 ms [12 ± 7%] in males and by 50 ± 32 ms [13 ± 9%] in females, p = 0.9).
Response of patients with LQTS
The LQTS patients and control subjects had similar heart rate acceleration in response to standing (Table 1). However, the response of their QT interval to this sudden change in heart rate was different (Figs. 2, 3, and 4). During maximal sinus tachycardia, the QT interval of controls shortened by ≥20 ms in 59%, remained unchanged (varied by <20 ms) in 39%, and increased by ≥20 ms in only 2%. In contrast, among LQTS patients, the QT interval shortened in only 24%, remained unchanged in 43%, and actually increased in 34% (p < 0.001). Thus, while the averaged QT interval of controls shortened by 21 ± 19 ms, the QT interval of LQTS patients hardly changed (it lengthened by 4 ± 34 ms, p < 0.001) (Fig. 1E). Consequently, during maximal tachycardia, the QTc interval of controls increased by only 50 ± 30 ms (13 ± 8% from baseline), whereas the QTc interval of LQTS patients increased by 89 ± 47 ms (20 ± 11% from baseline, p < 0.001) (Fig. 1F).
Figure 2. QT Interval Stretching in Healthy Control Subject and in LQT2 Patient.
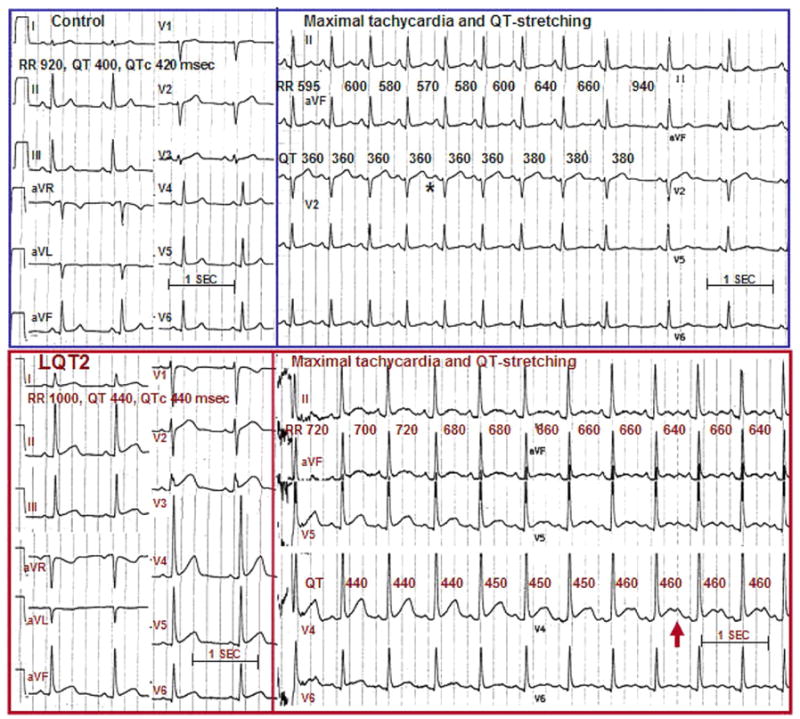
(Top trace) A 39-year-old healthy volunteer. At baseline (left panel), heart rate is 65 beats/min, QT interval is 400 ms, and corrected QT interval (QTc) is 420 ms. Six seconds after standing (right panel), the shortest RR interval is 570 ms; by then, the QT interval has shortened to 360 ms. Since the RR interval shortened more than the QT interval, the QTc interval increased to 480 ms. Maximal QT interval stretching (when the end of the T-wave is nearest the next P-wave) is marked (*). (Bottom trace) A 38-year-old man with long QT syndrome mutation LQT2. At baseline, heart rate is 60 beats/min, QT interval and QTc interval are 440 ms. Note the fairly normal T-wave morphology. Shortly after standing (right panel), motion artifact is visible; the shortest RR interval is 640 ms, and by then the QT interval actually increased to 460 ms. Consequently, the QTc interval increased to 570 ms. Note the development of classic T-wave notching while standing.
Figure 3. QT Interval Stretching in LQT1.

A 22-year-old woman with long QT syndrome mutation LQT1. (Left panel) At baseline, heart rate is 68 beats/min, QT interval is 480 ms, and corrected QT interval (QTc) is 512 ms. (Middle panel) Immediately after standing, there is movement artifact; heart rate increases to 82 beats/min but the QT interval fails to shorten, and the QTc interval increases to 582 ms (the QT interval stretches all the way to the next P-wave). (Right panel) At the end of the test, heart rate returns to baseline but the QT interval remains prolonged, and the QTc interval is 565 ms long and has abnormal morphology.
Figure 4. Provocation of Ventricular Arrhythmias by Standing in LQTS.

A 34-year-old woman with previous cardiac arrest and documented pause-dependent torsades de pointes. (Left panel) At baseline, heart rate is 83 beats/min, QT interval is 400 ms, and corrected QT interval (QTc) is 470 ms. (Middle panel) During maximal tachycardia (8 s after standing), heart rate is 115 beats/min, QT interval is 440, and QTc interval is 461 ms. (Right panel) Ventricular extrasystoles appear during maximal QT interval stretching 15 s after standing. Note that the post-extrasystolic pauses (*) expose the small amplitude of P waves (arrows). It is therefore evident that during sinus tachycardia there is a late component of a very long QT interval on top of the P-wave (arrowheads).
We then identified the complex with the longest uncorrected QT interval during standing-induced tachycardia. Despite a similar heart rate at this point, only the QT interval of LQTS patients had increased in comparison to baseline (by 37 ± 44 ms; p = 0.001).
At the point of maximal QT interval stretching, the QTc interval increased by 54 ± 38 ms in control subjects and by 94 ± 49 ms in LQTS patients (p < 0.001) (Fig. 1D). Ventricular extrasystoles representing early afterdepolarizations (1) or T-wave alternans were observed during maximal QT interval stretching in 4 LQTS patients (Fig. 4).
Analysis of our results after excluding LQTS patients with very long baseline QT interval or with unknown genotype, or with the use of Fridericia’s or Framingham study formulas, also showed that the difference in QTc interval between LQTS patients and control subjects at all stages of the test was statistically significant.
Comparison of LQT1 and LQT2
Patients with LQT1 and LQT2 had similar baseline QT/QTc interval and had similar heart rate acceleration upon standing (Table 2). However, the groups had discordant responses of the QT interval: the QT interval of LQT1 patients shortened by 8 ± 32 ms, whereas it lengthened by 21 ± 28 ms in LQT2 patients. Consequently, LQT2 patients displayed the maximal QTc interval prolongation (Table 2, Figs. 1G and 1H).
Table 2.
Baseline Characteristics and Response to Standing, LQT1 Versus LQT2
| LQT1 (n = 31) | LQT2 (n = 28) | p Value | |
|---|---|---|---|
| Age, yrs | 33 ± 15 | 30 ± 13 | 0.400 |
| Female | 21 (68) | 23 (82) | 0.243 |
| Baseline heart rate, beats/min | 67 ± 11 | 62 ± 9 | 0.051 |
| Baseline QT interval, ms | 445 ± 42 | 455 ± 45 | 0.375 |
| Baseline QTc interval, ms | 468 ± 39 | 460 ± 39 | 0.445 |
| Response to standing | |||
| Increment in heart rate, beats/min | 24 ± 10 | 26 ± 11 | 0.474 |
| Maximal heart rate, beats/min | 95 ± 14 | 91 ± 13 | 0.053 |
| Δ QT during maximal tachycardia, ms | −8 ± 32 | 21 ± 28 | 0.001 |
| Δ QTc during maximal tachycardia, ms | 67 ± 41 | 114 ± 42 | <0.001 |
| Δ QTc during longest QT interval, ms | 80 ± 50 | 126 ± 49 | 0.001 |
| Δ QTc during maximal QT interval stretching, ms | 73 ± 43 | 119 ± 48 | <0.001 |
Data are mean ± SD or n (%).
Abbreviations as in Table 1.
Diagnostic value of the test
The QTc interval of LQTS patients and control subjects was different already at baseline, but the difference increased during standing (Figs. 1A to 1D). The ROC curves demonstrate incremental diagnostic value (Table 3). For example, for the population with QTc interval 390 to 480 ms at baseline, the baseline QTc interval that identified LQTS with 90% sensitivity had only 61% specificity. In contrast, during maximal QT interval stretching, the QTc interval value identifying LQTS with 90% sensitivity also had 86% specificity. With DeLong and De-Long analysis, the ROC curves of QT and QTc intervals at maximal heart rate were significantly better than the ROC curves for baseline QT interval (p = 0.008) and QTc interval (p = 0.026).
Table 3.
ROC Curve Analysis of Variables
| 90% Sensitivity |
||||
|---|---|---|---|---|
| AUC | 95% CI | Cutoff | Specificity | |
| Baseline QT interval | 0.836 | 0.758–0.914* | 395 | 50.9% |
| Baseline QTc interval | 0.850 | 0.775–0.925* | 423 | 61.4% |
| QT interval at maximal heart rate | 0.900 | 0.840–0.960* | 375 | 70.2% |
| QTc interval at maximal heart rate | 0.933 | 0.889–0.978* | 474 | 75.4% |
| QTc interval during QT interval stretching | 0.923 | 0.874–0.973* | 487 | 86.0% |
p < 0.001 for all receiver-operating characteristic (ROC) curves.
AUC = area under the curve; CI = confidence interval; QTc = corrected QT.
Discussion
Accurate diagnosis of the LQTS is crucial because this is a potentially lethal disorder for which effective therapy exists. We report that just observing the response of the QT interval to the sudden heart rate acceleration provoked by quick standing provides diagnostic information.
Normal response of QT interval to brisk standing
That the QT interval shortening in response to sudden heart rate acceleration is not instantaneous has been known for almost a century (11). Already in 1920, Bazett (11) emphasized that with exercise, the heart rate increases promptly but the QT interval shortens more slowly. Animal (12) and clinical (6) studies show that after an abrupt increase in ventricular pacing rate, it takes up to 2 min until the ventricular refractory period (12) and the QT interval (6) shorten (accommodate) to a new steady state. Beat-to-beat analysis of the human action potential shows that during a sudden increase in pacing rate, the action potential shortens abruptly at the first fast heart beat but then requires several hundred beats to finally shorten to a new steady state (7). In our study, maximal heart rate acceleration occurred within 15 s of standing, and such timing is too short for QT interval accommodation (7). Thus, the insufficient QT interval shortening of our healthy control subjects is actually expected. That during standing-induced sinus tachycardia the QT interval shortened in 59% of controls, while it remained unchanged in the rest, is consistent with observations from Holter recordings in healthy volunteers (13). Such studies show that the speed of response of the QT interval to sudden changes in heart rate is highly individual and independent of the basic QTc interval (13).
Response of LQTS patients to brisk standing
Adaptation of the QT interval to gradual changes in heart rate is impaired in the LQTS (8), and we show that this maladaptation worsens when the changes in heart rate are sudden. The sympathetic stimulation that occurs while standing affects the QT interval independently of the concomitant tachycardia (14); such adrenergic stimulation would be expected to exert different effects on patients with normal versus abnormal QT interval (15,16).
The LQT2 patients had maximal QTc prolongation in response to standing. This observation was unexpected because during epinephrine infusion tests, the largest QT interval changes occur in LQT1 patients (16). However, predominant prolongation of the M-cell action potential—leading to increased transmural dispersion of repolarization and early afterdepolarization activity—is a well-recognized response to sudden heart rate acceleration in models of LQT2 (17). Interestingly, clinical arrhythmias in LQT2 patients are characteristically triggered by situations involving sudden (as opposed to gradual) heart rate acceleration, like sudden startling by noise (18).
Study limitations
Although all QT interval measurements were performed by a blinded investigator, the QT interval duration and T-wave morphology would often reveal the patients’ identity. Thus, potential for biased measurements exists. However, a small study comparing the effects of standing on 16 patients with LQT2 and 27 control subjects also showed significantly larger increments in the QTc interval of LQT2 patients (19).
Conclusions
Diagnostic implications
Our test is easy to perform and should be used in addition to more accepted tests when necessary. Conversely, it is important to avoid overdiagnosis of LQTS based on QTc interval estimations performed when the patient stands. We have patients referred for evaluation after the incidental finding of long QT interval in a single ECG but with strictly normal QT interval in subsequent recordings. In these cases, the culprit ECG was the baseline ECG of an exercise test. Rather than representing a truly resting ECG, these were traces demonstrating the normal QTc-interval prolongation in response to brisk standing immediately before exercise. Similarly, inadvertent QT interval stretching during Holter recordings may lead to overdiagnosis of LQTS.
Clinical implications
The onset of QT interval-related ventricular ectopy observed in a few LQTS patients upon standing suggests that untreated patients are at risk for more serious arrhythmias every time they stand up. This finding is important because physicians are likely to misinterpret syncope as vasovagal if it occurred upon standing. Interestingly, standing is reported as trigger for syncope by one-third of symptomatic LQTS patients (20). We did not evaluate the effects of therapy, but Walker et al. (19) reported that beta-blocker therapy attenuates the QT interval stretching effects of standing.
Research implications
An intriguing aspect of this study relates to the outliers in the control group. A few control subjects demonstrated exaggerated QT interval stretching during standing that was of the magnitude observed in the LQTS group (Figs. 1C and 1D). Rather than simply representing false positives, it is possible that these are persons with normal QT interval but impaired repolarization reserve. Larger studies should be conducted to determine whether these outliers share genotypic characteristics or demonstrate exaggerated QT interval prolongation in response to drugs or other insults.
Acknowledgments
The authors thank Ori Rogowski for performing the statistical analysis and Hila Zohar and Ilana Meir for providing invaluable technical help.
Financial support is provided by the Netherlands Heart Foundation Grant 2005T024 (Dr. Postema).
Abbreviations and Acronyms
- AUC
area under the curve
- ECG
electrocardiogram
- IQR
interquartile range
- LQTS
long QT syndrome
- ROC
receiver-operating characteristic
References
- 1.Viskin S. The long QT syndromes and torsade de pointes. Lancet. 1999;354:1625–33. doi: 10.1016/S0140-6736(99)02107-8. [DOI] [PubMed] [Google Scholar]
- 2.Moss AJ. Long QT syndrome. JAMA. 2003;289:2041–4. doi: 10.1001/jama.289.16.2041. [DOI] [PubMed] [Google Scholar]
- 3.Vincent GM, Timothy KW, Leppert M, Keating M. The spectrum of symptoms and QT intervals in carriers of the gene for the long QT syndrome. N Engl J Med. 1992;327:846–52. doi: 10.1056/NEJM199209173271204. [DOI] [PubMed] [Google Scholar]
- 4.Vincent GM. Role of DNA testing for diagnosis, management and genetic screening in long QT syndrome, hypertrophic cardiomyopathy and Marfan syndrome. J Cardiovasc Electrophysiol. 2001;86:12–4. doi: 10.1136/heart.86.1.12. [DOI] [PMC free article] [PubMed] [Google Scholar]
- 5.Viskin S. The QT interval: too long, too short or just right. Heart Rhythm. 2009;6:711–5. doi: 10.1016/j.hrthm.2009.02.044. [DOI] [PubMed] [Google Scholar]
- 6.Lau CP, Freedman AR, Fleming S, Malik M, Camm AJ, Ward DE. Hysteresis of the ventricular paced QT interval in response to abrupt changes in pacing rate. Cardiovasc Res. 1988;22:67–72. doi: 10.1093/cvr/22.1.67. [DOI] [PubMed] [Google Scholar]
- 7.Franz MR, Swerdlow CD, Liem LB, Schaefer J. Cycle length dependence of human action potential duration in vivo. Effects of single extrastimuli, sudden sustained rate acceleration and deceleration, and different steady-state frequencies. J Clin Invest. 1988;82:972–9. doi: 10.1172/JCI113706. [DOI] [PMC free article] [PubMed] [Google Scholar]
- 8.Merri M, Moss AJ, Benhorin J, Locati EH, Alberti M, Badilini F. Relation between ventricular repolarization duration and cardiac cycle length during 24-hour Holter recordings. Findings in normal patients and patients with long QT syndrome. Circulation. 1992;85:1816–21. doi: 10.1161/01.cir.85.5.1816. [DOI] [PubMed] [Google Scholar]
- 9.Tan HL, Bardai A, Shimizu W, et al. Genotype-specific onset of arrhythmias in congenital long-QT syndrome: possible therapy implications. Circulation. 2006;114:2096–103. doi: 10.1161/CIRCULATIONAHA.106.642694. [DOI] [PubMed] [Google Scholar]
- 10.Schwartz PJ, Moss AJ, Vincent GM, Crampton RS. Diagnostic criteria for the long QT syndrome. An update. Circulation. 1993;88:782–4. doi: 10.1161/01.cir.88.2.782. [DOI] [PubMed] [Google Scholar]
- 11.Bazett HC. An analysis of the time-relations of electrocardiograms. Heart. 1920;7:353–70. [Google Scholar]
- 12.Janse MJ, van der Steen AB, van Dam RT. Refractory period of the dog’s ventricular myocardium following sudden changes in frequency. Circ Res. 1969;24:251–62. doi: 10.1161/01.res.24.2.251. [DOI] [PubMed] [Google Scholar]
- 13.Malik M, Hnatkova K, Novotny T, Schmidt G. Subject-specific profiles of QT/RR hysteresis. Am J Physiol Heart Circ Physiol. 2008;295:H2356–63. doi: 10.1152/ajpheart.00625.2008. [DOI] [PubMed] [Google Scholar]
- 14.Browne E, Zipes D, Heger J, Prystowsky E. Influence of the autonomic nervous system on the QT interval in man. Am J Cardiol. 1982;50:1099–103. doi: 10.1016/0002-9149(82)90425-8. [DOI] [PubMed] [Google Scholar]
- 15.Antzelevitch C. Sympathetic modulation of the long QT syndrome. Eur Heart J. 2002;23:1246–52. doi: 10.1053/euhj.2002.3287. [DOI] [PubMed] [Google Scholar]
- 16.Ackerman MJ, Khositseth A, Tester DJ, Hejlik JB, Shen WK, Porter CB. Epinephrine-induced QT interval prolongation: a gene-specific paradoxical response in congenital long QT syndrome. Mayo Clin Proc. 2002;77:413–21. doi: 10.4065/77.5.413. [DOI] [PubMed] [Google Scholar]
- 17.Burashnikov A, Antzelevitch C. Acceleration-induced action potential prolongation and early afterdepolarizations. J Cardiovasc Electrophysiol. 1998;9:934–48. doi: 10.1111/j.1540-8167.1998.tb00134.x. [DOI] [PubMed] [Google Scholar]
- 18.Schwartz PJ, Priori SG, Spazzolini C, et al. Genotype-phenotype correlation in the long-QT syndrome: gene-specific triggers for life-threatening arrhythmias. Circulation. 2001;103:89–95. doi: 10.1161/01.cir.103.1.89. [DOI] [PubMed] [Google Scholar]
- 19.Walker BD, Krahn AD, Klein GJ, et al. Effect of change in posture and exercise on repolarization in patients with long QT syndrome with HERG channel mutations. Can J Cardiol. 2005;21:33–8. [PubMed] [Google Scholar]
- 20.Colman N, Bakker A, Linzer M, Reitsma JB, Wieling W, Wilde AA. Value of history-taking in syncope patients: in whom to suspect long QT syndrome? Europace. 2009;11:937–43. doi: 10.1093/europace/eup101. [DOI] [PubMed] [Google Scholar]